The odor of a nontoxic tetrodotoxin analog, 5,6,11-trideoxytetrodotoxin, is detected by specific olfactory sensory neurons of the green spotted puffers
- PMID: 38771102
- PMCID: PMC11258809
- DOI: 10.1093/chemse/bjae021
The odor of a nontoxic tetrodotoxin analog, 5,6,11-trideoxytetrodotoxin, is detected by specific olfactory sensory neurons of the green spotted puffers
Abstract
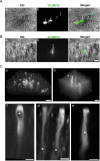
Toxic puffers accumulate tetrodotoxin (TTX), a well-known neurotoxin, by feeding on TTX-bearing organisms and using it to defend themselves from predators. Our previous studies have demonstrated that toxic puffers are attracted to 5,6,11-trideoxytetrodotoxin (TDT), a nontoxic TTX analog that is simultaneously accumulated with TTX in toxic puffers and their prey. In addition, activity labeling using immunohistochemistry targeting neuronal activity marker suggests that TDT activates crypt olfactory sensory neurons (OSN) of the green spotted puffer. However, it remains to be determined whether individual crypt OSNs can physiologically respond to TDT. By employing electroporation to express GCaMP6s in OSNs, we successfully identified a distinct group of oval OSNs that exhibited a specific calcium response when exposed to TDT in green spotted puffers. These oval OSNs showed no response to amino acids (AAs), which serve as food odor cues for teleosts. Furthermore, oval morphology and surface positioning of TDT-sensitive OSNs in the olfactory epithelium closely resemble that of crypt OSNs. These findings further substantiate that TDT is specifically detected by crypt OSNs in green spotted puffer. The TDT odor may act as a chemoattractant for finding conspecific toxic puffers and for feeding TTX-bearing organisms for effective toxification.
Keywords: calcium imaging; chemical communication; electroporation; feeding; toxification.
© The Author(s) 2024. Published by Oxford University Press.
Conflict of interest statement
The authors declare no competing or financial interests.
Figures


Similar articles
-
Green spotted puffers detect a nontoxic TTX analog odor using crypt olfactory sensory neurons.Chem Senses. 2022 Jan 1;47:bjac011. doi: 10.1093/chemse/bjac011. Chem Senses. 2022. PMID: 35580574
-
An almost nontoxic tetrodotoxin analog, 5,6,11-trideoxytetrodotoxin, as an odorant for the grass puffer.Sci Rep. 2022 Sep 5;12(1):15087. doi: 10.1038/s41598-022-19355-6. Sci Rep. 2022. PMID: 36064732 Free PMC article.
-
5, 6, 11-trideoxy tetrodotoxin attracts tiger puffer Takifugu rubripes.Toxicon. 2024 Jan;237:107539. doi: 10.1016/j.toxicon.2023.107539. Epub 2023 Nov 30. Toxicon. 2024. PMID: 38042308
-
Developmental regulation of olfactory circuit formation in mice.Dev Growth Differ. 2020 May;62(4):199-213. doi: 10.1111/dgd.12657. Epub 2020 Feb 28. Dev Growth Differ. 2020. PMID: 32112394 Free PMC article. Review.
-
Tetrodotoxin--distribution and accumulation in aquatic organisms, and cases of human intoxication.Mar Drugs. 2008 May 28;6(2):220-42. doi: 10.3390/md20080011. Mar Drugs. 2008. PMID: 18728726 Free PMC article. Review.
Cited by
-
Tetrodotoxin: The State-of-the-Art Progress in Characterization, Detection, Biosynthesis, and Transport Enrichment.Mar Drugs. 2024 Nov 26;22(12):531. doi: 10.3390/md22120531. Mar Drugs. 2024. PMID: 39728106 Free PMC article. Review.
References
-
- Adachi M, Sakakibara R, Satake Y, Isobe M, Nishikawa T.. Synthesis of 5,6,11-trideoxytetrodotoxin. Chem Lett. 2014:43:1719–1721.
-
- Bazáes A, Schmachtenberg O.. Odorant tuning of olfactory crypt cells from juvenile and adult rainbow trout. J Exp Biol. 2012:215:1740–1748. - PubMed
-
- Chen J, Katada Y, Okimura K, Yamaguchi T, Guh Y-J, Nakayama T, Maruyama M, Furukawa Y, Nakane Y, Yamamoto N, et al.. Prostaglandin E2 synchronizes lunar-regulated beach spawning in grass puffers. Curr Biol. 2022:32:4881–4889.e5. - PubMed
MeSH terms
Substances
LinkOut - more resources
Full Text Sources

