

Identification of a methyltransferase-related long noncoding RNA signature as a novel prognosis biomarker for lung adenocarcinoma
- PMID: 38771129
- PMCID: PMC11164517
- DOI: 10.18632/aging.205837
Identification of a methyltransferase-related long noncoding RNA signature as a novel prognosis biomarker for lung adenocarcinoma
Abstract
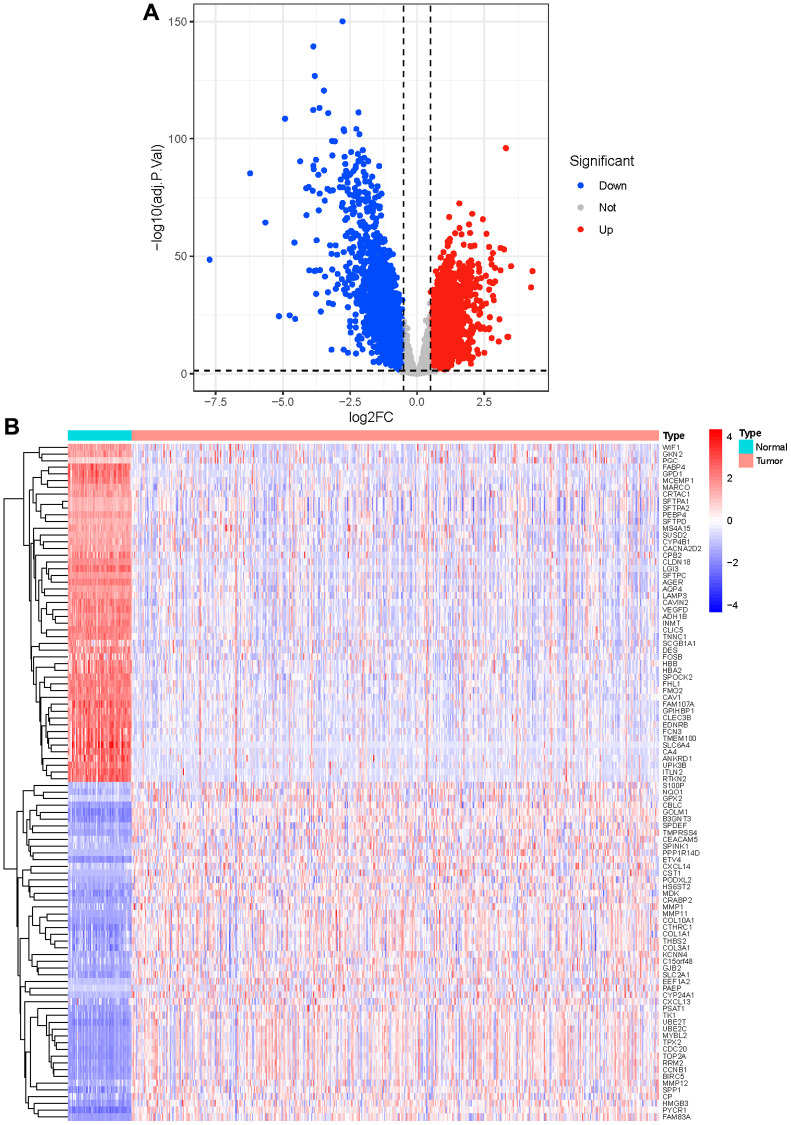
Background: Lung adenocarcinoma (LUAD) accounts for a high proportion of tumor deaths globally, while methyltransferase-related lncRNAs in LUAD were poorly studied.
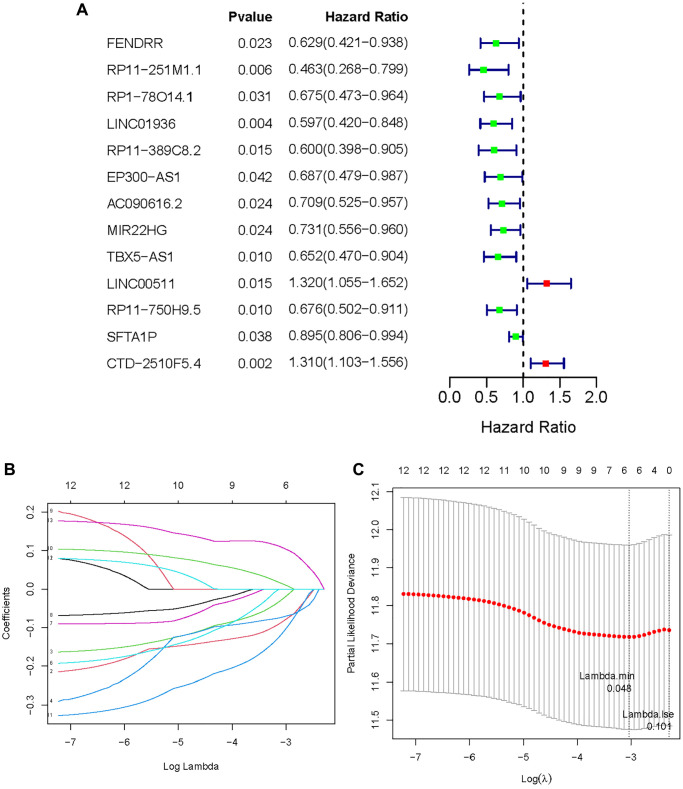
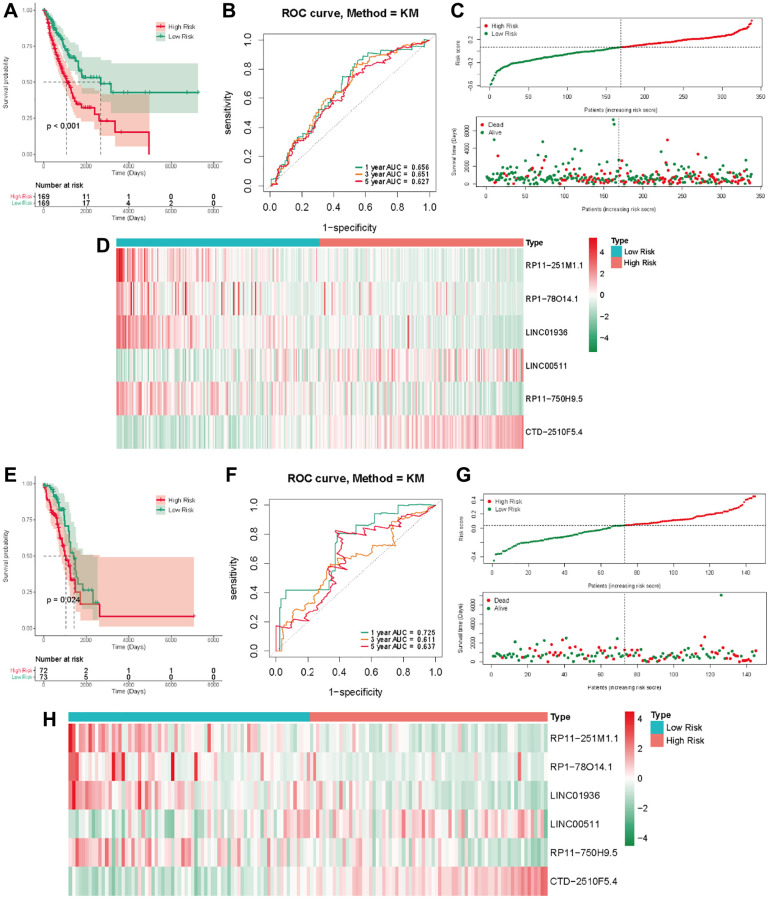
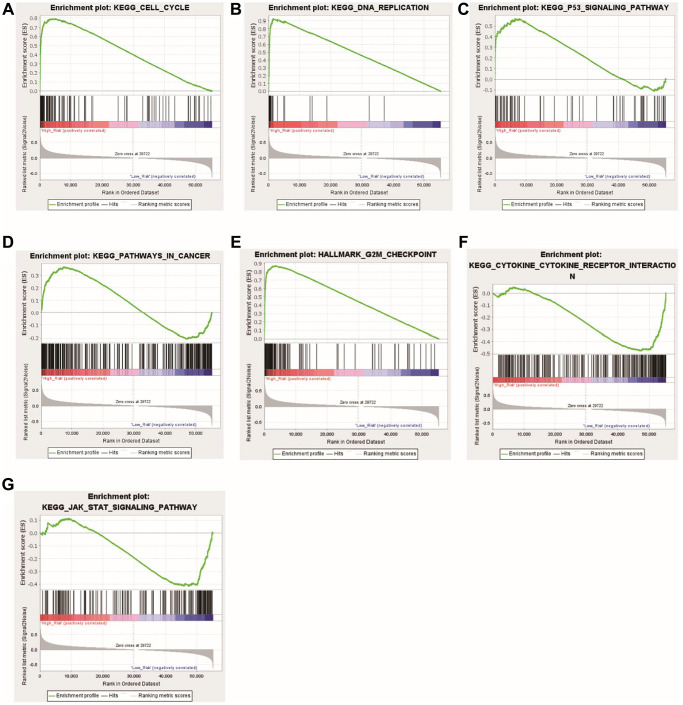
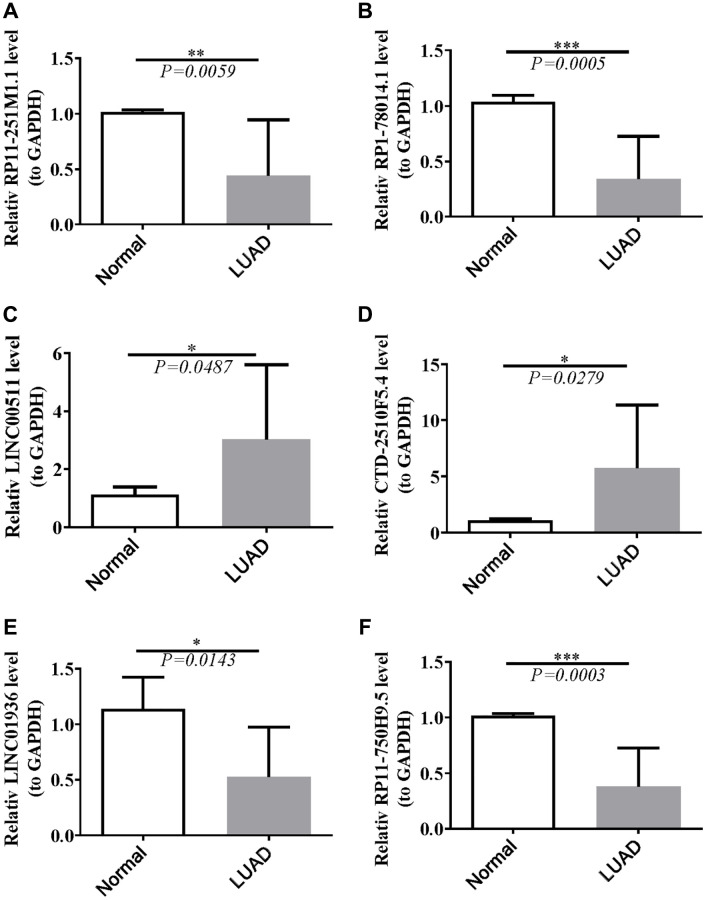
Methods: In our study, we focused on two distinct cohorts, TCGA-LUAD and GSE3021, to establish a signature of methyltransferase-related long non-coding RNAs (MeRlncRNAs) in LUAD. We employed univariate Cox and LASSO regression analyses as our main analytical tools. The GSE30219 cohort served as the validation cohort for our findings. Furthermore, to explore the differential pathway enrichments between groups stratified by risk, we utilized Gene Set Enrichment Analysis (GSEA). Additionally, single-sample GSEA (ssGSEA) was conducted to assess the immune infiltration landscape within each sample. Reverse transcription quantitative PCR (RT-qPCR) was also performed to verify the expression of prognostic lncRNAs in both clinically normal and LUAD samples.
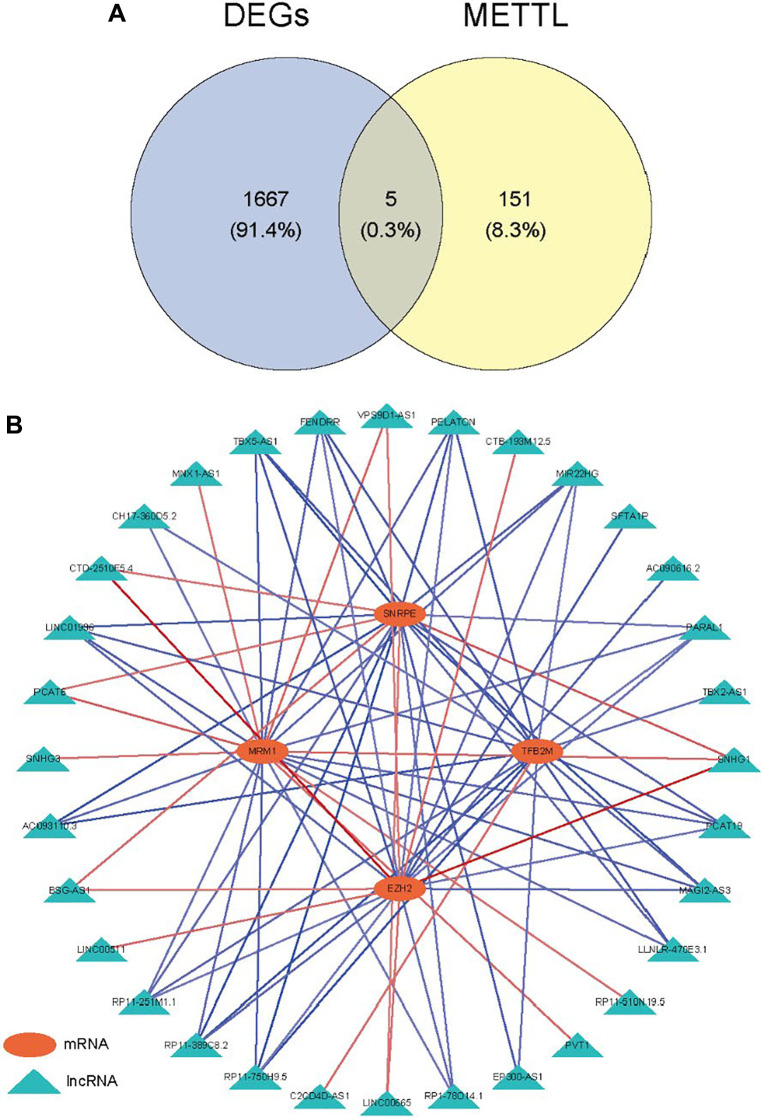
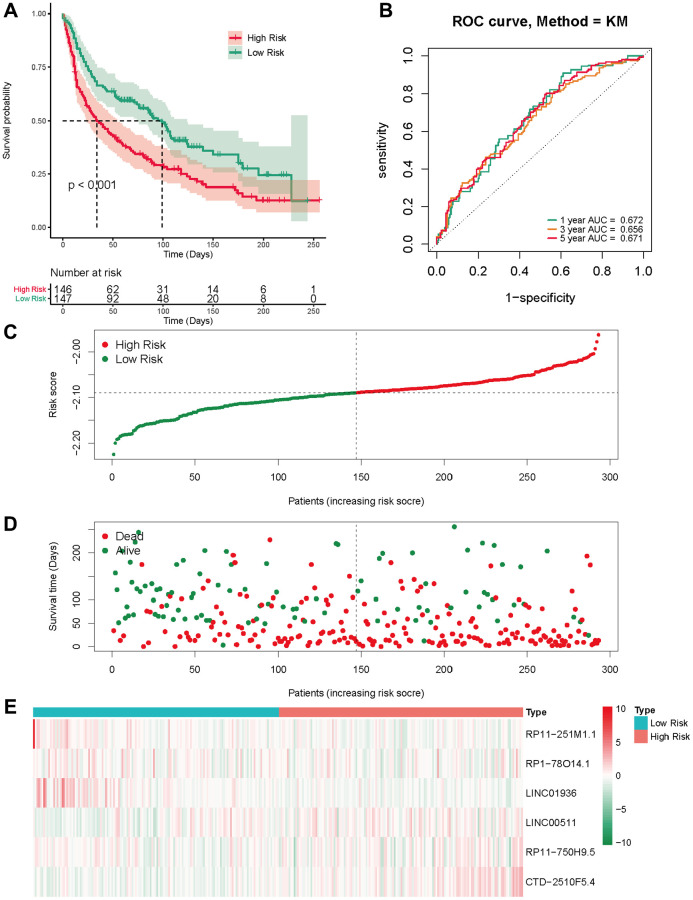
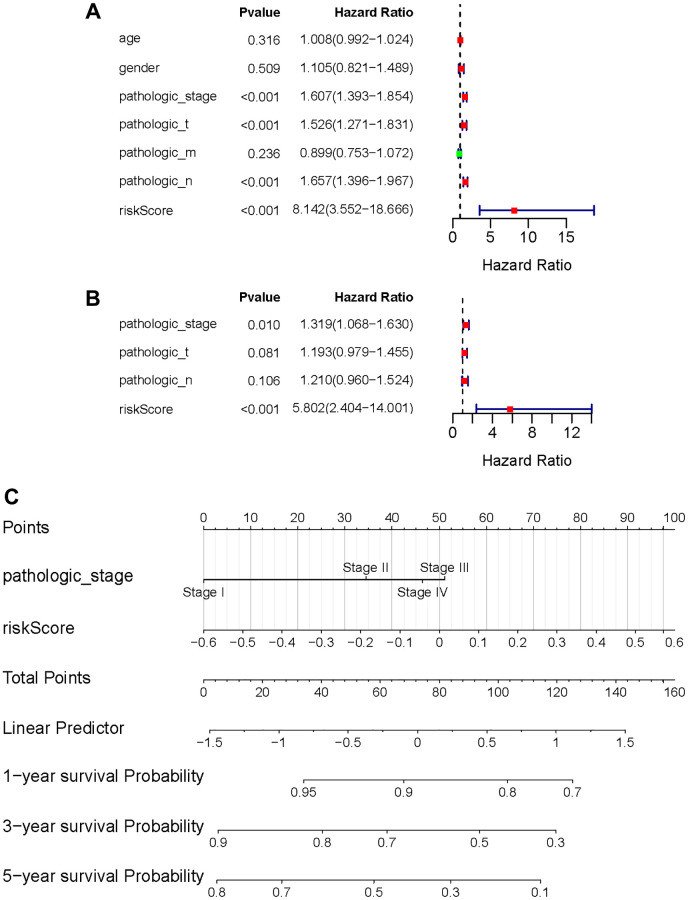
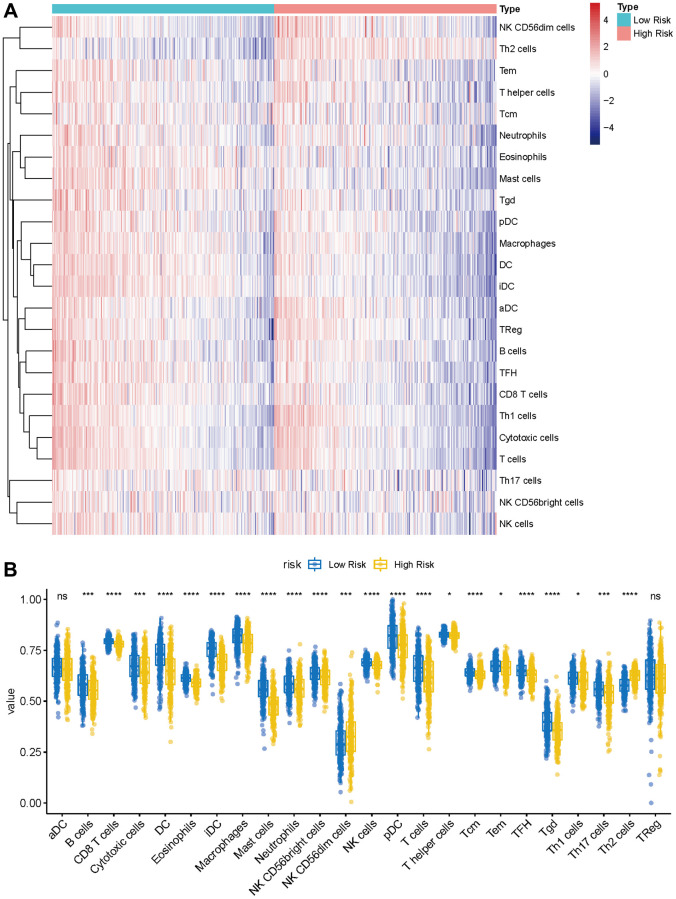
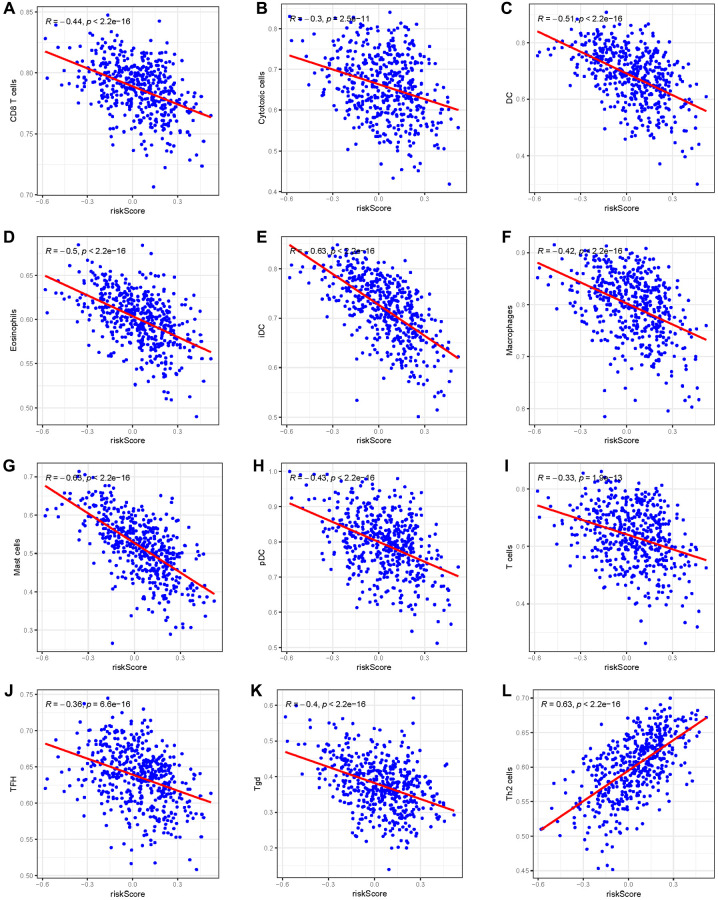
Results: In LUAD, we identified a set of 32 MeRlncRNAs. We further narrowed our focus to six prognostic lncRNAs to develop gene signatures. The TCGA-LUAD cohort and GSE30219 were utilized to validate the risk score model derived from these signatures. Our analysis showed that the risk score served as an independent prognostic factor, linked to immune-related pathways. Additionally, the analysis of immune infiltration revealed that the immune landscape in high-risk groups was suppressed, which could contribute to poorer prognoses. We also constructed a regulatory network comprising 6 prognostic lncRNAs, 19 miRNAs, and 21 mRNAs. Confirmatory RT-qPCR results aligned with public database findings, verifying the expression of these prognostic lncRNAs in the samples.
Conclusion: The prognostic gene signature of LUAD associated with MeRlncRNAs that we provided, may offer us a comprehensive picture of the prognosis prediction for LUAD patients.
Keywords: GSEA; immune infiltration; lung adenocarcinoma; methyltransferase-related lncRNAs; prognosis.
Conflict of interest statement
Figures

Similar articles
-
A methylation-related lncRNA-based prediction model in lung adenocarcinomas.Clin Respir J. 2024 Aug;18(8):e13753. doi: 10.1111/crj.13753. Clin Respir J. 2024. PMID: 39187946 Free PMC article.
-
Disulfidptosis-related lncRNAs signature predicting prognosis and immunotherapy effect in lung adenocarcinoma.Aging (Albany NY). 2024 Jun 10;16(11):9972-9989. doi: 10.18632/aging.205911. Epub 2024 Jun 10. Aging (Albany NY). 2024. PMID: 38862217 Free PMC article.
-
Prognostic risk model of six m7 g-related lncRNAs in lung adenocarcinoma.Eur J Med Res. 2025 Jun 10;30(1):468. doi: 10.1186/s40001-025-02744-8. Eur J Med Res. 2025. PMID: 40490831 Free PMC article.
-
Identification and validation of a novel redox-related lncRNA prognostic signature in lung adenocarcinoma.Bioengineered. 2021 Dec;12(1):4331-4348. doi: 10.1080/21655979.2021.1951522. Bioengineered. 2021. PMID: 34338158 Free PMC article.
-
Identification of an immune-related six-long noncoding RNA signature as a novel prognosis biomarker for adenocarcinoma of lung.Biosci Rep. 2021 Jan 29;41(1):BSR20202444. doi: 10.1042/BSR20202444. Biosci Rep. 2021. PMID: 33324975 Free PMC article.
References
-
- Raez LE, Cardona AF, Santos ES, Catoe H, Rolfo C, Lopes G, Barrios C, Mas LA, Vallejos C, Zatarain-Barrón ZL, Caglevic C, Arrieta O. The burden of lung cancer in Latin-America and challenges in the access to genomic profiling, immunotherapy and targeted treatments. Lung Cancer. 2018; 119:7–13. 10.1016/j.lungcan.2018.02.014 - DOI - PubMed
Publication types
MeSH terms
Substances
LinkOut - more resources
Full Text Sources
Medical
