. 2024 May 21;134(13):e175057.
doi: 10.1172/JCI175057.

Mechanosensitive membrane domains regulate calcium entry in arterial endothelial cells to protect against inflammation

Affiliations

Mechanosensitive membrane domains regulate calcium entry in arterial endothelial cells to protect against inflammation

Soon-Gook Hong et al. J Clin Invest. .

Abstract

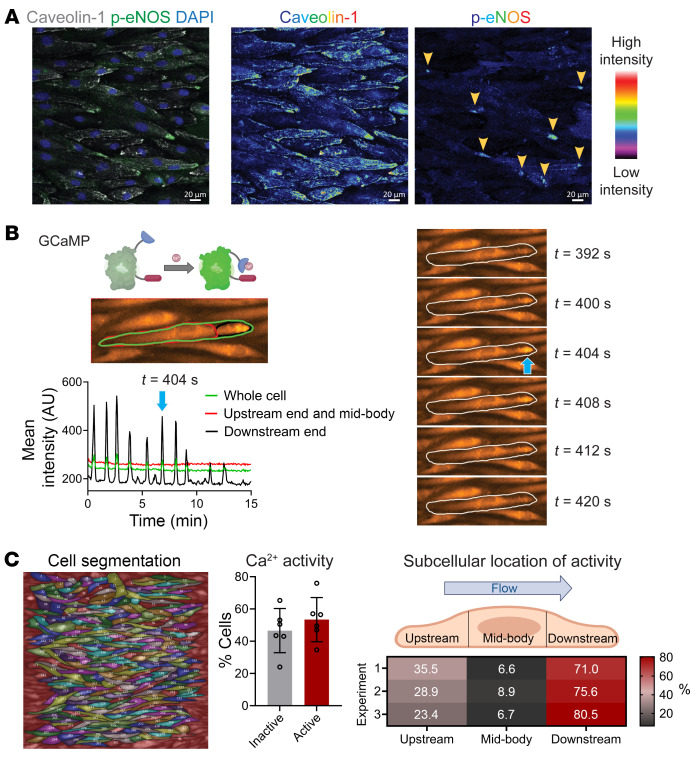
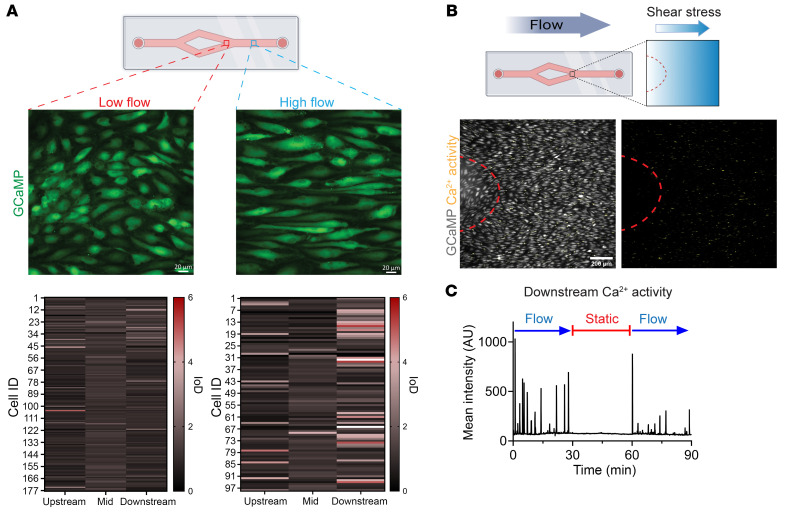
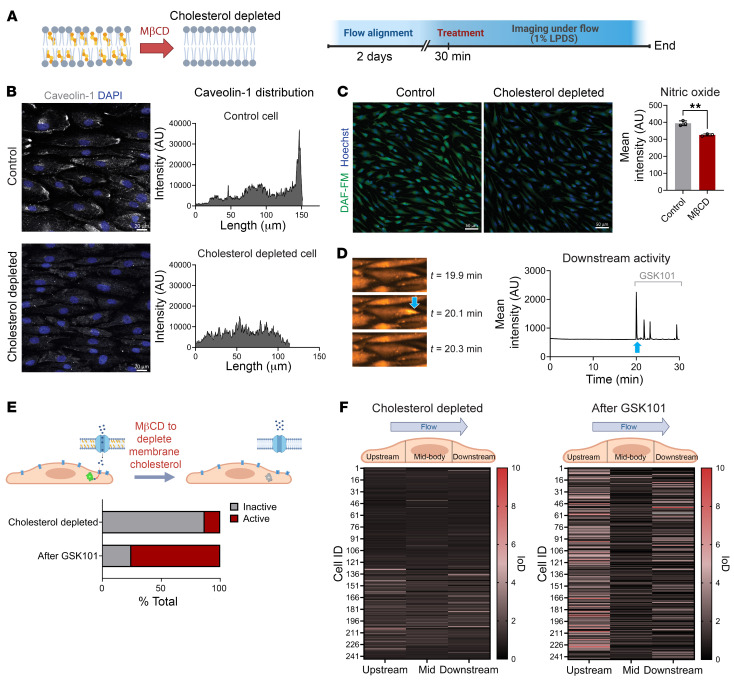
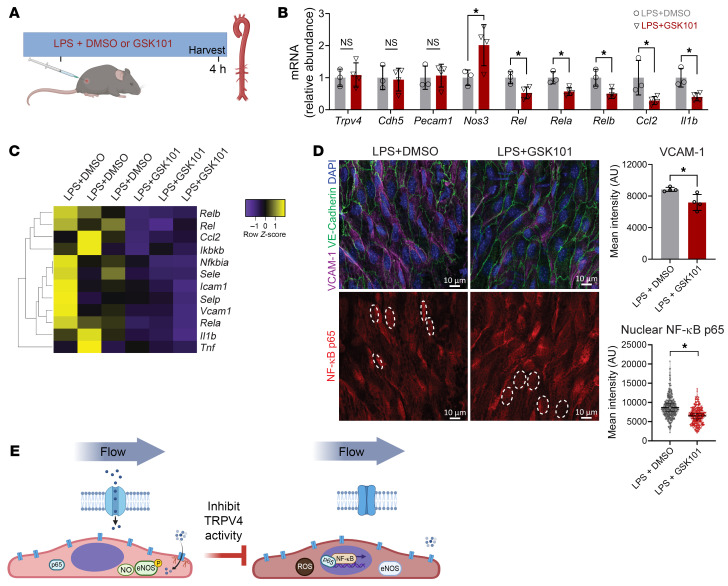
Endothelial cells (ECs) in the descending aorta are exposed to high laminar shear stress, and this supports an antiinflammatory phenotype. High laminar shear stress also induces flow-aligned cell elongation and front-rear polarity, but whether these are required for the antiinflammatory phenotype is unclear. Here, we showed that caveolin-1-rich microdomains polarize to the downstream end of ECs that are exposed to continuous high laminar flow. These microdomains were characterized by high membrane rigidity, filamentous actin (F-actin), and raft-associated lipids. Transient receptor potential vanilloid (TRPV4) ion channels were ubiquitously expressed on the plasma membrane but mediated localized Ca2+ entry only at these microdomains where they physically interacted with clustered caveolin-1. These focal Ca2+ bursts activated endothelial nitric oxide synthase within the confines of these domains. Importantly, we found that signaling at these domains required both cell body elongation and sustained flow. Finally, TRPV4 signaling at these domains was necessary and sufficient to suppress inflammatory gene expression and exogenous activation of TRPV4 channels ameliorated the inflammatory response to stimuli both in vitro and in vivo. Our work revealed a polarized mechanosensitive signaling hub in arterial ECs that dampened inflammatory gene expression and promoted cell resilience.

Keywords: Calcium signaling; Cell biology; Endothelial cells; Vascular biology.


Conflict of interest statement

Conflict of interest: The authors have declared that no conflict of interest exists.

Figures

Figure 1
Figure 1. Membrane polarization and caveolin-1–enriched microdomains in aortic ECs exposed to laminar flow.
(A) Confocal imaging of caveolin-1 in the endothelium of mouse descending aorta. Individual cells were segmented into 3 equal-length regions (upstream, mid-body, and downstream), and staining intensity was determined in each segment for 216 cells from n = 4 aortae. Graph displays mean ± SD with data analyzed by 1-way ANOVA and post hoc Tukey’s multiple-comparison test. Scale bar: 20 μm. (BH) Confluent monolayers of HAECs were exposed to laminar shear stress (20 dynes/cm2) for 48 hours, then imaged. (B) HAECs were stained for caveolin-1, ZO-1, and DAPI, then segmented into 3 equal-length regions, and caveolin-1 staining intensity was quantified for each subcellular region for 79 cells from n = 4 biological replicates. Graph displays mean ± SD with data analyzed by 1-way ANOVA and post hoc Tukey’s multiple-comparison test. Scale bar: 20 μm. (C) Representative generalized polarization (GP) color-coded image to determine membrane fluidity. Higher GP was observed at the downstream end (yellow arrow) compared with the upstream end (blue arrow). Scale bar: 20 μm. (D) Staining of live cells with BODIPY FL C5-Ganglioside GM1 showed polarized accumulation of signal at the downstream end (arrows). Scale bar: 20 μm. (E) Fixed cells showed higher density of F-actin staining at downstream ends (arrows). Scale bar: 20 μm. (F) Imaging of F-actin, caveolin-1, ZO-1, and nuclei highlights presence of caveolin-1 and F-actin at the downstream end, and formation of F-actin web-like features (arrows). Scale bars: 10 μm. (G) 3D surface rendering of the downstream end of a cell showed high density of caveolin-1 where F-actin accumulates. Scale bars: 1 μm. (H) Representative image of caveolin-1, ZO-1, and nuclear staining used for caveolin-1 cluster analysis. Cluster index was determined in subcellular segments and plotted as means ± SD for n = 4 biological replicates. Data were analyzed by 1-way ANOVA and post hoc Tukey’s multiple-comparison test. Scale bar: 10 μm. ****P < 0.0001.
Figure 2
Figure 2. eNOS phosphorylation and Ca2+ oscillations occur at the downstream end in the presence of high laminar flow.
(AC) Confluent monolayers of HAECs were exposed to laminar shear stress (20 dynes/cm2) for 48 hours. (A) Representative image of flow-aligned HAECs stained for caveolin-1 and eNOS phosphorylated on serine 1177 (p-eNOS). Individual channel images, displayed in rainbow lookup table, highlight the accumulation of signal for both caveolin-1 and p-eNOS at the downstream end (arrowheads). Scale bars: 20 μm. (B) Imaging of Ca2+ activity in live HAECs expressing GCaMP. Fluorescence intensity over time is plotted for 15 minutes for 1 full-length cell using 3 defined regions of interest. Note that Ca2+ oscillations are observed exclusively at the downstream end; blue arrow indicates one Ca2+ peak. Corresponding time sequence is displayed for indicated time points. (C) All cells within an imaging field of view were outlined and assigned ID numbers. GCaMP signal was extracted over 30 minutes for n = 6 independent experiments and analyzed for Ca2+ activity. Approximately 50% of cells had Ca2+ activity (index of dispersion [IoD] greater than 2). From 730 cells (n = 3 independent experiments), active cells were further segmented into 3 equal-length segments for the upstream, mid-body, and downstream regions. Of the active cells, over 70% had Ca2+ activity restricted to the downstream end.
Figure 3
Figure 3. Ca2+ activity at the downstream end is enhanced with increased shear stress.
(A) To model variation in flow, GCaMP HAECs were seeded on Y-shaped slides and exposed to unidirectional laminar flow for 48 hours before imaging. Ca2+ activity was imaged in low-flow (~5 dynes/cm2) and high-flow regions (~20 dynes/cm2). Cell segmentation and extraction of the fluorescence intensity over time showed enhanced activity at the downstream end of cells in the high-flow region. IoD plots show data from 177 low-flow and 98 high-flow cells across n = 3 biological replicates. Scale bars: 20 μm. (B) Region of flow convergence on the Y-shaped slide experiences increasing shear stress levels. Cells exposed to high flow were morphologically aligned and exhibited more Ca2+ spikes (in yellow) compared with cells in the low-flow area (marked by red outline). Scale bar: 200 μm. (C) Representative GCaMP intensity trace showing 90 minutes of Ca2+ activity at the downstream end of flow-aligned HAECs in the presence of flow (30 minutes; 20 dynes/cm2), static (30 minutes; 0 dynes/cm2), and re-flow (30 minutes; 20 dynes/cm2) conditions.
Figure 4
Figure 4. High laminar flow is required for localized signaling activity.
(A) HAECs were either seeded on non-patterned chambers and flow-aligned (20 dynes/cm2) or seeded on line-patterned chambers and cultured statically. After 48 hours, cells were analyzed and aspect ratio calculated for n = 4 biological replicates. Shown are means ± SD; NS, not significant by 2-tailed, unpaired t test. Scale bars: 20 μm. (B and C) HAECs were elongated statically on the line-patterned chamber and stained for caveolin-1, p-eNOS, and DAPI. Representative images of the staining are shown in B, with segmentation analysis from 26 cells shown in C. Graphs show intensity displayed as means ± SD and analyzed by 1-way ANOVA with post hoc Tukey’s multiple-comparison test. *P < 0.05, **P < 0.01. Scale bars: 20 μm. (D) Ca2+ activity was recorded for GCaMP-expressing HAECs that were cultured statically on line-patterned chambers. Representative live cell recording of intensity trace for 1 cell over 10 minutes showed a lack of localized activity. Scale bar: 20 μm. (E) HAECs were cultured statically on the line-patterned chamber or Y-shaped slide for 48 hours. Representative images of p-eNOS staining using equivalent imaging conditions to compare the signal intensity across conditions. The p-eNOS signal is displayed using false-color rainbow lookup table to highlight the clustered regions of staining in cells under high flow. Scale bars: 20 μm.
Figure 5
Figure 5. Localized Ca2+ entry requires TRPV4 channel activity and occurs in areas of TRPV4/caveolin-1 association.
(A and B) Confluent monolayers of GCaMP-transfected HAECs were exposed to laminar shear stress (20 dynes/cm2) for 48 hours before live cell imaging. (A) Representative GCaMP intensity trace showing Ca2+ activity at the downstream end after the addition of EGTA (1.6 μM) to chelate calcium ions in culture medium. (B) Representative GCaMP intensity trace showing Ca2+ activity at the downstream end after the addition of the TRPV4 antagonist GSK205 (20 μM). (C and D) HAECs were seeded on Y-shaped slides and exposed to unidirectional laminar flow for 48 hours. Immunofluorescence was compared for cells in low-flow (~5 dynes/cm2) and high-flow regions (~20 dynes/cm2). (C) TRPV4 protein staining showed no difference for low-flow versus high-flow regions. Representative images from n = 3 biological replicates; statistics calculated by 2-tailed, unpaired t test show no significance (NS) of difference between regions. Quantifying the subcellular distribution of expression indicated that TRPV4 was not polarized under flow. Shown are means ± SD from 44 low-flow and 57 high-flow cells across 4 biological replicates. Scale bars: 20 μm. (D) Representative images of proximity ligation assay (PLA) to detect TRPV4 and caveolin-1 association (magenta puncta) in low-flow and high-flow regions for n = 4 replicates. Shown are puncta per cell with means ± SD and statistics calculated using unpaired, 2-tailed t test. ***P < 0.001. Additional segmentation analysis showed that TRPV4/caveolin-1 PLA puncta preferentially occurred in the downstream end only for cells exposed to high flow. Thirty-eight cells were analyzed for the low-flow region and 93 cells for the high-flow region from n = 4 biological replicates. Data were analyzed by 1-way ANOVA and post hoc Tukey’s multiple-comparison test. *P < 0.05, ***P < 0.001. Scale bars: 10 μm.
Figure 6
Figure 6. Cholesterol depletion abolishes polarized signaling.
(A) Experimental design for cholesterol depletion of HAECs. MβCD was used to deplete plasma membrane cholesterol. (B) Flow-aligned HAECs were treated with MβCD for 30 minutes, then fixed and stained for caveolin-1 and DAPI. MβCD treatment abolished caveolin-1 polarization as shown by intensity plots of representative cells from the control and MβCD-treated groups. Scale bars: 20 μm. (C) NO production was visualized via DAF-FM–loaded flow-aligned monolayers of control and MβCD-treated HAECs. Shown are mean DAF-FM fluorescence intensities ± SD for n = 3 biological replicates and statistics calculated using 2-tailed, unpaired t test. **P < 0.01. Scale bars: 50 μm. (D) GCaMP imaging of the cholesterol-depleted cells under flow (20 dynes/cm2) for 20 minutes showed lack of Ca2+ activity. Displayed are time-dependent images of a representative cell and the corresponding intensity trace for the downstream end. At t = 20 minutes (blue arrow), the TRPV4 agonist GSK1016709A (GSK101; 10 nM) was added to the flowing culture medium. This led to an immediate Ca2+ burst as seen in the image at 20.1 minutes. (E) Overall, only 13% of the cells depleted for cholesterol were active in the initial 20 minutes of imaging. The number of active cells increased to 75% following the addition of GSK101. (F) IoD heatmaps show Ca2+ activity following cholesterol depletion and subsequent GSK101 addition for n = 244 cells.
Figure 7
Figure 7. Inhibition of TRPV4 activity under flow induces inflammatory gene expression and NF-κB signaling.
(A) HAEC monolayers were flow-aligned for 48 hours followed by the addition of DMSO (control) or TRPV4 antagonist GSK205 (20 μM) in the presence of laminar flow (20 dynes/cm2). (B) Principal component analysis (PCA) plot of samples based on RNA sequencing analysis. RNA from n = 3 replicates per condition. (C) Heatmap displays top 76 significantly expressed genes between GSK205- and DMSO-treated HAECs. (D) Bar plot of gene expression shows an increase in inflammatory gene expression for GSK205-treated HAECs. Statistics calculated using 2-tailed, unpaired t test. *P < 0.05, **P < 0.01, ***P < 0.001, ***P < 0.0001. (E) Bar plot of the top putative upstream regulators in response to GSK205 treatment as identified by Ingenuity Pathway Analysis (IPA) of the RNA sequencing data. (F) Control and GSK205-treated monolayers were fixed after 2 hours and stained for ZO-1 and the p65 subunit of NF-κB. Nuclear expression of NF-κB p65 was quantified by mean fluorescence intensity. Shown is mean intensity from n = 117 (DMSO) and n = 115 (GSK205) cells analyzed from n = 5 biological replicates and statistics calculated using 2-tailed, unpaired t test. **P < 0.01. Scale bars: 20 μm.
Figure 8
Figure 8. Inhibition of TRPV4 activity induces an inflammatory phenotype.
(A) Control and GSK205-treated HAECs were fixed after 4 hours and stained for DAPI, ICAM-1, and E-selectin. Shown are representative images and mean intensities ± SD from n = 5 biological replicates and statistics calculated using 2-tailed, unpaired t test. ****P < 0.0001. Scale bars: 50 μm. (B) Quantification of NO production in live cells by DAF-FM imaging after 2 hours of treatment. Shown are representative images and mean intensities ± SD from n = 4 biological replicates and statistics calculated using 2-tailed, unpaired t test. **P = 0.0023. Scale bars: 20 μm. (C) After 2 hours, control and GSK205-treated monolayers were incubated with CellROX probe and imaged to quantify ROS production. Shown are representative images and mean intensities ± SD from n = 6 biological replicates and statistics calculated using 2-tailed, unpaired t test. ****P < 0.0001. Scale bars: 20 μm. (D) Experimental design for in vivo inhibition of TRPV4 activity via i.p. injection of GSK205 (10 mg/kg) or DMSO (volume equivalent) as control. After 4 hours, mice were euthanized and aortae collected for en face imaging. (E) Confocal imaging of abdominal aortae from mice injected with GSK205 or DMSO. Shown are representative images and associated quantification of VCAM-1 and nuclear NF-κB p65 staining intensity. Graphs represent mean intensities ± SD from n = 4 mice and statistics calculated using 2-tailed, unpaired t test. *P < 0.05. Scale bars: 10 μm.
Figure 9
Figure 9. Activation of TRPV4 dampens the endothelial response to an inflammatory stimulus in vitro.
(A) Experimental design for static TNF-α treatment (10 ng/mL; 30 minutes) in the presence of GSK101 (10 nM) or DMSO. (B) Gene expression was measured by qPCR for TNF-α–treated monolayers in the presence of DMSO or GSK101. Gene expression of PECAM1, ITGB1, TRPV4, CCN1, NFKBIA, VCAM1, CCL2, SELE, and TNF plotted as mean ± SD. *P < 0.05, **P < 0.01 by 2-tailed, unpaired t test; n = 3 biological replicates. (C) Gene expression as in B with mRNA expression plotted as a heatmap of mean expression. (D) After TNF-α treatment with or without GSK101, HAECs were fixed and stained for VE-cadherin and NF-κB p65. Graph represents mean fluorescence intensity in the nucleus from n = 110 (DMSO), n = 79 (TNF-α + DMSO), and n = 87 (TNF-α + GSK101) cells per group from n = 4 biological replicates per condition and statistics calculated using 1-way ANOVA with post hoc Tukey’s multiple-comparison test. ***P < 0.001. Scale bars: 10 μm.
Figure 10
Figure 10. Activation of TRPV4 attenuates endothelial response to an inflammatory stimulus in vivo.
(A) Experimental design for in vivo LPS treatment (1.5 mg/kg) in the presence of GSK101 (10 μg/kg) or DMSO in wild-type mice. (B) Gene expression of aortic endothelium quantified by qPCR of mRNA isolated from the descending aorta of mice injected with LPS plus DMSO (n = 3) or LPS plus GSK101 (n = 4). Gene expression plotted as mean ± SD; *P < 0.05 by 2-tailed, unpaired t test. (C) Aortic endothelial gene expression plotted as heatmap for inflammatory genes measured by qPCR in B. (D) En face staining of abdominal aortae from mice injected with LPS plus DMSO or LPS plus GSK101. Shown are representative images and associated quantification of VCAM-1 staining intensity and NF-κB p65 nuclear intensity. Graphs represent mean intensities ± SD from n = 4 mice and statistics calculated using 2-tailed, unpaired t test. *P < 0.05. Scale bars: 10 μm. (E) Graphical model describing how laminar flow supports localized TRPV4 activation by polarized caveolin-1–rich microdomains, which leads to Ca2+ entry, eNOS activation, NO production, and inhibition of NF-κB–mediated transcription. Inhibition of TRPV4 signaling at these domains results in vascular inflammation.

References

    1. Suo J, et al. Hemodynamic shear stresses in mouse aortas: implications for atherogenesis. Arterioscler Thromb Vasc Biol. 2007;27(2):346–351. doi: 10.1161/01.ATV.0000253492.45717.46. - DOI - PubMed
    1. Hahn C, Schwartz MA. Mechanotransduction in vascular physiology and atherogenesis. Nat Rev Mol Cell Biol. 2009;10(1):53–62. doi: 10.1038/nrm2596. - DOI - PMC - PubMed
    1. Heo KS, et al. Shear stress and atherosclerosis. Mol Cells. 2014;37(6):435–440. doi: 10.14348/molcells.2014.0078. - DOI - PMC - PubMed
    1. Hikita T, et al. PAR-3 controls endothelial planar polarity and vascular inflammation under laminar flow. EMBO Rep. 2018;19(9):e45253. doi: 10.15252/embr.201745253. - DOI - PMC - PubMed
    1. Tzima E, et al. Localized cdc42 activation, detected using a novel assay, mediates microtubule organizing center positioning in endothelial cells in response to fluid shear stress. J Biol Chem. 2003;278(33):31020–31023. doi: 10.1074/jbc.M301179200. - DOI - PubMed