. 2024 May 21;134(13):e174794.
doi: 10.1172/JCI174794.

BET bromodomain inhibition potentiates radiosensitivity in models of H3K27-altered diffuse midline glioma

Affiliations

BET bromodomain inhibition potentiates radiosensitivity in models of H3K27-altered diffuse midline glioma

Jun Watanabe et al. J Clin Invest. .

Abstract

Diffuse midline glioma (DMG) H3K27-altered is one of the most malignant childhood cancers. Radiation therapy remains the only effective treatment yet provides a 5-year survival rate of only 1%. Several clinical trials have attempted to enhance radiation antitumor activity using radiosensitizing agents, although none have been successful. Given this, there is a critical need for identifying effective therapeutics to enhance radiation sensitivity for the treatment of DMG. Using high-throughput radiosensitivity screening, we identified bromo- and extraterminal domain (BET) protein inhibitors as potent radiosensitizers in DMG cells. Genetic and pharmacologic inhibition of BET bromodomain activity reduced DMG cell proliferation and enhanced radiation-induced DNA damage by inhibiting DNA repair pathways. RNA-Seq and the CUT&RUN (cleavage under targets and release using nuclease) analysis showed that BET bromodomain inhibitors regulated the expression of DNA repair genes mediated by H3K27 acetylation at enhancers. BET bromodomain inhibitors enhanced DMG radiation response in patient-derived xenografts as well as genetically engineered mouse models. Together, our results highlight BET bromodomain inhibitors as potential radiosensitizer and provide a rationale for developing combination therapy with radiation for the treatment of DMG.

Keywords: Brain cancer; Epigenetics; Oncology; Therapeutics; Translation.


Conflict of interest statement

Conflict of interest: The authors have declared that no conflict of interest exists.

Figures

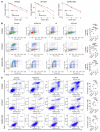
Figure 1
Figure 1. High-throughput drug screening with radiation identified BET bromodomain inhibitors as radiosensitizers in DMG cells.
Tumor cells isolated from GEMM-DMG (Ntv-a; p53fl/fl; PDGFB; H3.3K27M; Cre) mice were cultured ex vivo as neurospheres and used to drug screen for radiosensitizers. (A) Representative image of neurospheres in transmitted light, Hoechst staining (nuclear), PI staining (dead cell), and Hoechst/PI overlay. Evaluation of the number, area, and dead cell intensity of neurospheres. 4x magnification, with each pixel being 3.4156 mm in size, for a raw image of 3.5 mm. Images were subsequently enlarged to enhance visibility. (B) A library of 1,280 FDA-approved drugs and 1,600 clinical candidates was screened in the presence or absence of 10 Gy radiation. Left: Compounds to the right of the diagonal light green line are identified as having an additive effect on neurospheres in the presence 10 Gy radiation Compounds to the right of the dark green diagonal line are identified as those that radiosensitized neurospheres beyond the additive drug effect when combined with 10 Gy radiation (at ≥3σ). Right: Representative images of neurospheres treated with BET bromodomain inhibitor (BRDi) in the presence or absence of 10 Gy radiation. norm., normalized. 4× magnification, with each pixel being 3.4156 mm in size, for a raw image of 3.5 mm. Images were subsequently enlarged to enhance visibility. (C) Radiosensitizing effect (orange) and cytotoxic effect (gray) with methotrexate, AZD5153, temozolomide, and molibresib (I-BET762).
Figure 2
Figure 2. BRD4 depletion suppressed cell growth in DMG cells.
(A) Western blotting results showing sgRNA-mediated depletion of BRD4 expression (sgBRD4-1, -2, -3) in SF8628 and DIPG007 cells. (B) Cell growth plot showing antiproliferative effects of sgBRD4-1, -2, and -3 in SF8628 and DIPG007 cells. The plot represents the absorbance (OD, λ = 490 nm) quantified each day (left). Values shown are the average (mean ± SEM) from triplicate samples for each condition as day 1 normalized. Dot plot representation of OD490 values on day 5 (right). Statistical analysis was performed using 1-way ANOVA comparisons: SF8628, sgBRD4-1, ***P = 0.0001; sgBRD4-2, ***P = 0.0002; sgBRD4-3, ****P < 0.0001; DIPG007, sgBRD4-1, *P = 0.0261; sgBRD4-2, *P = 0.0113; sgBRD4-3, **P = 0.0033. n = 3 (C) Effect of BRD4 depletion in colony formation. Bar graphs: Representation of colony numbers in DMG cells. Values shown are the average (mean ± SEM) from triplicate samples for each condition. One-way ANOVA comparisons between the control and BRD4 depletion groups, ****P < 0.0001; sgBRD4-2, ***P = 0.0004. (D) Effects of BRD4 depletion in BrdU incorporation assay. Cells were pulsed with 10μM BrdU for 1 hour and treated with Alexa Fluor 488–BrdU antibody and 7-aminoactinomycin D (7-AAD). Bar graphs represent BrdU-positive cell numbers. Values shown are the average (mean ± SEM) from duplicate samples for each incubation condition. S-phase cell populations were analyzed with 1-way ANOVA comparisons of each BRD4 sgRNA, ****P < 0.0001; SF8628: sgBRD4-1, **P = 0.0017; sgBRD4-2, **P = 0.0050; sgRNA3 **P = 0.0072; DIPG007: sgBRD4-1, ***P = 0.0001.
Figure 3
Figure 3. BET bromodomain inhibitors suppressed cell growth in DMG cells.
(A) Cell growth plot showing antiproliferative effects of clinical-grade BET bromodomain inhibitors (molibresib, PLX5117, BMS986158, AZD5153, JQ-1) at 0–4 μM in SF8628 cells. Values shown are the average (mean ± SD) from triplicate samples for each incubation condition. (B) Proliferation response of DMG cells (SF8628, DIPG007, SU-DIPG36, SU-DIPG4, GEMM-DMG) and Astro-KM, Astro-WT, and NHA cells to increasing concentration of AZD5153. Values shown are the average (mean ± SEM) from triplicate samples for each incubation condition. (C) Cell growth plot showing proliferation response to IC50 values of AZD5153 of SF8628, DIPG007, SU-DIPG36, SU-DIPG4, and GEMM-DMG cells at each time point. The plot represents an OD value at 490 nm. Values shown are the average (mean ± SEM) from triplicate samples for each condition. Dot plot representation of OD490 values on day 5. Statistical analysis was performed using a 2-tailed unpaired t test: SF8628, **P = 0.0029; DIPG007, ****P < 0.0001; SU-DIPG36, **P = 0.0034; SU-DIPG4, *P = 0.0040; GEMM-DMG, **P = 0.0025. (D) Colony-forming effect on cells treated with IC50 values of AZD5153. Bar graph representation of colony numbers in the DMG cells treated with DMSO (0.5%) or IC50 values of AZD5153. Values shown are the average (mean ± SEM) from triplicate samples for each condition. Unpaired t test values for comparisons between the absence and presence of AZD5153 (n = 3): SF8628, ****P < 0.0001; DIPG007, *P = 0.0109; SU-DIPG36, **P = 0.0038; SU-DIPG4, **P = 0.0037; GEMM-DMG, ***P = 0.0002.
Figure 4
Figure 4. BET bromodomain inhibition increased radioresponse and apoptosis in DMG cells.
(A) Clonogenic survival for K27M-mutant DMG cells (SF8628, DIPG007, GEMM-DMG) treated with AZD5153 (50 nM for SF8628 and DIPG007, 10 nM for GEMM-DMG) for 12 hours before being subjected to IR. Survival fractions, shown as mean ± SEM based on averages from triplicate samples, were normalized to plating efficiency. DEF was calculated at 10% survival level. (B) Effects of AZD5153 and IR on cell proliferation in BrdU incorporation assay. Cells were treated with 500 nM AZD5153 in the presence or absence of 4 Gy IR for 48 hours, pulsed with 10 μM BrdU for 1 hour, then analyzed by flow cytometry. Left: Cell sorting scatter plots for vehicle control– (0.5% DMSO), AZD5153-, and IR-treated cells are shown. Right: Graphs show S-phase composition. One-way ANOVA comparisons between each treatment (n = 3), ****P < 0.0001; control vs. AZD5153: ***P = 0.0005 (SF8628), **P = 0.0065 (GEMM-DMG); AZD5153 vs. AZD5153 + IR: **P = 0.0020 (SF8628), ***P = 0.0002 (GEMM-DMG); control vs. IR: *P = 0.0177 (SF8628), IR vs. AZD5153 + IR: *P = 0.0147 (DIPG007). (C) Annexin V analysis of AZD5153 apoptosis effects. Cells were treated with vehicle control (0.05% DMSO) or 1 μM AZD5153 concurrently with and without 6 Gy IR. Cells were collected after 48 hours and treated with Alexa Fluor 488–Annexin V and flow sorted. Bar graphs represent Annexin V–positive cell numbers. One-way ANOVA comparisons of each treatment (n = 3), ****P < 0.0001; control vs. AZD5153: *P = 0.0115 (SF8628), **P = 0.0076 (DIPG007), **P = 0.0030 (GEMM-DMG); control vs IR: *P = 0.0124 (SF8628), **P = 0.0014 (DIPG007), *P = 0.0245 (GEMM-DMG); AZD5153 vs. AZD5153 + IR: **P = 0.0027 (SF8628), ***P = 0.0029 (DIPG007), *P = 0.0177 (GEMM-DMG); IR vs. AZD5153 + IR: **P = 0.0027 (SF8628), **P = 0.0029 (DIPG007), **P= 0.0022 (GEMM-DMG).
Figure 5
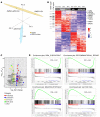
Figure 5. BET bromodomain inhibition altered gene expression in DMG cells.
(A) Principal component analysis (PCA) of RNA-Seq in SF8628 DMG cells treated with 1 μM AZD5153 and 0.5% DMSO (triplicates each time point), or 300 nM JQ1 and 0.5% DMSO (duplicates each time point), for 24 and 48 hours. (B) Heatmap generated from RNA-Seq data, showing differentially expressed genes (P adj < 0.05) in SF8628 DMG cells treated with 1 μM AZD5153 and 0.5% DMSO (triplicates each time point), or 300 nM JQ1 and 0.5% DMSO (duplicates each time point), for 24 and 48 hours. Horizontal black bars to the left indicate genes involved in DNA repair and cell cycle pathways. (C) Volcano plot of SF8628 DMG cells treated with 1 μM AZD5153. AZD5153-treated samples are shown as dots colored according to associated pathways (x axis: log2 fold change; y axis: –log10 Padj values). (D) GSEA pathway analysis in AZD5153-treated SF8628 DMG cells. Significantly downregulated (FDR < 0.001, upper panels) and upregulated (macroautophagy: FDR < 0.001, glycolysis: FDR = 0.021, lower panels) pathways.
Figure 6
Figure 6. BET bromodomain inhibition altered gene sets in biological pathways in DMG cells.
(A) GO enrichment analysis of top 20 downregulated pathways (upper panel) and upregulated pathways (lower panel) in SF8628 DMG cells treated with 1 μM AZD5153. proc., process; Reg., regulator. (B) Violin plots to compare the expression of the 4 gene signatures across conditions (upper left: cell cycle; upper right: DNA repair; lower left: autophagy, lower right: catabolism). Unpaired t test values for comparisons, each treatment, ****P < 0.0001; autophagy: ***P = 0.00025 for 24 hours, ***P = 0.00015 for 48 hours; catabolism: ***P = 0.00057 for 24 hours, ***P = 0.00032 for 48 hours.
Figure 7
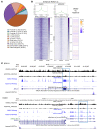
Figure 7. BET bromodomain inhibition altered genome-wide H3K37ac occupancy and transcription in DMG cells.
CUT&RUN was performed using H3K27ac antibody in SF8628 DMG cells treated with 1 μM AZD5153 or 0.5% DMSO for 48 hours. (A) Pie chart showing the distribution of H3K27ac across the DMG genome. (B) Heatmaps showing H3K27ac occupancy with DMSO versus AZD5153 treatment. Metaplots above indicate corresponding H3K27ac occupancy. Each plot is centered on the summit of the average occupancy and extended 5 kb upstream and downstream (–5 kb and +5 kb, respectively). Corresponding gene expression at the H3K27ac binding sites generated from RNA-Seq are shown to the right. (C) Gene annotation tracks showing H3K27ac occupancy and gene expression for the BRCA1 and RAD51 loci. The enhancer region is highlighted with a square for each gene.
Figure 8
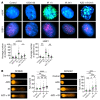
Figure 8. BET bromodomain inhibition enhanced radiation-induced DNA damage in DMG cells.
(A) Effect of AZD5153 (1 μM) on formation of γH2AX and 53BP1 foci in 6 Gy–irradiated SF8628 DMG cells. Top: Representative images of nuclei from each treatment showing γH2AX and 53BP1 foci. Original magnification ×400. Bottom: Graph showing average number of γH2AX and 53BP1 foci/nucleus. Values shown are the average (mean ± SEM) from triplicate samples. One-way ANOVA comparisons between treatments: γH2AX, *P = 0.0368, IR vs. AZD5153 + IR at 24 hours; 53BP1: **P = 0.0043, IR vs. AZD5153 + IR at 24 hours. (B) Representative images of alkaline comet assay in SF8628 and DIPG007 DMG cells treated with AZD5153 followed by IR. Right: Bar graph showing value (mean ± SEM) from triplicate samples for each treatment for DNA damage grade sore in 50 cells. One-way ANOVA comparisons between treatments, ****P < 0.0001; SF8628: control vs. IR, **P = 0.0010; AZD5153 vs. IR, **P = 0.0012; IR vs. AZD5153 + IR, **P = 0.0095; DIPG007: control vs. IR, **P = 0.0069; control vs. AZD5153 + IR, ***P = 0.0002; AZD5153 vs. IR, *P = 0.0117; AZD5153 vs. AZD5153 + IR, ***P = 0.0003; IR vs. AZD5153 + IR, *P = 0.0398.
Figure 9
Figure 9. BET bromodomain inhibition induced DNA damage and suppressed DNA repair in DMG cells.
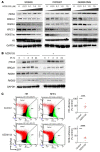
(A) Western blotting showing the effect of AZD5153 (0–10 μM) on expression of DNA repair marker: BRCA1, RAD51, and XRCC1, DNA damage marker: γH2AX, and H3K27ac. (B) Western blot showing effects of AZD5153 (5 μM) on expression change over time after 6 Gy IR in SF8628 DMG cells. (C) DNA repair assay showing effect of AZD5153 (500 μM) on HR and NHEJ pathways in SF8628 DMG cells. Flow plots represent fluorescent signals from HR and NHEJ reporter cassettes. Repair efficiency represents the ratio of GFP+ to DsRed+ cells normalized to 100% of vehicle control (0.5% DMSO). Values (mean ± SEM) shown are based on averages from quadruplicate samples. Unpaired t test values for comparisons between control and AZD5153 samples: ***P = 0.0004 (HR), ****P < 0.0001 (NHEJ).
Figure 10
Figure 10. BET bromodomain inhibition enhanced radiation antitumor activity in DMG PDX models.
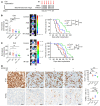
(A) Experimental design for in vivo efficacy study of BET bromodomain (BRD) inhibitor in combination with radiation therapy (RT) in DMG animal models. (B and C) Mice with SF8628 PDXs were randomized to 4 treatment groups: control (DMSO, n = 11), AZD5153 (50 mg/kg) or JQ1 (30 mg/kg) alone (n = 12), RT alone (n = 10 for AZD study, n = 11 for JQ1 study), and AZD5153 + RT (n = 10) or JQ1 + RT (n = 11). Left: Dot plot representation of bioluminescence values on day 53 (AZD study) and day 49 (JQ1 study). 1-way ANOVA comparisons between treatments: AZD study, control vs. AZD5153, *P = 0.0329; control vs. RT, **P = 0.0038; control vs. AZD5153 + RT, **P = 0.0016. JQ1 study, control vs. RT, *P = 0.0128; control vs. JQ1 + RT, **P = 0.0083. Middle: Tumor bioluminescence overlay images. Right: Corresponding survival plots for each treatment. Statistical analysis using a log-rank test, ****P < 0.0001; AZD study: control vs. AZD5153, ***P = 0.0007; control vs. RT, ***P = 0.0002; RT vs. AZD5153 + RT, **P = 0.0072; JQ1 study: control vs. RT, **P = 0.0038; JQ1 vs. JQ1 + RT, ***P = 0.0006; RT vs. JQ1 + RT, *P = 0.0136. (D) Ki-67 and TUNEL staining for intracranial tumor at the end of treatment. Value (mean ± SEM) representing the average of positive cells in 4 high-powered fields in 3 tumor samples (n = 3, right). One-way ANOVA comparisons between treatments: Ki-67, control vs. AZD5153, **P = 0.0042; control vs. RT, **P = 0.0068; control vs. AZD5153 + RT, ***P = 0.0002; RT vs. AZD5153 + RT, *P = 0.0355. TUNEL, control vs. RT, **P = 0.0077; control vs. AZD5153 + RT, ****P < 0.0001; AZD5153 vs. AZD5153 + RT, ***P = 0.0001; RT vs. AZD5153 + RT, **P = 0.0024. Scale bars: 50 μm.
Figure 11
Figure 11. Working model.
(A) High-throughput drug screening. BET bromodomain inhibitors (BRDi) were identified as radiosensitizers using high-throughput drug screening in the DMG cells treated with radiation. BRDi decreased H3K37ac occupancy at enhancer regions, which led to suppressed transcription involving DNA repair in DMG cells. (B) Epigenetic inhibition of DNA repair genes. BRDi disrupts the interaction between acetylated histone (Ac) and BRDs, inhibiting active transcription for the genes involving radiation-induced DNA damage repair, which results in enhancement of the radiation effect in DMG.

References

    1. Louis DN, et al. The 2016 World Health Organization Classification of Tumors of the Central Nervous System: a summary. Acta Neuropathol. 2016;131(6):803–820. doi: 10.1007/s00401-016-1545-1. - DOI - PubMed
    1. Robison NJ, Kieran MW. Diffuse intrinsic pontine glioma: a reassessment. J Neurooncol. 2014;119(1):7–15. doi: 10.1007/s11060-014-1448-8. - DOI - PubMed
    1. Clymer J, Kieran MW. The integration of biology into the treatment of diffuse intrinsic pontine glioma: a review of the north american clinical trial perspective. Front Oncol. 2018;8:169. doi: 10.3389/fonc.2018.00169. - DOI - PMC - PubMed
    1. Coleman C, et al. Interdisciplinary care of children with diffuse midline glioma. Neoplasia. 2023;35:100851. doi: 10.1016/j.neo.2022.100851. - DOI - PMC - PubMed
    1. Kim HJ, Suh C-O. Radiotherapy for diffuse intrinsic pontine glioma: insufficient but indispensable. Brain Tumor Res Treat. 2023;11(2):79–85. doi: 10.14791/btrt.2022.0041. - DOI - PMC - PubMed

MeSH terms