. 2024 May 21;19(5):e0303506.
doi: 10.1371/journal.pone.0303506. eCollection 2024.

Analysis of common differential gene expression in synovial cells of osteoarthritis and rheumatoid arthritis

Affiliations

Analysis of common differential gene expression in synovial cells of osteoarthritis and rheumatoid arthritis

Chang-Sheng Liao et al. PLoS One. .

Abstract

Objective: To elucidate potential molecular mechanisms differentiating osteoarthritis (OA) and rheumatoid arthritis (RA) through a bioinformatics analysis of differentially expressed genes (DEGs) in patient synovial cells, aiming to provide new insights for clinical treatment strategies.

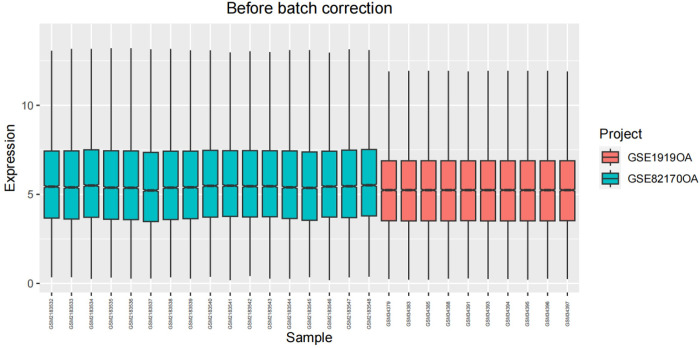
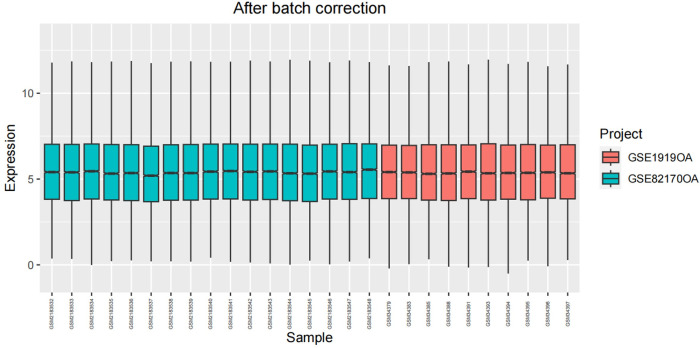
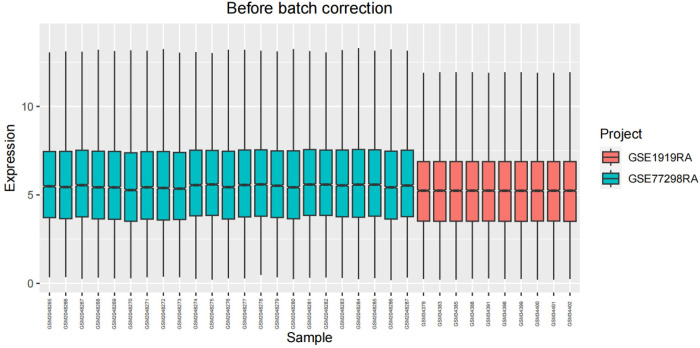
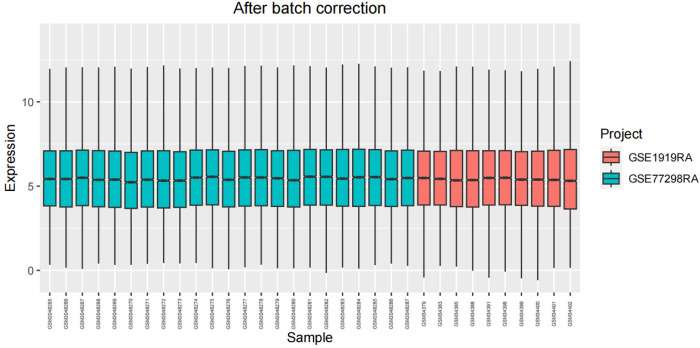
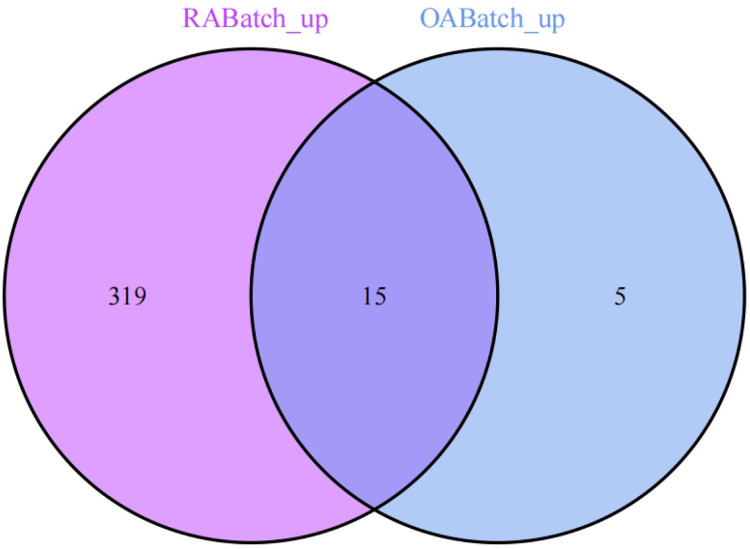
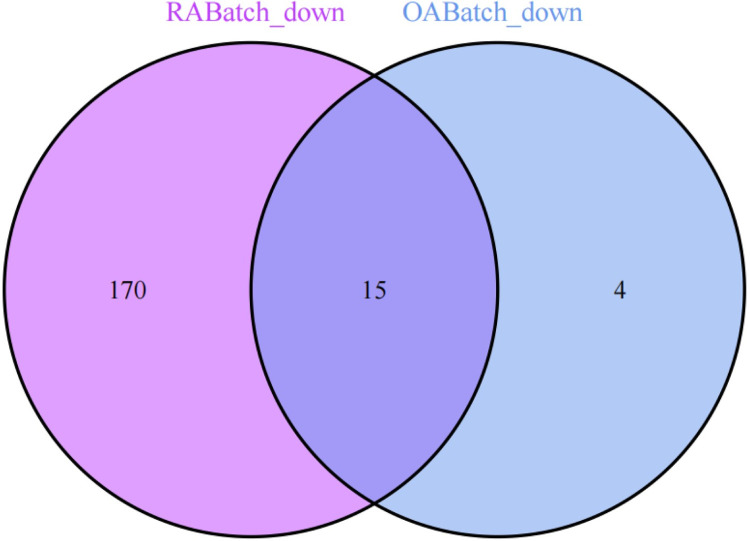
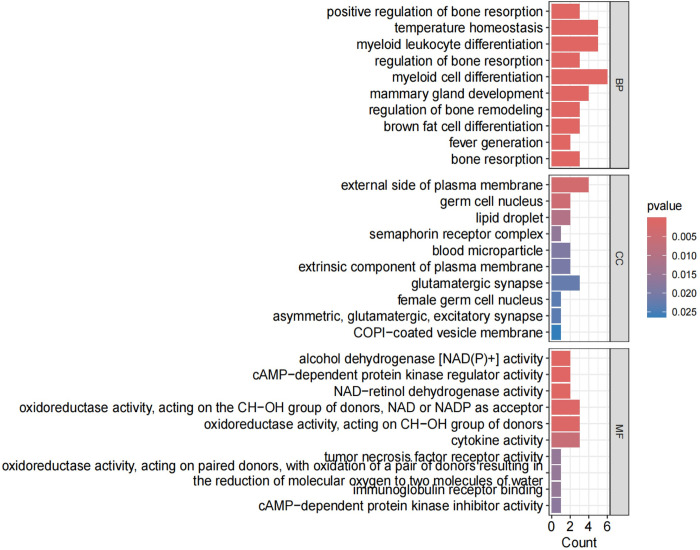
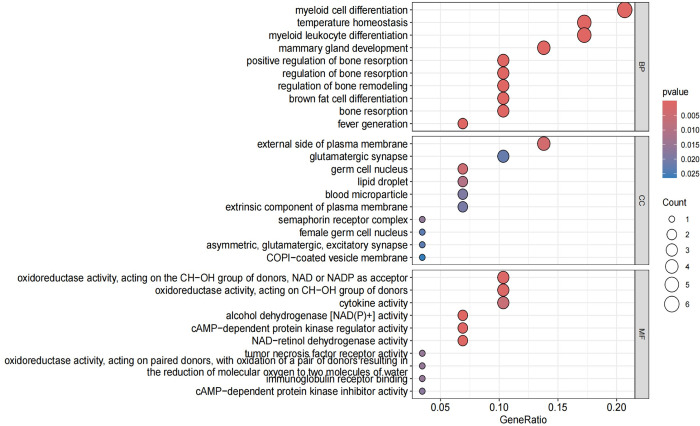
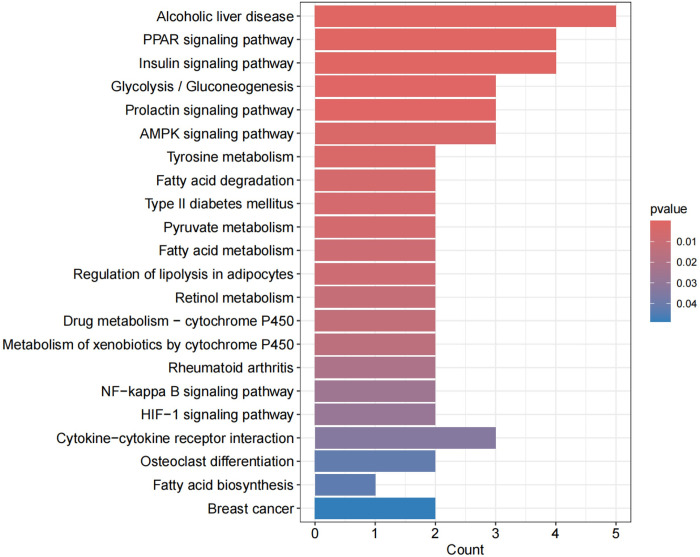
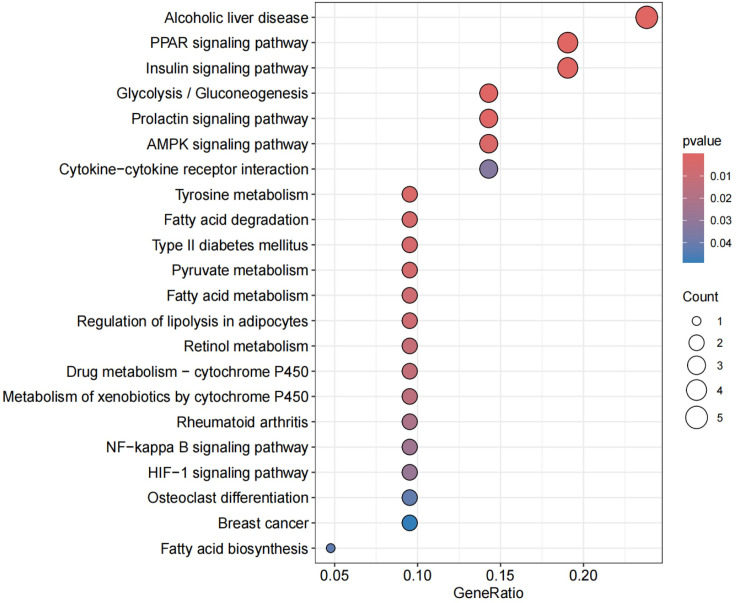
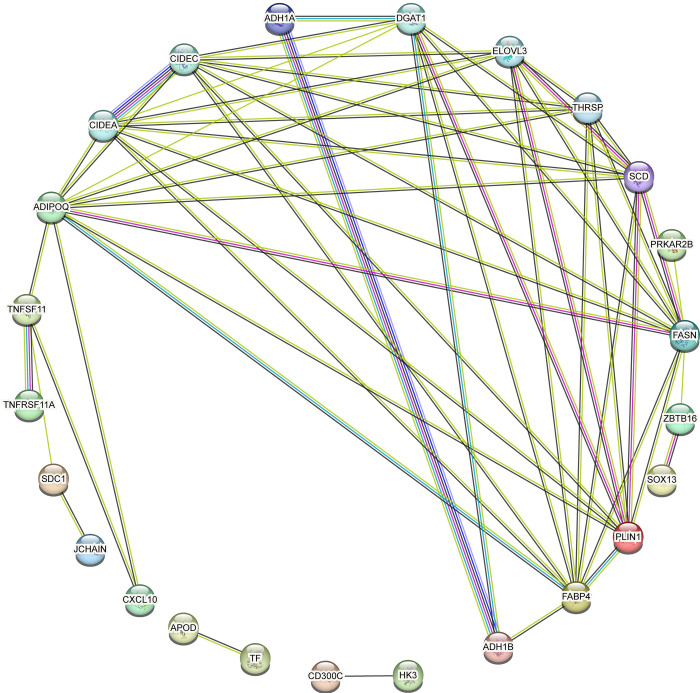
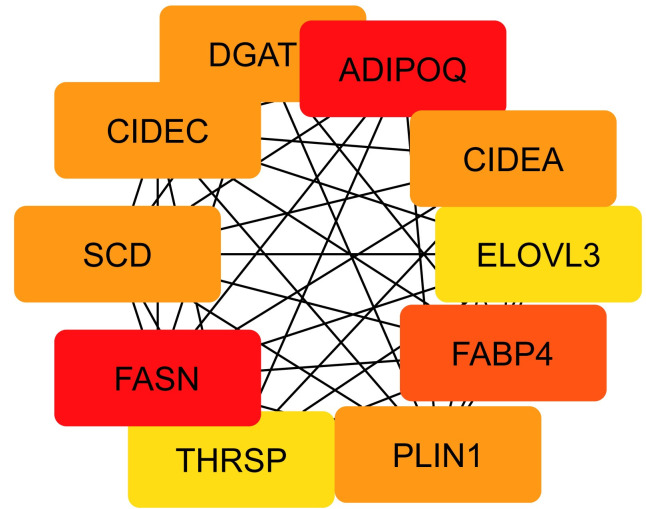
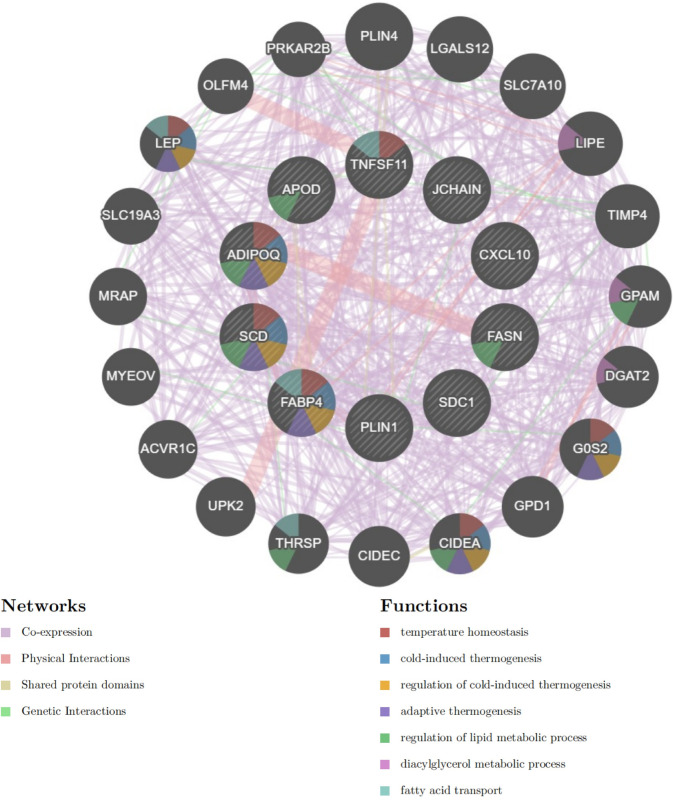
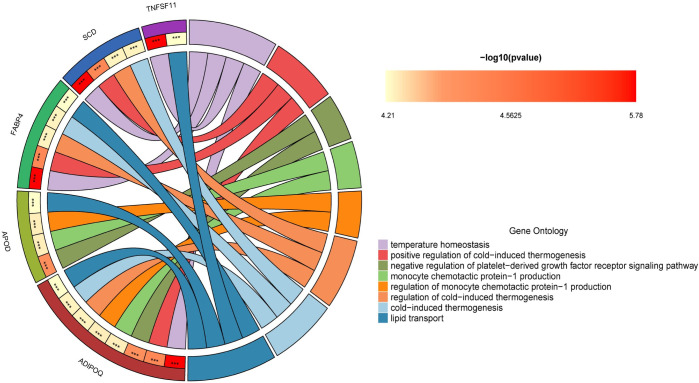
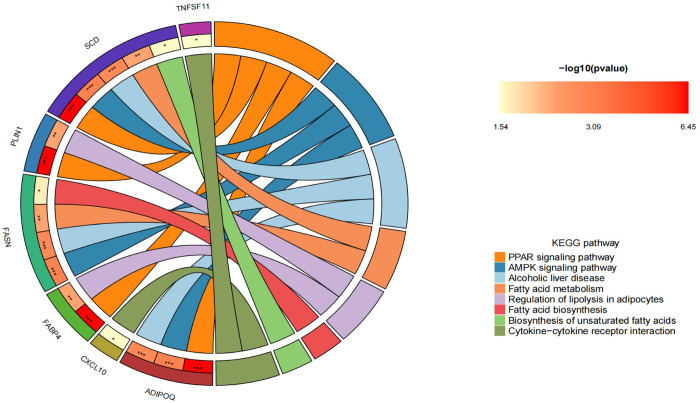
Materials and methods: Gene expression datasets GSE1919, GSE82107, and GSE77298 were downloaded from the Gene Expression Omnibus (GEO) database to serve as the training groups, with GSE55235 being used as the validation dataset. The OA and RA data from the GSE1919 dataset were merged with the standardized data from GSE82107 and GSE77298, followed by batch effect removal to obtain the merged datasets of differential expressed genes (DEGs) for OA and RA. Intersection analysis was conducted on the DEGs between the two conditions to identify commonly upregulated and downregulated DEGs. Enrichment analysis was then performed on these common co-expressed DEGs, and a protein-protein interaction (PPI) network was constructed to identify hub genes. These hub genes were further analyzed using the GENEMANIA online platform and subjected to enrichment analysis. Subsequent validation analysis was conducted using the GSE55235 dataset.

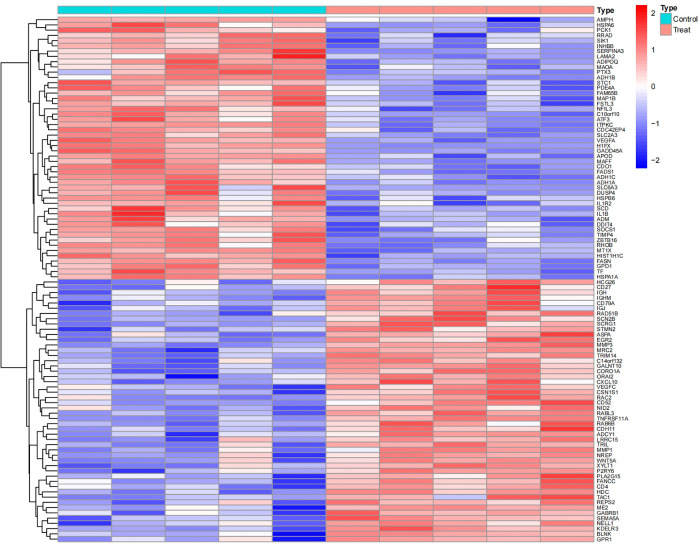
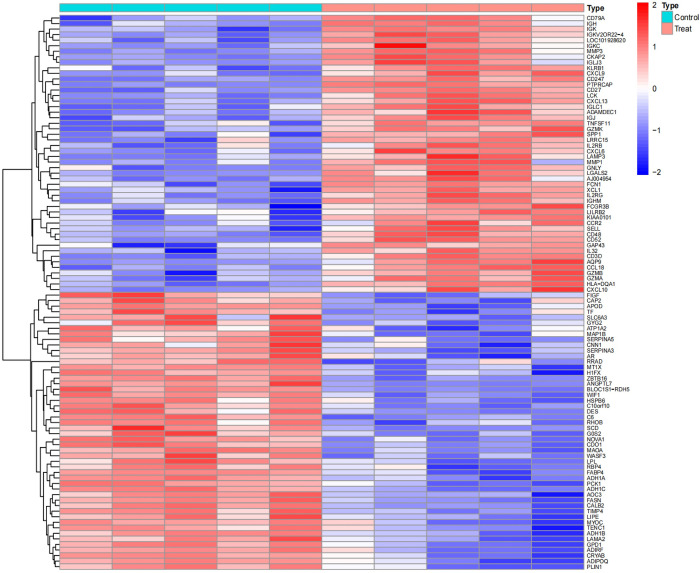
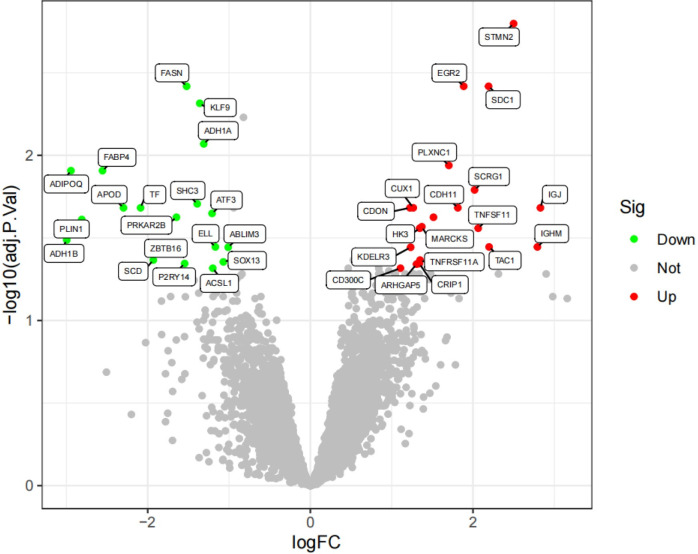
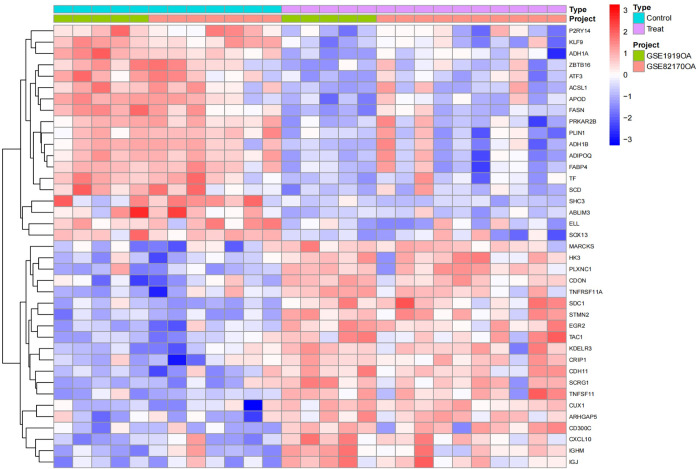
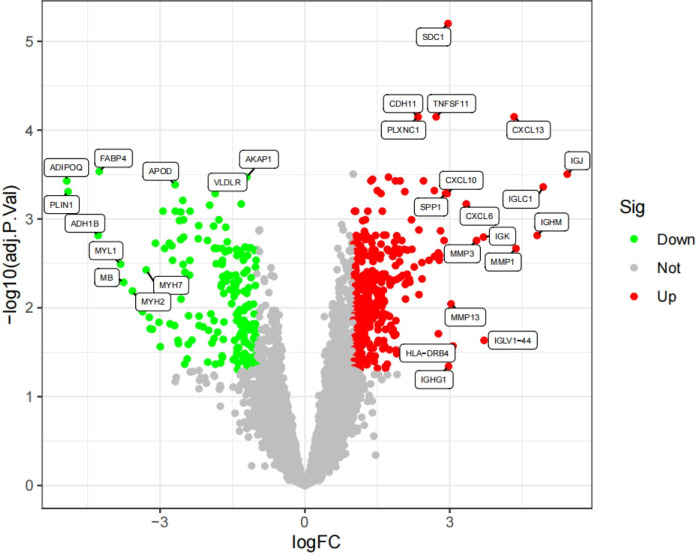
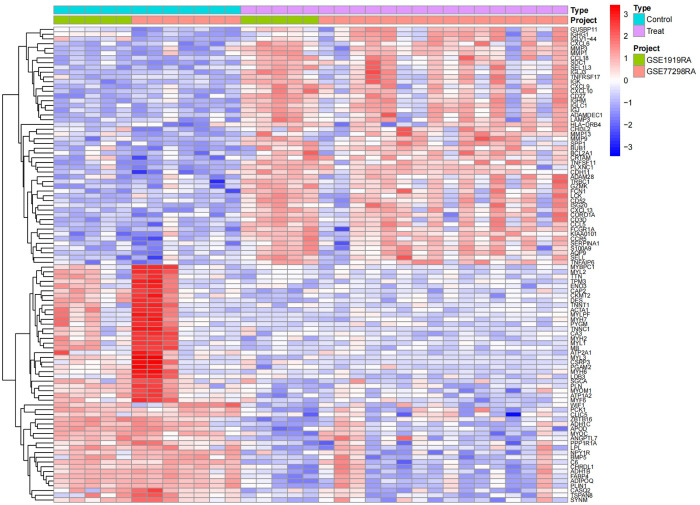
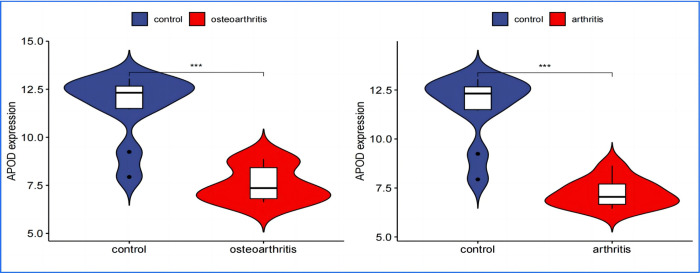
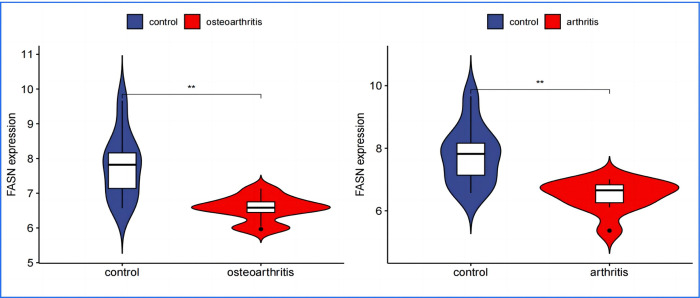
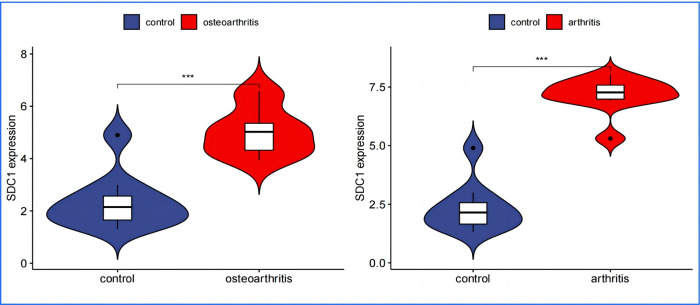
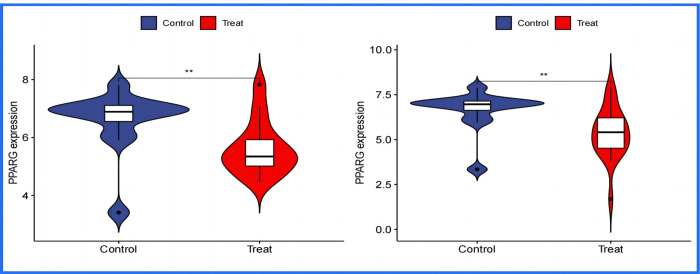
Results: The analysis of differentially expressed genes in the synovial cells from patients with Osteoarthritis (OA) and Rheumatoid Arthritis (RA), compared to a control group (individuals without OA or RA), revealed significant changes in gene expression patterns. Specifically, the genes APOD, FASN, and SCD were observed to have lower expression levels in the synovial cells of both OA and RA patients, indicating downregulation within the pathological context of these diseases. In contrast, the SDC1 gene was found to be upregulated, displaying higher expression levels in the synovial cells of OA and RA patients compared to normal controls.Additionally, a noteworthy observation was the downregulation of the transcription factor PPARG in the synovial cells of patients with OA and RA. The decrease in expression levels of PPARG further validates the alteration in lipid metabolism and inflammatory processes associated with the pathogenesis of OA and RA. These findings underscore the significance of these genes and the transcription factor not only as biomarkers for differential diagnosis between OA and RA but also as potential targets for therapeutic interventions aimed at modulating their expression to counteract disease progression.

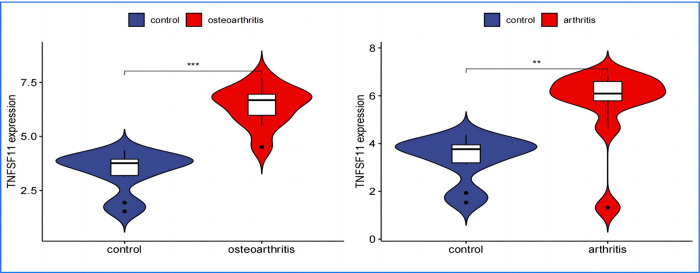
Conclusion: The outcomes of this investigation reveal the existence of potentially shared molecular mechanisms within Osteoarthritis (OA) and Rheumatoid Arthritis (RA). The identification of APOD, FASN, SDC1, TNFSF11 as key target genes, along with their downstream transcription factor PPARG, highlights common potential factors implicated in both diseases. A deeper examination and exploration of these findings could pave the way for new candidate targets and directions in therapeutic research aimed at treating both OA and RA. This study underscores the significance of leveraging bioinformatics approaches to unravel complex disease mechanisms, offering a promising avenue for the development of more effective and targeted treatments.


Conflict of interest statement

The authors have declared that no competing interests exist.

Figures

Fig 1
Fig 1. Displays a heatmap of differentially expressed genes in the GSE1919 OA group.
Fig 2
Fig 2. Shows a heatmap for the GSE1919 RA group.
Fig 3
Fig 3. Illustrates differentially expressed genes in the GSE82107 OA group.
Fig 4
Fig 4. Details the heatmap for the GSE77298 RA group.
In these heatmaps, red indicates upregulated genes, and blue represents downregulated genes. "Control" denotes the normal control group, while "Treat" refers to either the OA or RA group.
Fig 5
Fig 5. Boxplot of the OA group before batch correction.
Fig 6
Fig 6. Boxplot of the OA group after batch correction.
Fig 7
Fig 7. Boxplot of the RA group before batch correction.
Fig 8
Fig 8. Boxplot of the RA group after batch correction.
Fig 9
Fig 9. Volcano plot of the OA group, with green indicating low expression and red indicating high expression.
Fig 10
Fig 10. Volcano plot of the RA group, with green indicating low expression and red indicating high expression.
Fig 11
Fig 11. Heatmap of the OA group, where light blue represents the normal control group, pink represents the disease group, and green and orange differentiate the distinct datasets included, with red signifying high expression and blue representing low expression.
Fig 12
Fig 12. Heatmap of the RA group, where light blue represents the normal control group, pink represents the disease group, and green and orange differentiate the distinct datasets included, with red signifying high expression and blue representing low expression.
Fig 13
Fig 13. Shows 15 upregulated common DEGs identified in both OA and RA.
Fig 14
Fig 14. Displays 15 downregulated common DEGs identified in both OA and RA.
Fig 15
Fig 15. Shows the GO enrichment analysis pathway diagram, where the x-axis represents the number of enriched genes, and the y-axis represents enrichment relevance.
Fig 16
Fig 16. Displays another aspect of the GO enrichment analysis pathway diagram, with the x-axis indicating the gene ratio and the y-axis showing enrichment relevance.
Red color signifies a positive correlation, while blue color indicates a negative correlation.
Fig 17
Fig 17. Exhibits a KEGG enrichment analysis pathway diagram, where the x-axis displays the number of enriched genes, and the y-axis shows enrichment relevance.
Fig 18
Fig 18. Demonstrates a KEGG enrichment analysis pathway diagram, with the x-axis indicating the gene ratio and the y-axis denoting enrichment relevance.
Red represents a positive correlation, while blue signifies a negative correlation. These diagrams and charts provide a visual representation of how the common DEGs between OA and RA participate in various biological processes, cellular components, molecular functions, and specific pathways, indicating potential areas of pathophysiological overlap and therapeutic target opportunities for these two conditions.
Fig 19
Fig 19. This part of the Fig would show the protein-protein interaction (PPI) network generated from the 30 commonly expressed differentially expressed genes (DEGs) identified between Osteoarthritis (OA) and Rheumatoid Arthritis (RA).
In this visualization, each node (circle) represents a protein encoded by one of the DEGs, and lines (edges) between nodes represent known or predicted protein-protein interactions. The layout of the network may be designed to emphasize the complexity of interactions, with densely interconnected nodes clustered towards the center.
Fig 20
Fig 20. Focuses on the module comprising the ten identified hub genes: PLIN1, SDC1, CXCL10, SCD, FABP4, FASN, TNFSF11, JCHAIN, APOD, and ADIPOQ.
In this module, the proximity of the nodes to the network center and their color intensity symbolize the level of connectivity and interaction strength with other proteins in the network. Nodes positioned closely to the center in deeper red shades signify a tighter connectivity and a more central role in the networks structure and function. Conversely, nodes depicted in lighter colors and located towards the periphery indicate relatively less connectivity. This visualization underscores the importance of these hub genes in the network and their potential as critical players in the biological processes common to both OA and RA.
Fig 21
Fig 21. GENEMANIA analysis visualization for commonly expressed DEGs and their involvement in key biological processes.
This part of the Figure visualizes the involvement of the 10 commonly expressed differentially expressed genes (DEGs), either directly or indirectly through their close connections with the top 20 related genes, in several critical biological processes. These processes include temperature homeostasis, cold-induced thermogenesis, regulation of cold-induced thermogenesis, adaptive thermogenesis, regulation of lipid metabolic process, diacylglycerol metabolic process, and fatty acid transport. The visualization is structured to highlight the complex network of interactions that these genes partake in, which underlie their role in these essential physiological and metabolic pathways. In this network diagram:Purple Lines indicate co-expression links, illustrating genes that are commonly regulated or exhibit similar expression patterns across various conditions, suggesting potential functional relationships.Red Lines depict physical interactions, indicating that proteins encoded by these genes directly bind to each other, which plays a crucial role in cellular function and signaling pathways.Green Lines signify genetic interactions, where the genetic perturbation (mutation, deletion, overexpression) of one gene affects the phenotype or expression of another, indicating functional relationships that may be critical for understanding disease mechanisms or potential therapeutic targets.Yellow Lines represent shared protein domains, indicating that these proteins have similar structural features which might be crucial for their biological function, interaction with other proteins, or regulation.This comprehensive visualization provides insights into how the identified hub genes and their closely related genes interact within a complex network to regulate essential biological processes relevant to temperature regulation and lipid metabolism.
Fig 22
Fig 22. GO enrichment analysis circular diagram –this diagram represents the results of the gene ontology (GO) enrichment analysis for the hub genes.
The left half-circle’s outer edge is color-coded to represent different hub genes, while the right half-circle’s outer edge uses different colors to denote various enriched GO pathways. The inner part of the circle uses stars to indicate significance levels of the enrichment: three stars for a p-value < 0.001, indicating highly significant enrichment; two stars for a p-value < 0.01, signifying moderate significance; and one star for a p-value < 0.05, marking general significance in the enrichment analysis.
Fig 23
Fig 23. KEGG enrichment analysis circular diagram –similarly, this diagram displays the kyoto encyclopedia of genes and genomes (KEGG) pathway enrichment analysis results for the hub genes.
The left half-circle’s outer edge is color-coded to signify different hub genes while the right half-circle’s outer edge uses various colors to represent different enriched KEGG pathways. The significance of the enrichment is denoted by stars in the inner circle, using the same convention as in the GO analysis diagram: three stars for p-value < 0.001, two stars for p-value < 0.01, and one star for p-value < 0.05.
Fig 24
Fig 24. APOD Expression in OA and RA–illustrates significantly lower expression levels of APOD in both OA and RA disease groups compared to the normal controls, highlighting its potential role in the pathogenesis of these conditions.
Fig 25
Fig 25. FASN Expression in OA and RA–shows that FASN is also significantly downregulated in the disease groups for OA and RA, suggesting its decreased activity might influence disease mechanisms or progression.
Fig 26
Fig 26. SDC1 Expression in OA and RA–depicts SDC1 as being significantly upregulated in both OA and RA groups, indicating its heightened activity in the disease context and potential involvement in disease processes.
Fig 27
Fig 27. TNFSF11 Expression in OA and RA–exhibits higher expression levels of TNFSF11 in OA and RA, pointing to its possible contribution to disease pathology or inflammation.
Fig 28
Fig 28. Differential expression of transcription factor PPARG in OA and RA groups compared to normal control.
Illustrate that the expression of the transcription factor PPARG in both the Osteoarthritis (OA) and Rheumatoid Arthritis (RA) groups is significantly lower than that observed in the normal control group. The horizontal axis uses blue to represent the normal control group, and red to denote the experimental groups (either OA or RA). The vertical axis measures the expression levels of the transcription factor.

Similar articles

References

    1. Vina ER, Kwoh CK. Epidemiology of osteoarthritis: literature update. Curr Opin Rheumatol. 2018. Mar;30(2):160–167. doi: 10.1097/BOR.0000000000000479 ; PMCID: PMC5832048. - DOI - PMC - PubMed
    1. Finckh A., Gilbert B., Hodkinson B. et al.. Global epidemiology of rheumatoid arthritis. Nat Rev Rheumatol 18, 591–602 (2022). doi: 10.1038/s41584-022-00827-y - DOI - PubMed
    1. Bliddal H. [Definition, pathology and pathogenesis of osteoarthritis]. Ugeskr Laeger. 2020. Oct 12;182(42):V06200477. Danish. . - PubMed
    1. Jang S, Lee K, Ju JH. Recent Updates of Diagnosis, Pathophysiology, and Treatment on Osteoarthritis of the Knee. Int J Mol Sci. 2021. Mar 5;22(5):2619. doi: 10.3390/ijms22052619 ; PMCID: PMC7961389. - DOI - PMC - PubMed
    1. Roberts NLS, Mountjoy-Venning WC, Anjomshoa M, Banoub JAM, Yasin YJ. GBD 2017 Disease and Injury Incidence and Prevalence Collaborators. Global, regional, and national incidence, prevalence, and years lived with disability for 354 diseases and injuries for 195 countries and territories, 1990–2017: a systematic analysis for the Global Burden of Disease Study (vol 392, pg 1789, 2018) Lancet. 2019;393:E44–E. - PMC - PubMed

MeSH terms