. 2024 Jul 9;57(7):1665-1680.e7.
doi: 10.1016/j.immuni.2024.04.022. Epub 2024 May 20.

Metabolic coordination between skin epithelium and type 17 immunity sustains chronic skin inflammation

Affiliations

Metabolic coordination between skin epithelium and type 17 immunity sustains chronic skin inflammation

Ipsita Subudhi et al. Immunity. .

Abstract

Inflammatory epithelial diseases are spurred by the concomitant dysregulation of immune and epithelial cells. How these two dysregulated cellular compartments simultaneously sustain their heightened metabolic demands is unclear. Single-cell and spatial transcriptomics (ST), along with immunofluorescence, revealed that hypoxia-inducible factor 1α (HIF1α), downstream of IL-17 signaling, drove psoriatic epithelial remodeling. Blocking HIF1α in human psoriatic lesions ex vivo impaired glycolysis and phenocopied anti-IL-17 therapy. In a murine model of skin inflammation, epidermal-specific loss of HIF1α or its target gene, glucose transporter 1, ameliorated epidermal, immune, vascular, and neuronal pathology. Mechanistically, glycolysis autonomously fueled epithelial pathology and enhanced lactate production, which augmented the γδ T17 cell response. RORγt-driven genetic deletion or pharmacological inhibition of either lactate-producing enzymes or lactate transporters attenuated epithelial pathology and IL-17A expression in vivo. Our findings identify a metabolic hierarchy between epithelial and immune compartments and the consequent coordination of metabolic processes that sustain inflammatory disease.

Keywords: HIF1α; epithelium; glycolysis; inflammation; lactate; metabolism; skin; type 17 cells.


Conflict of interest statement

Declaration of interests I. Subudhi, P.K., and S.N. have filed a provisional patent for HIF1α inhibition in inflammatory skin diseases (U.S. serial number 63/540,794, filed September 27, 2023). N.A. is a consultant for Immunitas, 23 and me, Cellino Pharmaceuticals, and Janssen and serves on the SAB of Shennon Bio. S.N. is on the SAB of Seed Inc., is a consultant for BiomX, and receives funding from Takeda Pharmaceuticals. This activity is not relevant to the content of this manuscript.

Figures
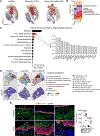
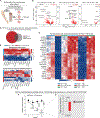
Figure 1.
Figure 1.. HIF1α demarcates a dysfunctional epithelial state in human inflammatory skin disease.
(A) UMAP visualization of single-cell RNA-seq data from skin samples (Healthy, n = 53844 cells; Psoriasis (PsO), n = 51093 cells; Atopic dermatitis (AD), n = 32017 cells). (B) Bar charts showing proportions of epithelial cell states in healthy, PsO, and AD skin. (C) Left, Kyoto Encyclopedia of Genes and Genomes (KEGG) pathway analyses of differentially expressed genes in differentiated cluster 2 that is uniquely enriched in inflammation. Right, genes with increased expression are shown for specific pathways of interest. (D) Representative spatial transcriptomics (ST) plots of healthy, PsO lesional, and PsO non-lesional skin with corresponding cluster annotation and feature plots of HIF1A. (E) Epidermal nuclear HIF1α (green) is expressed in PsO lesional skin compared to healthy skin; HIF1α is predominantly expressed in suprabasal epidermis. Quantification of HIF1α+ cells per 1 mm2 of either epidermis or dermis (n = 9 patients). Red, keratin (KRT)5; blue, DAPI nuclei. White dashed lines demarcate the dermo-epithelial borders. White arrows point to dermal HIF1α + cells Asterisks denote background signal. Scale bars, 100 μm. See also Figure S1.
Figure 2.
Figure 2.. Concomitant enrichment of Type 17 immunity and epidermal HIF1α in PsO lesions.
(A) Lesional PsO epidermis has higher activation of epithelial Keratin (KRT) 5+ (red) HIF1α+ (green) as compared to non-lesional skin. RORγt+ (magenta) CD3+ (yellow) T cells are also enriched. Blue, DAPI nuclei. (B) Quantification of activated epidermal KRT5+HIF1α+ cells per 100 μm of epidermis from (A) and regression plot of epidermal HIF1α+ cells and epidermal thickness (n = 10 patients). (C) Quantification of RORγt+ CD3+ cells per 100μm of epidermis from (A) (n = 10 patients). (D) Regression plot of epidermal HIF1α+ cells and CD3+ cell counts (n = 10 patients). (E) IL-17Receptor(R)C (red) expression is restricted to suprabasal, differentiated epidermis in PsO non-lesional and lesional tissue. In lesional skin however, IL-17RC expression completely overlaps with HIF1α+ (green) cells. Blue, DAPI nuclei. (F) Quantification of IL-17RC HIF1α+ and IL-17RC+ HIF1α+cells in psoriatic non-lesional (NL) and lesional (L) tissue from (E). In (A) and (E), white dashed lines demarcate the dermo-epithelial borders, and yellow boxes denote magnified areas. In (E), white dotted lines demarcate basal layer (BL) and suprabasal layer (SL) of epidermis. Scale bars in (A), 100 μm; and in (E), 50 μm. Significance was determined via Student’s paired two-tailed t test; plots in (B), (C), and (F) display mean ± SEM, and each data point represents one patient.
Figure 3.
Figure 3.. Epithelial HIF1α expression normalizes in therapy-responsive PsO patients.
(A) Schematic of spatial transcriptomics (ST) study workflow. (B) Dot plot of gene expression in lesional (L) and non-lesional (NL) PsO samples pre- and post-treatment with secukinumab, depicting the frequency of cells expressing gene (percentage) and scaled expression per cluster (Z score). (C) Following treatment with etanercept (anti-TNFα treatment), post-treated lesional (PT) PsO epidermis has lower expression of nuclear HIF1α (green) as compared to pre-treated lesional skin. Red, KRT5+; Magenta, RORγt+; yellow, CD3+; blue, DAPI nuclei. White dashed lines demarcate the dermo-epithelial borders, and yellow boxes denote magnified areas. Scale bars, 100 μm. (D-F) Quantification of (D) epidermal thickness, (E) CD3+, and (F) activated epidermal HIF1α cells per 100μm of epidermis from (C) (n = 10 patients, N = 1). Significance was determined via Student’s paired two-tailed t test; plots display mean ± SEM, and each data point represents one patient. See also Figure S2 and Tables S1 and S2.
Figure 4.
Figure 4.. Metabolic and epidermal differentiation genes in human PsO lesional skin are affected by ex vivo HIF1α inhibition.
(A) Schematic of ex vivo skin culture and treatment modalities from human PsO lesions. (B) Volcano plots of differentially expressed genes (marked in red) between healthy skin (HS) + HIF1A inhibitor (inh) vs. HS + vehicle treatment (veh); PsO + inh vs. PsO + veh; and PsO + standard of care (SoC) vs. PsO + veh. (C) Number of genes with reduced expression in PsO + HIF1A inh vs PsO + veh and PsO + SoC vs PsO + veh. (D) Top 25 genes with reduced expression in PsO + HIF1A inh as compared to healthy skin (HS) and PsO skin treatment with veh, HIF1A inh, or SoC. (E) Heatmap of selected genes relating to metabolism/glycolysis and epidermal development/differentiation that are inhibited in PsO + HIF1A inh as compared to PsO + veh. (F) Estimated marginal means for the GSVA scores of gene signatures that were inhibited in PsO + HIF1A inh (vs PsO + veh) at baseline and after 1, 4, and 12 weeks of anti-IL17 (Secukinumab) therapy or placebo. (G) Secukinumab-induced changes in gene signatures that were inhibited in PsO + HIF1A inh (vs PsO + veh) in responders (R) and non-responders (NR) at 12 weeks. Data points and error bars indicate mean and SEM of the relative enrichment of DEGs; p-values below error bars represent the significance level in the change from baseline within each group at each time point, while p-values at the top indicate that treatment changes over time are significantly different between treatment groups (F) or R vs NR (G). See also Figure S3 and Table S3.
Figure 5.
Figure 5.. Epidermal HIF1α is necessary for multisystem pathology in murine PsO.
(A) Schematic of imiquimod (IMQ) PsO murine model. (B) Expression of epidermal (Keratin (K)14, red) nuclear HIF1α (green) is induced following IMQ treatment. Blue, DAPI nuclei. (C and D) Both I epidermal thickness and (D) K14+HIF1α+ cells increase following IMQ treatment. (E) K14+HIF1α+ cells correlate with epidermal thickness (n ≥ 7, N = 3). (F and G) Epithelial-specific depletion of IL-17RC (Il17rcEKO) leads to decreased (G) epidermal thickness and K14+HIF1α+ cells compared to wild type (WT) following IMQ (n = 8–9, N = 2). (H) Schematic of BAY 87–2243 (HIF1α inhibitor (Inh)) treatment with IMQ PsO model. Following concurrent application of BAY 87–2243 (HIF1α inhibitor, Inh) or vehicle (Veh) with IMQ, there is diminished epidermal thickness (Keratin (K)14, red). HIF1α, green; blue, DAPI nuclei (n ≥ 6, N = 2). (I) Quantification of (I) epidermal thickness and Ki67. (J) Reduction of dermal CD3+ cells (red) following concurrent application of BAY 87–2243 (HIF1α inhibitor, Inh) and IMQ (n=6, N=2). (K) Following three days of IMQ, Hif1aEKO mice have diminished epidermal thickness and proliferation (EdU) compared to controls (WT). White, EdU; red, K14; blue, DAPI nuclei (n = 7, N = 3). (L) Quantification of epidermal thickness and EdU+K14+ cells. (M) Reduction of dermal CD3+ cells in IMQ-treated Hif1aEKO skin as compared to WT (n = 6, N = 3). (N) Following concurrent topical treatment with HIF1α siRNA or scrambled control (ctrl) siRNA with IMQ, there is diminished epidermal thickness. In (B), (F), (H), (J), and (K), white dashed lines demarcate the dermo-epithelial borders. Scale bars in (B), (F), (H), (J), and (K), 100 μm. Significance was determined via Student’s unpaired two-tailed t Test; plots display mean ± SEM. See also Figure S4.
Figure 6.
Figure 6.. Epithelial glycolysis fuels PsO pathology and sustains the Type 17 response.
(A) Volcano plot of differentially expressed genes (marked in red) between WT and Hif1aEKO back skin treated for three days with IMQ (n = 7, N = 3). (B) Heatmap of selected genes relating to metabolic activity, epidermis, and immunity. (C) Following three days of IMQ, Hif1aEKO mice have diminished expression of Glucose transporter 1 (Glut1), depicted by pseudocolor fire images and staining quantifications (n = 7, N = 3). (D) Mice lacking epithelial Glut1 (Slc2a1EKO) have diminished epidermal thickness (Keratin (K)14, red) and proliferation (EdU, white) as compared to WT mice. (E) Reduced expression of CD31+ (red) vasculature in Slc2a1EKO mice treated with IMQ as compared to WT. Blue, DAPI. (F) Reduced innervation (β-tubulin III, green) in Slc2a1EKO mice treated with IMQ as compared to WT. Asterisk denotes background. Blue, DAPI. (G) Slc2a1EKO mice treated with IMQ have decreased dermal CD3+ cells compared to WT (n = 5, N = 2). Blue, DAPI. (H) Decreased proportion of IL-17A+ γδ T cells in skin-draining lymph nodes of Slc2a1EKO mice as compared to WT mice treated with IMQ (n = 4, N = 2). (I) There is a decrease in IL-17A mean fluorescence intensity (MFI) of γδ T cells in skin-draining lymph nodes of Slc2a1EKO mice treated with IMQ, normalized to WT controls for each experiment (n = 4, N = 2). (J) Quantification. In (C), (D), (E), (F), and (G), white dashed lines demarcate the dermo-epithelial borders. Scale bars in (C), (D), (E), (F), and (G), 100 μm. Significance was determined via Student’s unpaired two-tailed t test; plots display mean ± SEM. See also Figure S3, S5, and S6.
Figure 7.
Figure 7.. Lactate promotes γδ T17 cell-mediated inflammation.
(A) Schematic of lactate secretion assessment from ex vivo culture supernatant. Decrease in lactate secretion in IMQ-treated Slc2a1EKO skin as compared to WT skin (n ≥ 3, N = 2). (B) Schematic of LDH-A or MCT1/MCT4 inhibitor treatment in IMQ model, in which inhibitors were topically applied during entire duration of IMQ application. (C-E) Following concurrent topical application of sodium oxamate (LDH-A inh) or MCT1/MCT4 inhibitor (inh) with IMQ, there is diminished epidermal thickness (K14+, green) (quantification in (D)) and dermal CD3+ cells (red, white arrow) (quantification in (E)) as compared to vehicle (veh) controls (n > 6, N = 3). (F) Gene expression of IL17a between mice treated with IMQ and vehicle, LDH-A inh, or MCT1/MCT4 inh starting at day 3 of IMQ inflammation (n > 6, N = 3). (G) Decreased proportion of IL-17A+ γδ T cells in skin-draining lymph nodes of IMQ-treated mice intraperitoneally treated with MCT1/MCT4 inhibitor as compared to veh controls (n ≥ 11, N = 3). (H) CD45rblowCD44+ effector γδ T cells in skin-draining lymph nodes of mice treated with IMQ were sorted and cultured in the presence of CD3 and CD28 in low glucose media, with or without L-lactate for 48h, after which culture supernatant was collected and IL17A was measured via ELISA. There is increased IL-17A following incubation with L-lactate (n=4, N=4). (I-K) Mice lacking LDHA in Rorc-expressing cells (LdhaRorcCre) have diminished epidermal thickness (Keratin (K)14, green) (quantification in (J)) and CD3+ T cells (CD3, red) (quantification in (K)) as compared to WT mice (n>7, N=2). (L) Gene expression of IL17a between WT and LdhaRorcCre mice treated with IMQ (n > 6, N = 2). (M) There is decreased proportion of IL-17A+ producing γδ T cells in skin-draining lymph nodes of LdhaRorcCre mice treated with IMQ as compared to WT mice (n>7, N=2). In (C) and (I), white dashed lines demarcate the dermo-epithelial borders. Scale bars in (D) and (I), 100 μm. Significance was determined via Student’s unpaired two-tailed t test; plots display mean ± SEM. See also Figure S7.

Comment in

References

    1. Griffiths CEM, Armstrong AW, Gudjonsson JE, and Barker J (2021). Psoriasis. Lancet 397, 1301–1315. 10.1016/S0140-6736(20)32549-6. - DOI - PubMed
    1. Guttman-Yassky E, and Krueger JG (2017). Atopic dermatitis and psoriasis: two different immune diseases or one spectrum? Curr Opin Immunol 48, 68–73. 10.1016/j.coi.2017.08.008. - DOI - PubMed
    1. Guenin-Mace L, Konieczny P, and Naik S (2022). Immune-Epithelial Cross Talk in Regeneration and Repair. Annu Rev Immunol. 10.1146/annurev-immunol-101721-062818. - DOI - PMC - PubMed
    1. Ghoreschi K, Balato A, Enerback C, and Sabat R (2021). Therapeutics targeting the IL-23 and IL-17 pathway in psoriasis. Lancet 397, 754–766. 10.1016/S0140-6736(21)00184-7. - DOI - PubMed
    1. Nograles KE, Zaba LC, Guttman-Yassky E, Fuentes-Duculan J, Suarez-Farinas M, Cardinale I, Khatcherian A, Gonzalez J, Pierson KC, White TR, et al. (2008). Th17 cytokines interleukin (IL)-17 and IL-22 modulate distinct inflammatory and keratinocyte-response pathways. Br J Dermatol 159, 1092–1102. 10.1111/j.1365-2133.2008.08769.x. - DOI - PMC - PubMed

Publication types

MeSH terms

Substances