. 2024 Aug 1;30(15):3298-3315.
doi: 10.1158/1078-0432.CCR-23-3110.

Anti-EGFR Antibody-Drug Conjugate Carrying an Inhibitor Targeting CDK Restricts Triple-Negative Breast Cancer Growth

Affiliations

Anti-EGFR Antibody-Drug Conjugate Carrying an Inhibitor Targeting CDK Restricts Triple-Negative Breast Cancer Growth

Anthony Cheung et al. Clin Cancer Res. .

Abstract

Purpose: Anti-EGFR antibodies show limited response in breast cancer, partly due to activation of compensatory pathways. Furthermore, despite the clinical success of cyclin-dependent kinase (CDK) 4/6 inhibitors in hormone receptor-positive tumors, aggressive triple-negative breast cancers (TNBC) are largely resistant due to CDK2/cyclin E expression, whereas free CDK2 inhibitors display normal tissue toxicity, limiting their therapeutic application. A cetuximab-based antibody drug conjugate (ADC) carrying a CDK inhibitor selected based on oncogene dysregulation, alongside patient subgroup stratification, may provide EGFR-targeted delivery.

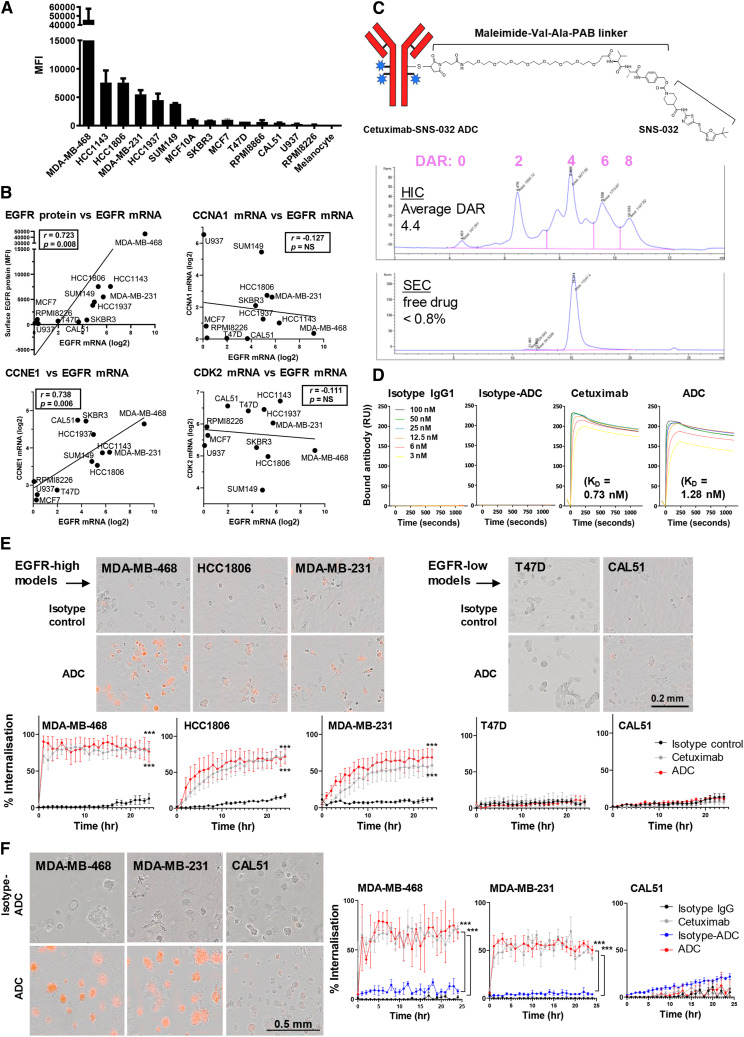
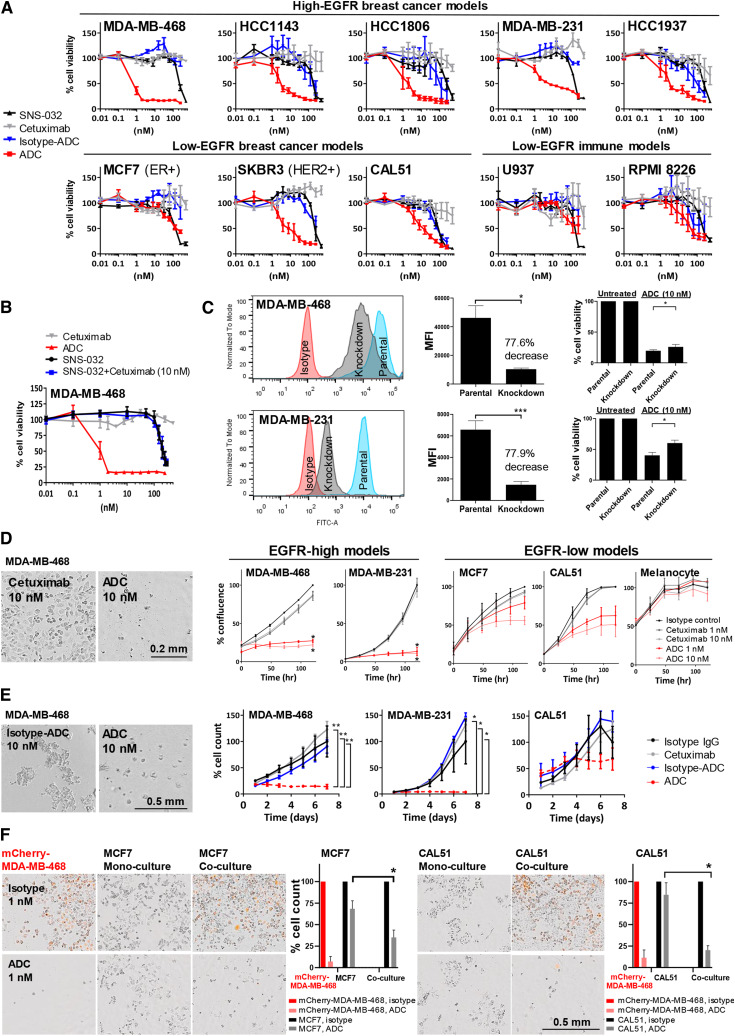
Experimental design: Expressions of G1/S-phase cell cycle regulators were evaluated alongside EGFR in breast cancer. We conjugated cetuximab with CDK inhibitor SNS-032, for specific delivery to EGFR-expressing cells. We assessed ADC internalization and its antitumor functions in vitro and in orthotopically grown basal-like/TNBC xenografts.

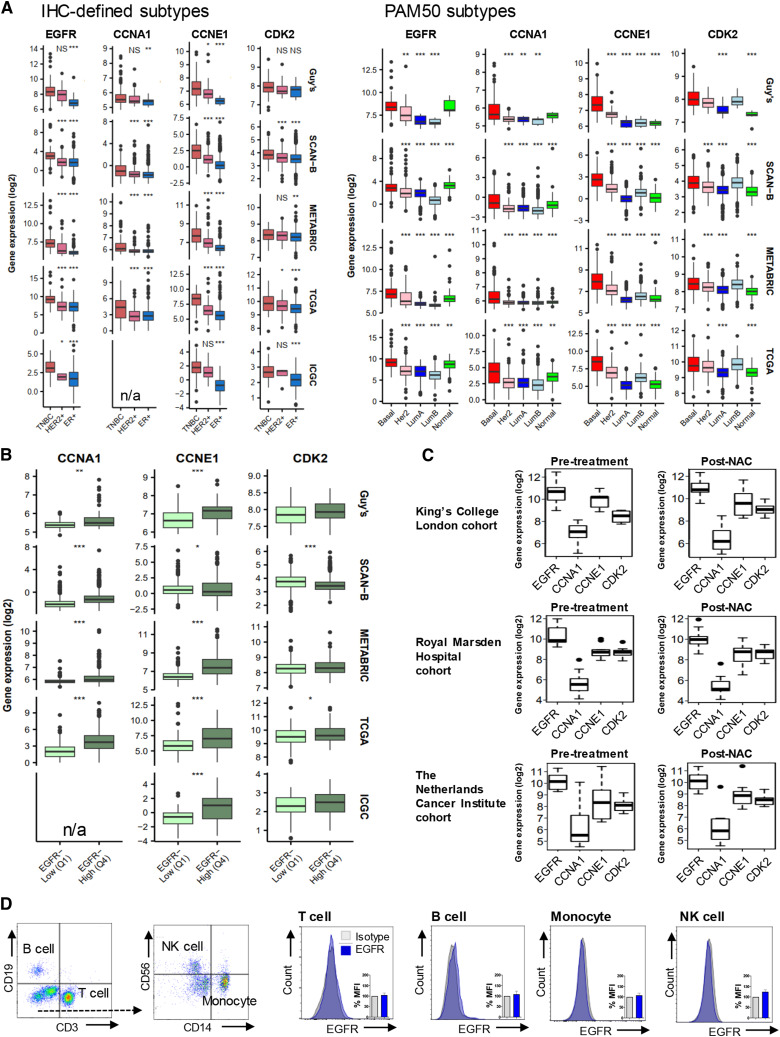
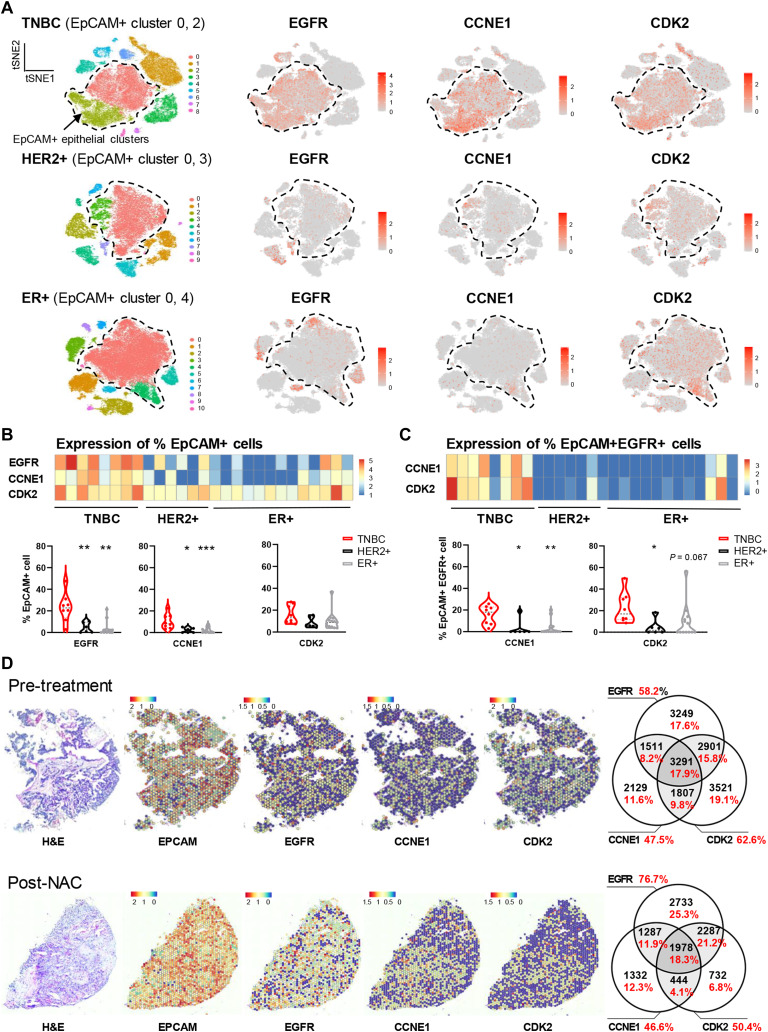
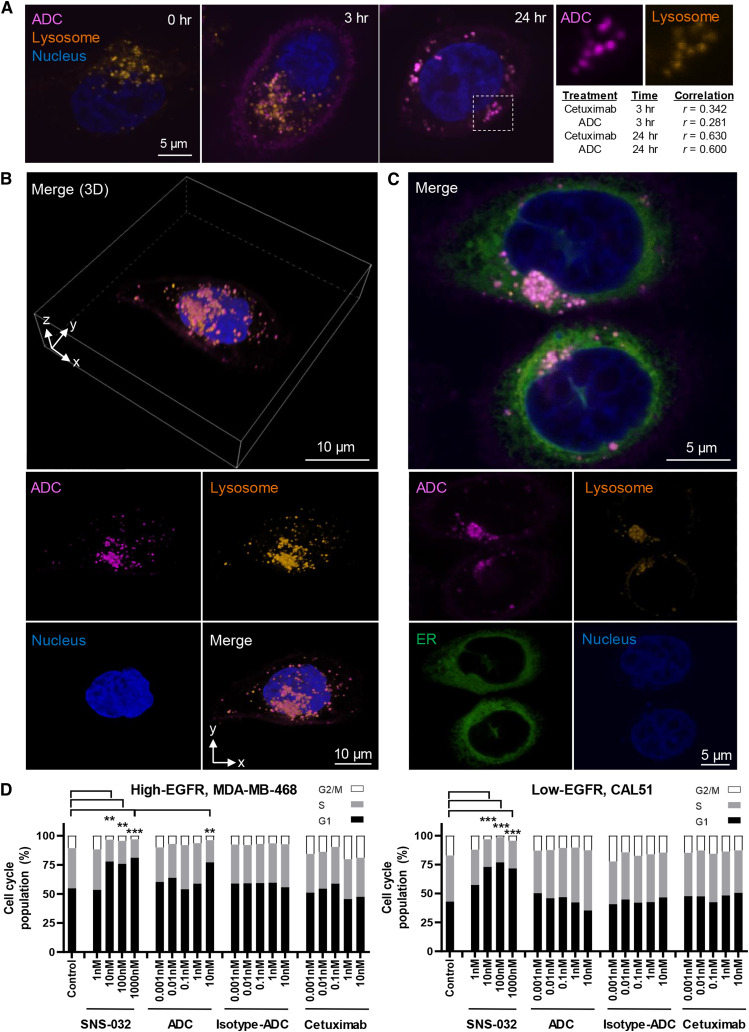
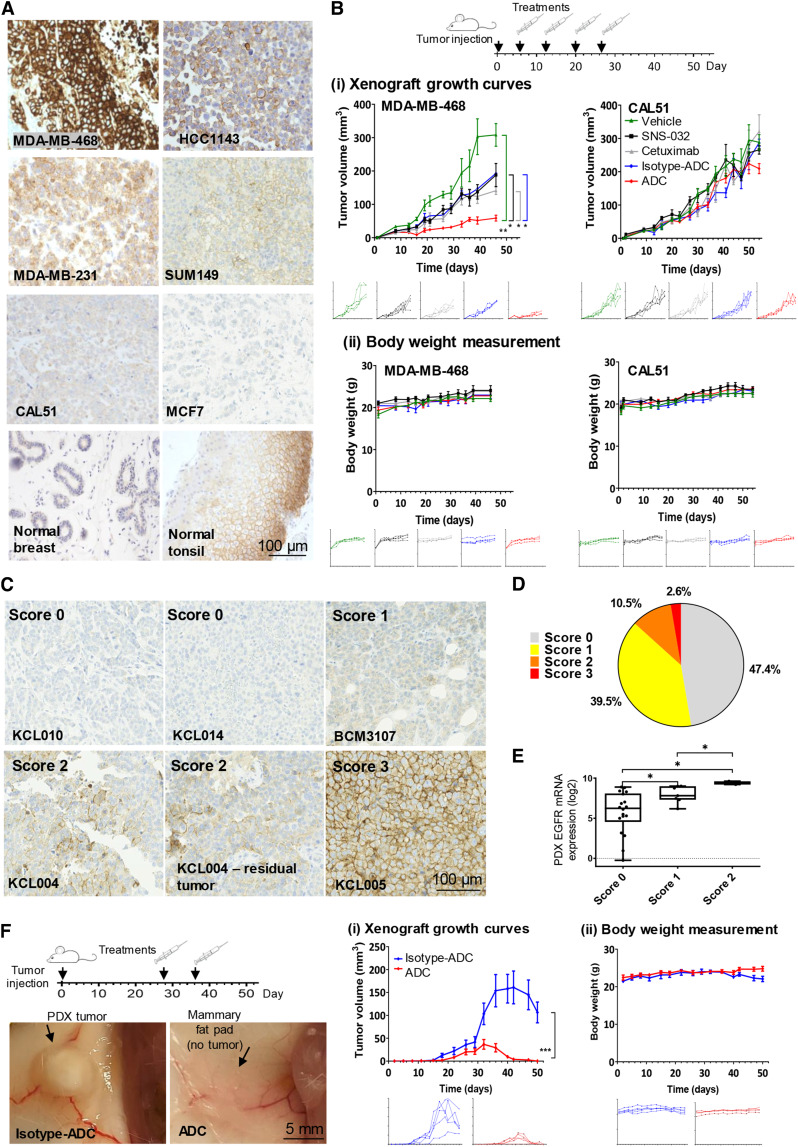
Results: Transcriptomic (6,173 primary, 27 baseline, and matched post-chemotherapy residual tumors), single-cell RNA sequencing (150,290 cells, 27 treatment-naïve tumors), and spatial transcriptomic (43 tumor sections, 22 TNBCs) analyses confirmed expression of CDK2 and its cyclin partners in basal-like/TNBCs, associated with EGFR. Spatiotemporal live-cell imaging and super-resolution confocal microscopy demonstrated ADC colocalization with late lysosomal clusters. The ADC inhibited cell cycle progression, induced cytotoxicity against high EGFR-expressing tumor cells, and bystander killing of neighboring EGFR-low tumor cells, but minimal effects on immune cells. Despite carrying a small molar fraction (1.65%) of the SNS-032 inhibitor, the ADC restricted EGFR-expressing spheroid and cell line/patient-derived xenograft tumor growth.

Conclusions: Exploiting EGFR overexpression, and dysregulated cell cycle in aggressive and treatment-refractory tumors, a cetuximab-CDK inhibitor ADC may provide selective and efficacious delivery of cell cycle-targeted agents to basal-like/TNBCs, including chemotherapy-resistant residual disease.


Conflict of interest statement

A. Cheung reports grants from Breast Cancer Now during the conduct of the study; in addition, A. Cheung has a patent for antibody technology pending. A.M. Chenoweth reports grants from Breast Cancer Now during the conduct of the study; in addition, A.M. Chenoweth has a patent for antibody technologies pending. P. Romero-Clavijo reports grants from CRUK City of London Cancer Centre during the conduct of the study. K.M. Rahman reports grants and other support from Pheon Therapeutics outside the submitted work; in addition, K.M. Rahman has a patent for US10399970B2 issued, US10975072B2 issued, US10975074B2 issued, US9999625B2 issued, and US9376440B2 issued. C.J. Lord reports grants and personal fees from AstraZeneca, Merck KGaA, Artios, and Neophore, as well as personal fees from ForEx, Syncona, Sun Pharma, 3rd Rock, Ono Pharma, Abingworth, Dark Blue Therapeutics, Pontifax, Astex, GlaxoSmithKline, Dawn Bioventures, Blacksmith Medicines, Gerson Lehrman Group, and Vertex; personal fees and other support from Tango Therapeutics and Tesselate; and other support from Ovibio and Hysplex outside the submitted work. C.J. Lord is also a named inventor on patents describing the use of DNA repair inhibitors and stands to gain from their development and use as part of the ICR “Rewards to Inventors” scheme and also reports benefits from this scheme associated with patents for PARP inhibitors paid into C.J. Lord’s personal account and research accounts at the Institute of Cancer Research. A.N.J. Tutt reports grants from Breast Cancer Now during the conduct of the study; other support from The Institute of Cancer Research, Tango, and Pfizer; grants, personal fees, and other support from AstraZeneca; and nonfinancial support and other support from Guardant Health outside the submitted work. S.N. Karagiannis reports grants from Breast Cancer Now, The Biotechnology and Biological Sciences Research Council, Cancer Research UK, the Medical Research Council, National Institute for Health Research (NIHR), and Worldwide Cancer Research during the conduct of the study, as well as grants from Epsilogen Ltd. outside the submitted work; in addition, S.N. Karagiannis declares patents for antibody technologies granted and pending and is founder and shareholder of Epsilogen Ltd. No disclosures were reported by the other authors.

Figures

Figure 1.
Figure 1.
Basal-like/TNBC is associated with upregulated EGFR and G1/S-phase cell cycle genes. A, Gene expression analysis of EGFR, CCNA1, CCNE1, and CDK2 was stratified according to IHC-defined receptor status from five published databases, n = 6,173 primary tumors: Guy’s (TNBC vs. HER2+ vs. ER+, n = 131 vs. 32 vs. 14), Sweden Cancerome Analysis Network—Breast (SCAN-B) (n = 165 vs. 420 vs. 2,425), METABRIC (n = 101 vs. 117 vs. 347), The Cancer Genome Atlas (TCGA) (n = 112 vs. 158 vs. 426), International Cancer Genome Consortium (ICGC) (n = 73 vs. 4 vs. 182; refs. –30). CCNA1 was not included in the ICGC cohort, therefore marked as unavailable (n/a). The cohorts were analyzed by PAM50 classification [Basal-like (Basal), HER2, luminal A (LumA), luminal B (LumB), normal-like (Normal): Guy’s (n = 95, 28, 11, 10, 7), SCAN-B (n = 339, 327, 1657, 729, 221), METABRIC (n = 237, 181, 483, 383, 93), and TCGA (n = 232, 153, 345, 263, 91)]. All P values are compared against TNBC or Basal-like subtype. B, Expression of G1/S-phase genes were compared between low and high EGFR-expressing samples based on quartile ranges of gene expression values (EGFR-low, first quartile Q1; EGFR-high, fourth quartile Q4). Median-centered gene expression log2 values are shown. P values determined using Mann–Whitney U test. C, Gene expression was compared between matched pre-treatment and residual TNBC samples [KCL cohort: (n = 8); Royal Marsden Hospital cohort (n = 9); The Netherlands Cancer Institute cohort (n = 10)]. Cohort details: Supplementary Table S1. D, EGFR expression measured by flow cytometry in peripheral blood mononuclear cells (PBMC; n = 3) following Fc-receptor blocking solution.
Figure 2.
Figure 2.
Single-cell RNA sequencing and spatial transcriptomic analyses reveal cellular and spatial co-expression of EGFR with CDK2/cyclin E in TNBCs. A, Dimensionality reduction t-distributed stochastic neighbor embedding (t-SNE) map of combined scRNA-seq transcriptomes of 150,290 cells from 27 untreated primary tumors (TNBC, n = 8 samples, 54,819 cells; HER2+, n = 6 samples, 31,917 cells; ER+, n = 13 samples, 63,554 cells) colored by cell cluster (32). EpCAM expression revealed two prominent EpCAM+ tumor epithelial clusters in each cancer subtype (dotted lines). t-SNE plots showing expression levels of EGFR, CCNE1, and CDK2 genes for the same clusters. Red: high expression, gray: not detected. Overall expression of CCNA1 was too low and was excluded from the analysis. B, Analyses of the transcriptomic data were conducted to evaluate expression of EGFR, CCNE1, and CDK2 genes per patient and for each patient cohort (TNBC, HER2+, and ER+). Heatmap (top) with color boxes indicating normalized expression level; each column represents a patient tumor. Quantitative analysis (bottom) was calculated by the number of cells expressing EGFR, CCNE1, or CDK2, in proportion to EpCAM+ cells. C, Same analysis was performed on EpCAM+ EGFR+ cells for the expression of CCNE1 and CDK2. P values determined by two-tailed unpaired t test against TNBC subtype. D, Spatial transcriptomic analysis of EGFR, CCNE1, and CDK2 expression in EpCAM+ cell clusters of 43 tumor sections from 22 patients with TNBC (33), where 26 sections were from 13 treatment-naïve patients and 17 sections were from nine residual TNBCs. Tissue architecture integrity in these sections was confirmed by hematoxylin and eosin staining (left). The color scale represents log-transformed normalized gene expression (red, highest; blue, lowest). Representative spatial mapping revealed a consistent pattern of EGFR expression in chemo-naïve and post-NAC-resistant TNBCs, and its spatial relationships with CCNE1 and CDK2 co-expression in tumor sections. Venn diagrams illustrate quantitative analyses for the relationships among EGFR, CCNE1, and CDK2 co-expression (numbers in black represent the number of spatial clusters for all patients in the cohort, and % marked in red represent the proportion of these spatial clusters within all EpCAM+ clusters).
Figure 3.
Figure 3.
Stochastic conjugation of cetuximab to CDK inhibitor and ADC internalization in live breast cancer cells. A, Flow cytometric evaluation of surface EGFR expression (TNBC: MDA-MB-468, HCC1143, HCC1806, MDA-MB-231, HCC1937, SUM149, and CAL51; HER2+: SKBR3; ER+: MCF7, T47D; nontumorigenic epithelial cell model: MCF10A; immune cell model: human B lymphocytes RPMI8866, RPMI8226, and monocytic cell line U937; human primary melanocyte: melanocyte). B, EGFR mRNA expression from the Cancer Cell Line Encyclopedia database showed a positive correlation with surface EGFR measured by flow cytometry in A (Spearman’s rank coefficient, r = 0.723). A high level of correlation was found between EGFR and cyclin E (r = 0.738), but not with cyclin A or CDK2. Nonsignificant P values are marked as NS. C, Top, Schematic diagram of stochastic ADC conjugation by antibody reduction with TCEP and then conjugation to SNS-032 via MC-Val–Ala-PAB. Middle, HIC analysis confirmed an average DAR of 4.4. Bottom, SEC trace indicates negligible ADC aggregation and minimal free linker–payload (less than 0.8%). D, Surface plasmon resonance analysis demonstrated similar binding affinity (KD) for cetuximab (0.73 nmol/L) and ADC (1.28 nmol/L). Isotype IgG1 and isotype ADC showed no measurable binding. E, Monitoring internalization of Fabfluor-pH-labeled cetuximab, ADC, or isotype control (10 nmol/L) by Incucyte live-cell imaging. Phase and red fluorescence time-course images were captured for 24 hours. Images of internalized antibody display in cytosolic, low pH lysosomal vesicle-associated red fluorescence in cells. Scale bar, 0.2 mm. F, Cells were seeded in Matrigel for 5 days, allowing the formation of spheroids. Fabfluor-pH-labeled antibodies or ADC (10 nmol/L) were introduced in the Matrigel and showed rapid internalization in EGFR-high MDA-MB-468 and MDA-MB-231, whereas EGFR-low CAL51 displayed little red fluorescence signals. A low level of internalization was observed for isotype or isotype-ADC controls. Scale bar, 0.5 mm. P values determined by two-tailed unpaired t test of three independent experiments compared with isotype control.
Figure 4.
Figure 4.
Spatiotemporal analysis of ADC internalization in lysosomal clusters and inhibition of cell cycle progression. A, Images represent monitoring treatment of MDA-MB-468 with 10 nmol/L Alexa-Fluor-647-labeled ADC (magenta) for 0, 3, and 24 hours and the colocalization with lysosomes. Following incubation, live cells were stained with low pH lysosome dye (orange) followed by Hoechst 3,342 (blue). Scale bar, 5 μm. Very little cell surface binding and uptake of ADC were shown by EGFR-low CAL51 cells at any time point (Supplementary Fig. S4B). Image J colocalization analysis demonstrated moderate colocalization with low pH lysosomes after 3 hours in MDA-MB-468 (cetuximab vs. lysosome, Pearson’s correlation r = 0.342, n = 45 cells; ADC vs. lysosome, r = 0.281, n = 34 cells), whereas correlation was strong at 24 hours (cetuximab vs. lysosome, r = 0.630, n = 64 cells; ADC vs. lysosome, r = 0.600, n = 28 cells). Right, white box: zoom-in images showing individual channels of a representative area of colocalization between ADC and lysosomal staining. B, 3D reconstruction image of a live MDA-MB-468 cell. The Z-stack images showed spatial information of ADC colocalization within lysosome clusters at 24 hours. Top, merged Z-stack 3D image; bottom, 2D images of individual channels. Scale bar, 10 μm. 3D reconstruction of the Z-stack images demonstrating internalized ADC-lysosome clusters can be found in Supplementary Video S1. C, Confocal images showing a high level of colocalization of internalized ADC in lysosome clusters within the ER in close proximity to the nucleus. Scale bar, 5 μm. D, Quantitative analyses on the distribution of cell cycle phases by flow cytometry after 72 hours of cetuximab-ADC treatment, compared with SNS-032, isotype-ADC, and unconjugated-cetuximab controls. Significant cell cycle inhibition (G1 arrest) was observed with SNS-032 (at 10, 100, 1,000 nmol/L) in both TNBC models, whereas only high EGFR-expressing MDA-MB-468 demonstrated significant inhibition by the ADC (10 nmol/L), but not in EGFR-low CAL51. P values determined via the χ2 test against untreated control in three independent experiments.
Figure 5.
Figure 5.
Anti-EGFR ADC reduces breast cancer cell activities and demonstrated bystander killing effects. A, MTT viability assay following 96-hour treatment with SNS-032, cetuximab, isotype ADC or ADC. Top, EGFR-high breast cancer models. Bottom, EGFR-low breast cancer and immune cell models. B, Cell viability assessment of MDA-MB-468 showed that the addition of SNS-032 did not re-sensitize cells to EGFR inhibition by cetuximab alone, whereas reduced cancer cell viability was detected only when SNS-032 was conjugated to cetuximab as an ADC, suggesting that inhibition of cancer cell viability was induced by ADC internalization and subsequent drug release within cancer cells. SNS-032 efficacy improved by conjugating in the ADC instead of treating it as a free drug. C, Reduction of surface EGFR expression using siRNA, and cell viability comparisons between parental and knockdown cells after 96 hours of ADC treatment (10 nmol/L). D, Time-lapse measurement of cell confluency for cells treated with isotype control (10 nmol/L), cetuximab, and ADC (1 or 10 nmol/L) using Incucyte live-cell microscopy (representative phase images of EGFR-high MDA-MB-468). Scale bar, 0.2 mm. E, TNBC spheroids in Matrigel were treated with 10 nmol/L cetuximab, ADC, or isotype controls, and confluence measured for 7 days using Incucyte. ADC-treated MDA-MB-231 and MDA-MB-468 showed reduced spheroid growth, whereas the ADC showed less potent effects on CAL51. Scale bar, 0.5 mm. F, MDA-MB-468 were transduced with a lentiviral expression vector encoding a mCherry fluorescent protein tag (mChery-MDA-MB-468). Bystander killing effects of the ADC were accessed in co-cultures of high and low EGFR-expressing cells in a one-to-one ratio. High EGFR-expressing mCherry-MDA-MB-468 and either low EGFR-expressing MCF7 or CAL51 cells were plated alone as mono-culture or co-culture, and treated with 1 nmol/L ADC or unconjugated-isotype control antibody. Cell count was measured by Incucyte after washing at 120 hours. Scale bar, 0.5 mm. P values determined by two-tailed unpaired t test of three independent experiments.
Figure 6.
Figure 6.
ADC growth inhibition of orthotopic TNBC xenografts in vivo.A, Staining for EGFR was confirmed using FFPE blocks of cell line xenografts of known EGFR expression pattern (see Fig. 3A; EGFR-high/positive: MDA-MB-468, HCC1143, MDA-MB-231, SUM149; EGFR-low: CAL51, MCF7), compared with human normal breast glandular epithelium and normal tonsil. Scale bar, 100 μm. B, Effects of ADC treatment on tumor growth in vivo. (i) Orthotopic tumor growth of MDA-MB-468 and CAL51 xenografts (n = 4) treated with vehicle, SNS-032 (5 mg/kg), cetuximab, isotype ADC, or ADC (7.5 mg/kg, weekly injection for 4 weeks). P values determined by one-way ANOVA. (ii) Body weight measurement. C, IHC evaluation of EGFR in a TMA of 38 PDX samples established from 35 patients (28 TNBC, five ER+, and two HER2+; disease characteristics: Supplementary Table S2). Representative images showing various staining intensities across samples (scale bar, 100 μm). Pathologists scored the TMA spots for EGFR positivity: score 0, no membrane staining; score 1, weak incomplete membrane staining in >10% cells; score 2, moderate complete membrane staining in >10% cells or strong complete membrane staining in ≤10% cells; score 3, strong (intense and uniform) complete membrane staining in >10% cells. D, Pie chart showing out of 38 PDX samples: 47.4% (n = 18, gray) were negative for membrane EGFR expression; 39.5% (n = 15, yellow) were score 1; 10.5% (n = 4, orange) were score 2; 2.6% (n = 1, red) is highly positive (score 3). E, Microarray-based EGFR mRNA expression was compared with membrane EGFR staining positivity tested by IHC. P value determined by two-tailed unpaired t test. F, Effects of ADC treatment on KCL004 PDX tumor growth in vivo. Left, representative tumor images after two doses of isotype ADC or ADC, where no visible residual tumor was found in any mice treated with ADC during the experimental timeframe. (i) KCL004 PDX orthotopic tumor growth (n = 5) with isotype-ADC or ADC treatment (two doses, 10 mg/kg). (ii) Body weight measurements. P values determined by one-way ANOVA.

References

    1. Lehmann BD, Bauer JA, Chen X, Sanders ME, Chakravarthy AB, Shyr Y, et al. . Identification of human triple-negative breast cancer subtypes and preclinical models for selection of targeted therapies. J Clin Invest 2011;121:2750–67. - PMC - PubMed
    1. Zhao S, Zuo WJ, Shao ZM, Jiang YZ. Molecular subtypes and precision treatment of triple-negative breast cancer. Ann Transl Med 2020;8:499. - PMC - PubMed
    1. Emens LA, Adams S, Barrios CH, Dieras V, Iwata H, Loi S, et al. . First-line atezolizumab plus nab-paclitaxel for unresectable, locally advanced, or metastatic triple-negative breast cancer: IMpassion130 final overall survival analysis. Ann Oncol 2021;32:983–93. - PubMed
    1. Tutt ANJ, Garber JE, Kaufman B, Viale G, Fumagalli D, Rastogi P, et al. . Adjuvant olaparib for patients with BRCA1- or BRCA2-mutated breast cancer. N Engl J Med 2021;384:2394–405. - PMC - PubMed
    1. Bardia A, Hurvitz SA, Tolaney SM, Loirat D, Punie K, Oliveira M, et al. . Sacituzumab govitecan in metastatic triple-negative breast cancer. N Engl J Med 2021;384:1529–41. - PubMed

MeSH terms