. 2024 May 20;12(5):e008848.
doi: 10.1136/jitc-2024-008848.

Sequence of androgen receptor-targeted vaccination with androgen deprivation therapy affects anti-prostate tumor efficacy

Affiliations

Sequence of androgen receptor-targeted vaccination with androgen deprivation therapy affects anti-prostate tumor efficacy

Anusha Muralidhar et al. J Immunother Cancer. .

Abstract

Rationale: Androgen deprivation therapy (ADT) is the primary treatment for recurrent and metastatic prostate cancer. In addition to direct antitumor effects, ADT has immunomodulatory effects such as promoting T-cell infiltration and enhancing antigen processing/presentation. Previous studies in our laboratory have demonstrated that ADT also leads to increased expression of the androgen receptor (AR) and increased recognition of prostate tumor cells by AR-specific CD8+T cells. We have also demonstrated that ADT combined with a DNA vaccine encoding the AR significantly slowed tumor growth and improved the survival of prostate tumor-bearing mice. The current study aimed to investigate the impact of the timing and sequencing of ADT with vaccination on the tumor immune microenvironment in murine prostate cancer models to further increase the antitumor efficacy of vaccines.

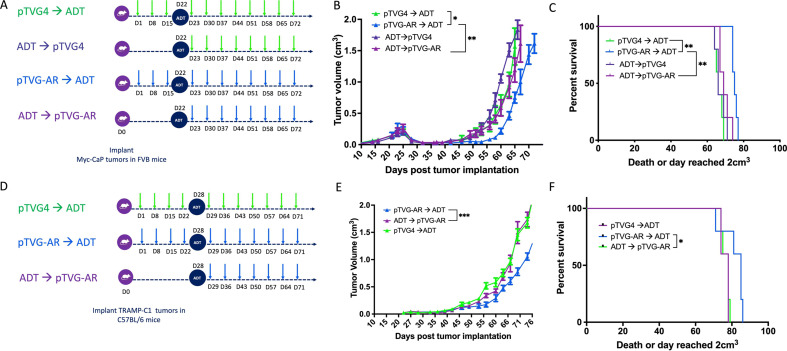
Methods: Male FVB mice implanted with Myc-CaP tumor cells, or male C57BL/6 mice implanted with TRAMP-C1 prostate tumor cells, were treated with a DNA vaccine encoding AR (pTVG-AR) and ADT. The sequence of administration was evaluated for its effect on tumor growth, and tumor-infiltrating immune populations were characterized.

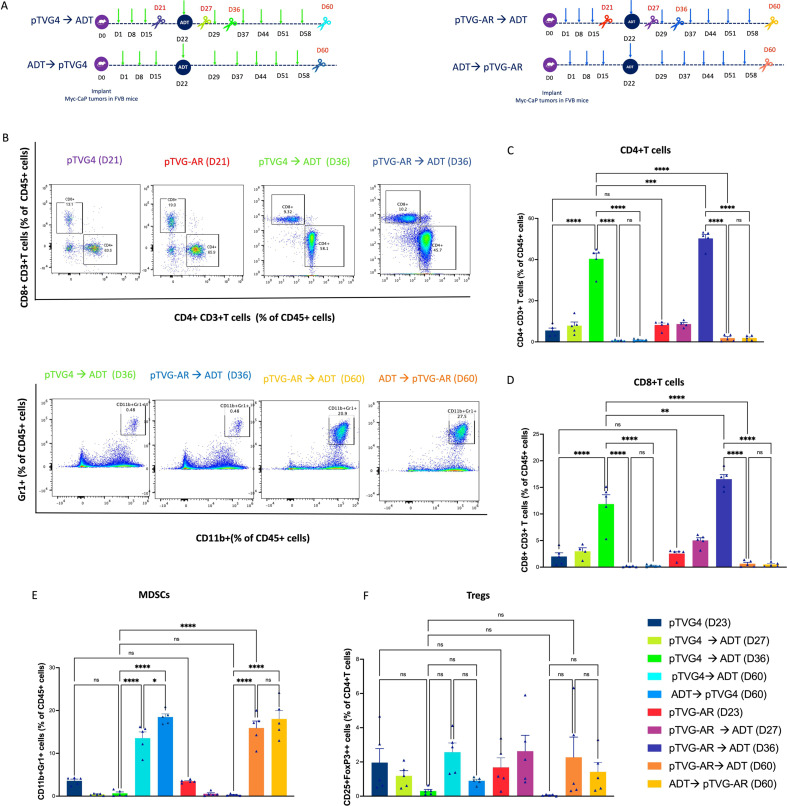
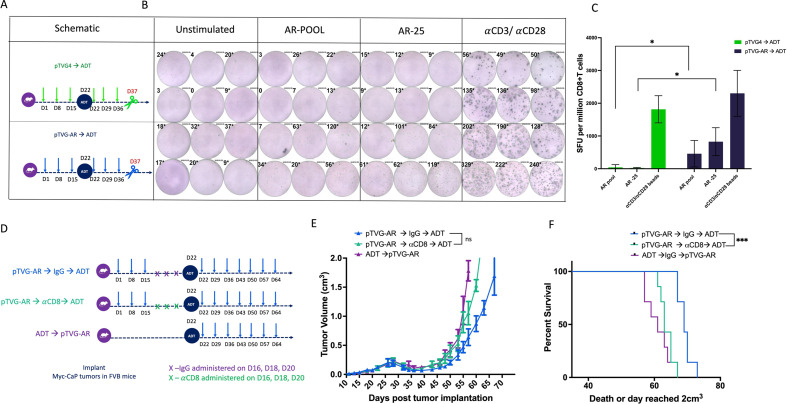
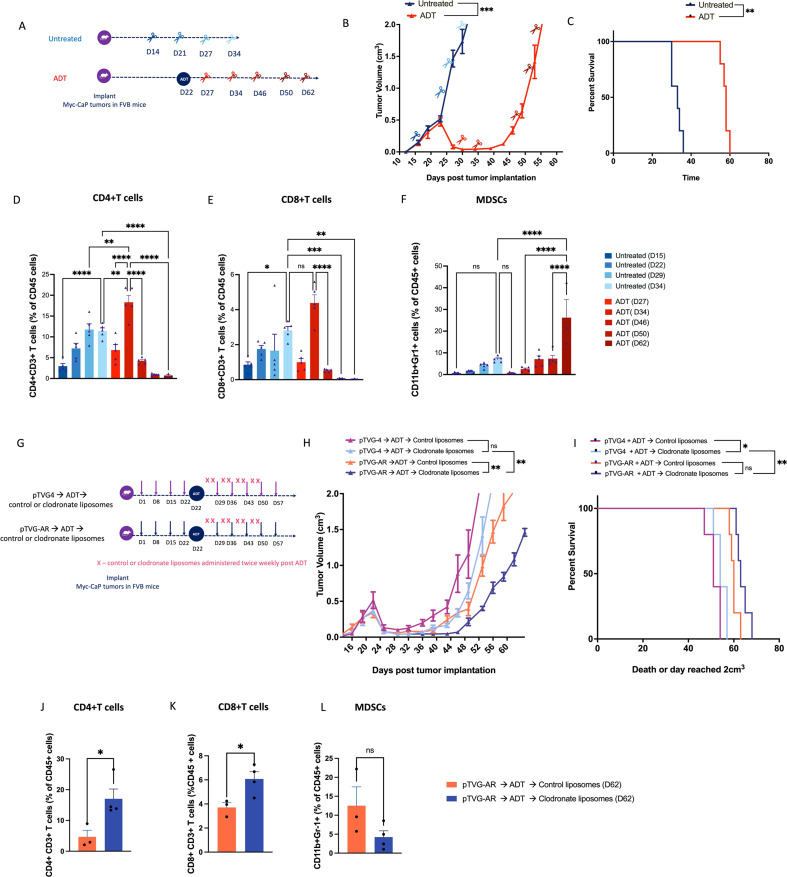
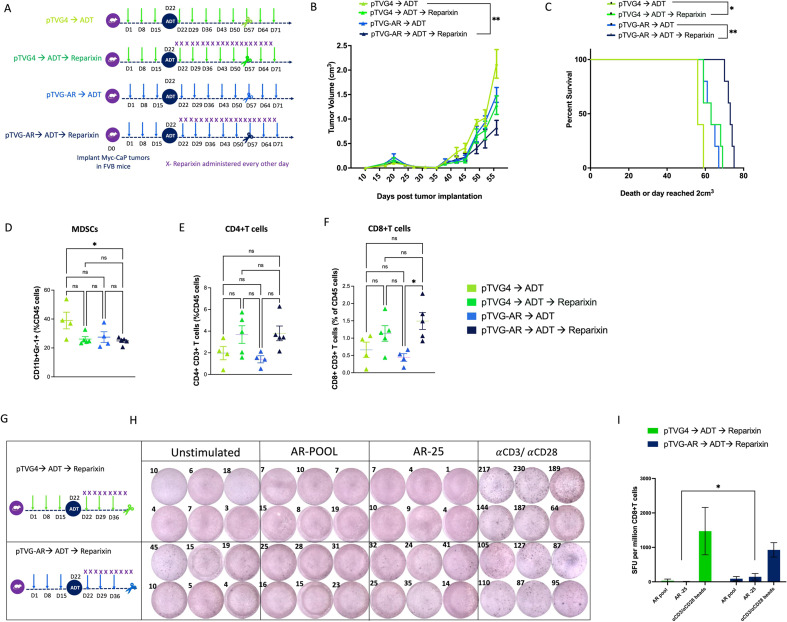
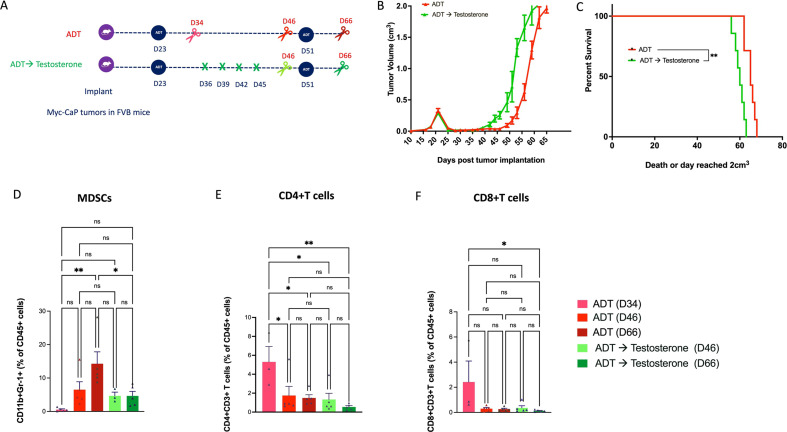
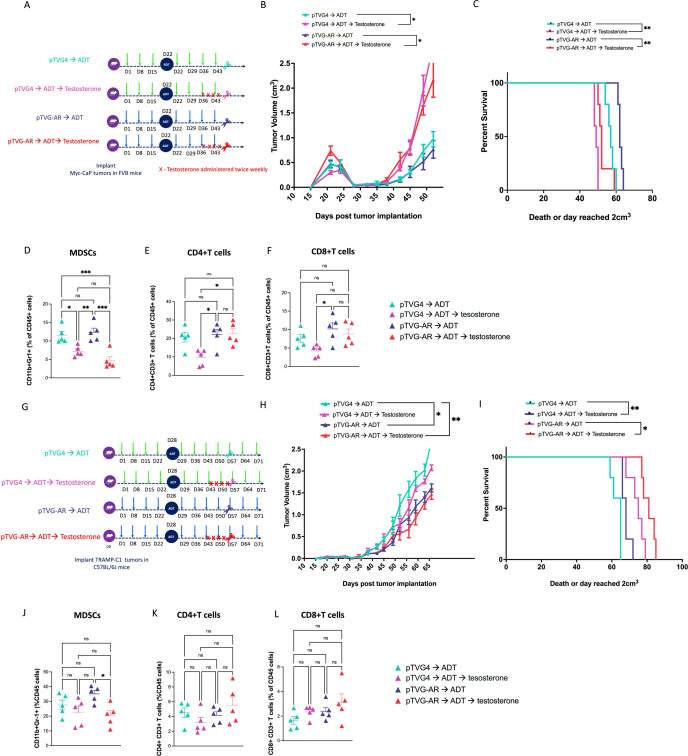
Results: Vaccination prior to ADT (pTVG-AR → ADT) significantly enhanced antitumor responses and survival. This was associated with increased tumor infiltration by CD4+ and CD8+ T cells, including AR-specific CD8+T cells. Depletion of CD8+T cells prior to ADT significantly worsened overall survival. Following ADT treatment, however, Gr1+ myeloid-derived suppressor cells (MDSCs) increased, and this was associated with fewer infiltrating T cells and reduced tumor growth. Inhibiting Gr1+MDSCs recruitment, either by using a CXCR2 antagonist or by cycling androgen deprivation with testosterone replacement, improved antitumor responses and overall survival.

Conclusion: Vaccination prior to ADT significantly improved antitumor responses, mediated in part by increased infiltration of CD8+T cells following ADT. Targeting MDSC recruitment following ADT further enhanced antitumor responses. These findings suggest logical directions for future clinical trials to improve the efficacy of prostate cancer vaccines.

Keywords: Immunotherapy; Myeloid-derived suppressor cell - MDSC; Prostate Cancer; Tumor Microenvironment; Vaccine.


Conflict of interest statement

Competing interests: DGM has an ownership interest, has received research support and serves as a consultant to Madison Vaccines, which has licensed material described in this manuscript. None of the other authors have relevant potential conflicts of interest.

Figures

Figure 1
Figure 1
Sequence of vaccination and ADT, with vaccination given prior to ADT, (pTVG-AR → ADT) significantly improved antitumor responses in murine prostate tumor models. FVB mice were implanted with Myc-CaP tumor cells and treated with degarelix (ADT), with pTVG4 (vector control) or pTVG-AR delivered before or after ADT and followed for tumor growth. Shown is a schema (panel A), tumor growth curves (panel B), and Kaplan-Meier curves depicting survival (time to a tumor size of 2 cm3 or death, panel C). Similarly, male C57BL/6 were implanted with TRAMP-C1 tumor cells, treated with ADT, and with DNA immunization with pTVG4 or pTVG-AR initiated either before or after ADT. For tumor growth curves, asterisks demonstrate significant (*p<0.05, **p<0.01 **p<0.001) differences as assessed by linear mixed effects model with Geisser-Greenhouse correction and Tukey’s multiple comparisons test with individual variances. Kaplan-Meier curves were compared using the log-rank test with asterisks indicating *p<0.05, **p<0.01, and ***p<0.001. Results are each from one experiment, with n=7–8 animals per group, and are representative of two independent experiments (see online supplemental figure 1). ADT, androgen deprivation therapy; AR, androgen receptor.
Figure 2
Figure 2
ADT led to an increase in prostate tumor-infiltrating T cells and myeloid cells, and T-cell infiltration was increased with vaccination prior to ADT. Myc-CaP tumor cells were implanted in male FVB mice and treated with ADT, and DNA immunization was delivered before or after ADT. Additional groups received either vector (pTVG4) or vaccine (pTVG-AR) alone, without ADT. Tumors were sampled at different days for flow cytometry analysis. Shown are a schema (panel A) and representative dot plots (panel B) of CD4+CD3+ and CD8+CD3+ T cells (collected on days 21 and 36), or CD11b+Gr1+ MDSCs (panel H, collected on days 36 and 60). CD4+T cells (panel C), CD8+T cells (panel D), and CD11b+Gr-1+ MDSC (panel E) are shown as a percentage of CD45+cells. CD4+FoxP3+ Tregs (panel F) are shown as a percentage of CD4+T cells. Panels C–F were compared using one-way analysis of variance with Tukey’s multiple comparisons test; asterisks indicate *p<0.05, **p<0.01, and ***p<0.001. Results are from one experiment and are representative of two independent experiments. ADT, androgen deprivation therapy; AR, androgen receptor; MDSC, myeloid derived suppressor cell, Tregs, regulator T cells.
Figure 3
Figure 3
Immunization prior to ADT led to infiltration of tumors by antigen-specific CD8+T cells. Myc-CaP tumor cells were implanted in male FVB mice, treated with ADT and DNA immunization as described before, and tumors were harvested 2 weeks after ADT (schema in panel A). CD8+CD3+T cells were isolated and interferon-γ ELISpot was performed with media alone, AR pool peptides, AR-25, or anti-CD3/anti-CD28 beads. Raw data are shown in panel B and quantified in panel C. Myc-CaP tumor cells were implanted in male FVB mice, treated with ADT and DNA immunization before or after ADT, and mice received IgG (control) or CD8 depleting antibody on days 16, 18 and 20, before ADT treatment (schema in panel D). Shown are the tumor growth curves (panel E) and Kaplan-Meier survival curves (panel F). Panel C was compared using unpaired t-tests. Tumor growth curve comparisons were made using one-way analysis of variance with Tukey’s multiple comparisons test. Kaplan-Meier curves were compared using the log-rank test. Asterisks indicate *p<0.05, **p<0.01, and ***p<0.001. Results are from one experiment and are representative of two independent experiments. ADT, androgen deprivation therapy; AR, androgen receptor; SFU, spot-forming units.
Figure 4
Figure 4
ADT leads to infiltration of MDSCs, and depletion of these populations improved antitumor responses in combination with DNA vaccines. Myc-CaP tumor cells were implanted in male FVB mice and treated with ADT or control as indicated in panel A. Shown are the tumor growth curves and time points at which groups of animals were euthanized for tumor assessments (panel B) and Kaplan-Meier survival curves (panel C). Tumors collected were evaluated by flow cytometry for CD4+T cells (panel D), and CD8+T cells (panel E) and CD11b+Gr-1+ MDSC (panel F). Myc-CaP tumor cells were implanted in male FVB mice, treated as before, and then received control-encapsulated or clodronate-encapsulated liposomes as indicated (schema in panel G). Shown are the tumor growth curves (panel H) and Kaplan-Meier survival curves (panel I). In a parallel study, tumors were collected at day 62 and evaluated by flow cytometry for CD4+T cells (panel J), and CD8+T cells (panel K) and CD11b+Gr-1+ MDSC (panel L). For tumor growth curves, asterisks demonstrate significant (p<0.05) differences as assessed by linear mixed effects model with Geisser-Greenhouse correction and Kaplan-Meier curves were compared using the log-rank test with asterisks indicating *p<0.05, **p<0.01, and ***p<0.001. For panels D–F and J–L, comparisons were made using one-way analysis of variance with Tukey’s multiple comparisons test; asterisks indicate *p<0.05, **p<0.01, and ***p<0.001. Results are from single experiments with n=5 (panels D–F) or 3 (panels J–L) mice per group. ADT, androgen deprivation therapy; AR, androgen receptor; MDSC, myeloid derived suppressor cell.
Figure 5
Figure 5
CXCR2 blockade improved anti-tumor efficacy in the pTVG-AR →ADT combination. Myc-CaP tumor cells were implanted in male FVB mice, treated with vaccine, ADT and reparixin as indicated in panel A. Shown are the tumor growth curves (panel B) and Kaplan-Meier survival curves (panel C). A similar study was performed, and tumors were collected on day 56 and evaluated by flow cytometry for CD4+T cells (panel D), and CD8+T cells (panel E) and CD11b+Gr-1+ MDSC (panel F). In a parallel experiment, tumors were harvested on day 37 and CD8+CD3+T cells were isolated (schema in panel G). Interferon-γ ELISpot was performed with media alone, AR pool peptides, AR-25, or anti-CD3/anti-CD28 beads, with results as shown in panel H and quantified in panel I. For tumor growth curves, asterisks demonstrate significant (p<0.05) differences as assessed by linear mixed effects model with Geisser-Greenhouse correction and Kaplan-Meier curves were compared using the log-rank test with asterisks indicating *p<0.05, **p<0.01, and ***p<0.001. For panels D–F, comparisons were made using one-way analysis of variance with Tukey’s multiple comparisons test; asterisks indicate *p<0.05, **p<0.01, and ***p<0.001. Panel I was compared using unpaired t-tests. Results are from single experiments with n=5 mice per group. ADT, androgen deprivation therapy; AR, androgen receptor; MDSC, myeloid derived suppressor cell.
Figure 6
Figure 6
ADT and testosterone reversal led to reduced accumulation of MDSCs although significantly worsened antitumor responses in the Myc-CaP tumor model. Myc-CaP tumor cells were implanted in male FVB mice, treated with ADT and testosterone as indicated in panel A. Shown are the tumor growth curves (panel B) and Kaplan-Meier survival curves (panel C). In a parallel study, tumors were collected on days 34, 46 and 66 and evaluated by flow cytometry for CD11b+Gr-1+ MDSC (panel D), CD4+T cells (panel E), and CD8+T cells (panel F). For tumor growth curves, asterisks demonstrate significant (p<0.05) differences as assessed by linear mixed effects model with Geisser-Greenhouse correction and Kaplan-Meier curves were compared using the log-rank test with asterisks indicating *p<0.05, **p<0.01, and ***p<0.001. For panels D–F, comparisons were made using one-way analysis of variance with Tukey’s multiple comparisons test; asterisks indicate *p<0.05, **p<0.01, and ***p<0.001. Results are from one experiment with n=5 mice per group. ADT, androgen deprivation therapy; AR, androgen receptor; MDSC, myeloid derived suppressor cell.
Figure 7
Figure 7
ADT and testosterone reversal led to reduced accumulation of MDSC and significantly improved antitumor responses when combined with vaccination in the TRAMP-C1 tumor model but not in the Myc-CaP model. Myc-CaP tumor cells were implanted in male FVB mice, and treated with ADT and DNA immunization with or without testosterone, as indicated in panel A. Shown are the tumor growth curves (panel B) and Kaplan-Meier survival curves (panel C). A similar study was performed, and tumors were collected on days 56 and evaluated by flow cytometry for CD11b+Gr-1+ MDSC (panel D), CD4+T cells (panel E), and CD8+T cells (panel F). TRAMP-C1 tumor cells were implanted in male C56BL/6 mice, treated with ADT and DNA vaccination with or without testosterone as indicated in panel G. Shown are the tumor growth curves (panel H) and Kaplan-Meier survival curves (panel I). A similar study was performed, and tumors were collected on days 56 and evaluated by flow cytometry for CD11b+Gr-1+ MDSCs (panel J), CD4+T cells (panel K), and CD8+T cells (panel L). For tumor growth curves, asterisks demonstrate significant (p<0.05) differences as assessed by linear mixed effects model with Geisser-Greenhouse correction and Kaplan-Meier curves were compared using the log-rank test with asterisks indicating *p<0.05, **p<0.01, and ***p<0.001. For panels D–F and J–L comparisons were made using one-way analysis of variance with Tukey’s multiple comparisons test; asterisks indicate *p<0.05, **p<0.01, and ***p<0.001. Results are from one experiment with n=5 mice per group. ADT, androgen deprivation therapy; AR, androgen receptor; MDSC, myeloid derived suppressor cell.

Similar articles

Cited by

References

    1. Siegel RL, Miller KD, Wagle NS, et al. . Cancer statistics, 2023. CA Cancer J Clin 2023;73:17–48. 10.3322/caac.21763 - DOI - PubMed
    1. Perlmutter MA, Lepor H. Androgen deprivation therapy in the treatment of advanced prostate cancer. Rev Urol 2007;9 Suppl 1:S3–8. - PMC - PubMed
    1. Garcia JA, Rini BI. Castration-resistant prostate cancer: many treatments, many options, many challenges ahead. Cancer 2012;118:2583–93. 10.1002/cncr.26582 - DOI - PubMed
    1. Huggins C. Studies on prostatic cancer. Arch Surg 1941;43:209. 10.1001/archsurg.1941.01210140043004 - DOI
    1. Mercader M, Bodner BK, Moser MT, et al. . T cell infiltration of the prostate induced by androgen withdrawal in patients with prostate cancer. Proc Natl Acad Sci U S A 2001;98:14565–70. 10.1073/pnas.251140998 - DOI - PMC - PubMed

MeSH terms

Substances