

The Cytochrome P450 2C8*3 Variant (rs11572080) Is Associated with Improved Asthma Symptom Control in Children and Altered Lipid Mediator Production and Inflammatory Response in Human Bronchial Epithelial Cells
- PMID: 38772712
- PMCID: PMC11257687
- DOI: 10.1124/dmd.124.001684
The Cytochrome P450 2C8*3 Variant (rs11572080) Is Associated with Improved Asthma Symptom Control in Children and Altered Lipid Mediator Production and Inflammatory Response in Human Bronchial Epithelial Cells
Abstract
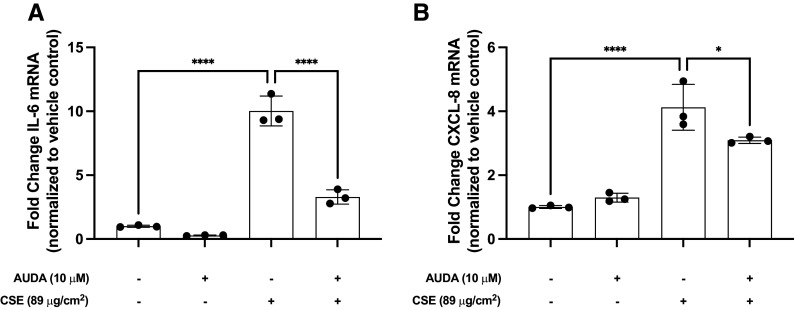
This study investigated an association between the cytochrome P450 (CYP) 2C8*3 polymorphism with asthma symptom control in children and changes in lipid metabolism and pro-inflammatory signaling by human bronchial epithelial cells (HBECs) treated with cigarette smoke condensate (CSC). CYP genes are inherently variable in sequence, and while such variations are known to produce clinically relevant effects on drug pharmacokinetics and pharmacodynamics, the effects on endogenous substrate metabolism and associated physiologic processes are less understood. In this study, CYP2C8*3 was associated with improved asthma symptom control among children: Mean asthma control scores were 3.68 (n = 207) for patients with one or more copies of the CYP2C8*3 allele versus 4.42 (n = 965) for CYP2C8*1/*1 (P = 0.0133). In vitro, CYP2C8*3 was associated with an increase in montelukast 36-hydroxylation and a decrease in linoleic acid metabolism despite lower mRNA and protein expression. Additionally, CYP2C8*3 was associated with reduced mRNA expression of interleukin-6 (IL-6) and C-X-C motif chemokine ligand 8 (CXCL-8) by HBECs in response to CSC, which was replicated using the soluble epoxide hydrolase inhibitor, 12-[[(tricyclo[3.3.1.13,7]dec-1-ylamino)carbonyl]amino]-dodecanoic acid. Interestingly, 9(10)- and 12(13)- dihydroxyoctadecenoic acid, the hydrolyzed metabolites of 9(10)- and 12(13)- epoxyoctadecenoic acid, increased the expression of IL-6 and CXCL-8 mRNA by HBECs. This study reveals previously undocumented effects of the CYP2C8*3 variant on the response of HBECs to exogenous stimuli. SIGNIFICANCE STATEMENT: These findings suggest a role for CYP2C8 in regulating the epoxyoctadecenoic acid:dihydroxyoctadecenoic acid ratio leading to a change in cellular inflammatory responses elicited by environmental stimuli that exacerbate asthma.
Copyright © 2024 by The Author(s).
Figures


Similar articles
-
Confirmation that cytochrome P450 2C8 (CYP2C8) plays a minor role in (S)-(+)- and (R)-(-)-ibuprofen hydroxylation in vitro.Drug Metab Dispos. 2008 Dec;36(12):2513-22. doi: 10.1124/dmd.108.022970. Epub 2008 Sep 11. Drug Metab Dispos. 2008. PMID: 18787056
-
Reevaluation of the microsomal metabolism of montelukast: major contribution by CYP2C8 at clinically relevant concentrations.Drug Metab Dispos. 2011 May;39(5):904-11. doi: 10.1124/dmd.110.037689. Epub 2011 Feb 2. Drug Metab Dispos. 2011. PMID: 21289076
-
Telithromycin, but not montelukast, increases the plasma concentrations and effects of the cytochrome P450 3A4 and 2C8 substrate repaglinide.Clin Pharmacol Ther. 2006 Mar;79(3):231-42. doi: 10.1016/j.clpt.2005.11.002. Epub 2006 Feb 7. Clin Pharmacol Ther. 2006. PMID: 16513447 Clinical Trial.
-
Role of Cytochrome P450 2C8 in Drug Metabolism and Interactions.Pharmacol Rev. 2016 Jan;68(1):168-241. doi: 10.1124/pr.115.011411. Pharmacol Rev. 2016. PMID: 26721703 Review.
-
Montelukast in pediatric asthma management.Indian J Pediatr. 2006 Apr;73(4):275-82. doi: 10.1007/BF02825818. Indian J Pediatr. 2006. PMID: 16816486 Review.
References
-
- Arbitrio M, Scionti F, Di Martino MT, Pensabene L, Tassone P, Tagliaferri P (2022). Pharmacogenetics/pharmacogenomics of drug-metabolizing enzymes and transporters, in Comprehensive Pharmacology (Kenakin T ed) pp 657–697, Elsevier, Amsterdam.
-
- Balgoma DYang MSjödin MSnowden SKarimi RLevänen BMerikallio HKaarteenaho RPalmberg LLarsson K, et al. (2016) Linoleic acid-derived lipid mediators increase in a female-dominated subphenotype of COPD. Eur Respir J 47:1645–1656. - PubMed
-
- Bishop-Bailey D, Thomson S, Askari A, Faulkner A, Wheeler-Jones C (2014) Lipid-metabolizing CYPs in the regulation and dysregulation of metabolism. Annu Rev Nutr 34:261–279. - PubMed
MeSH terms
Substances
Grants and funding
LinkOut - more resources
Full Text Sources
Medical
Molecular Biology Databases
Research Materials
