

Optimal processing of surface facial EMG to identify emotional expressions: A data-driven approach
- PMID: 38773029
- PMCID: PMC11362446
- DOI: 10.3758/s13428-024-02421-4
Optimal processing of surface facial EMG to identify emotional expressions: A data-driven approach
Abstract
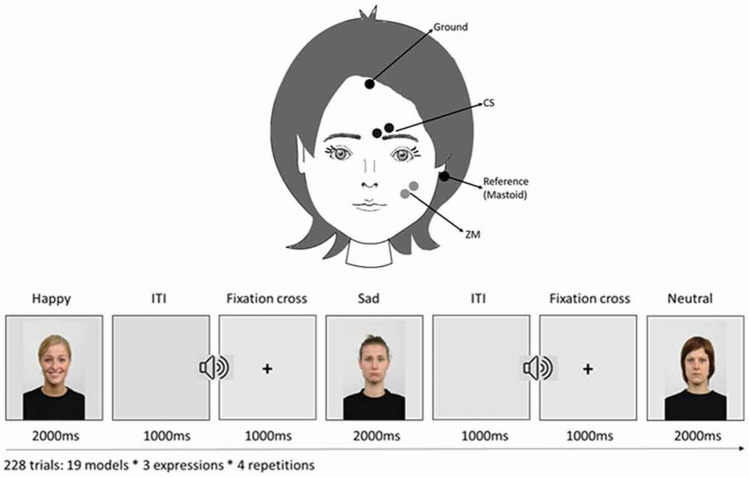
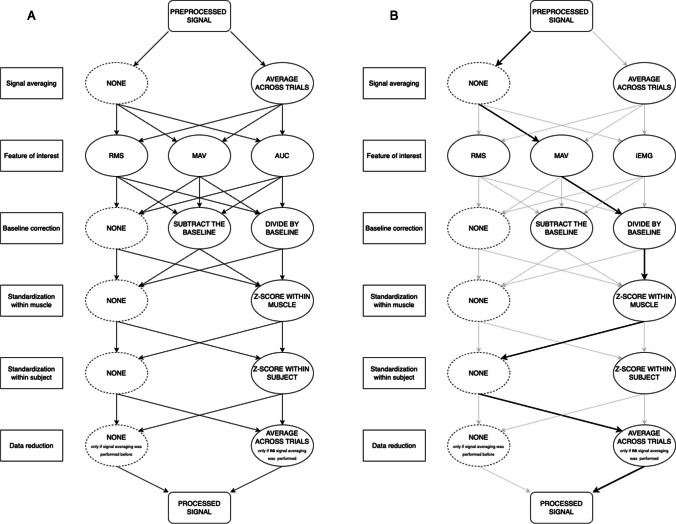
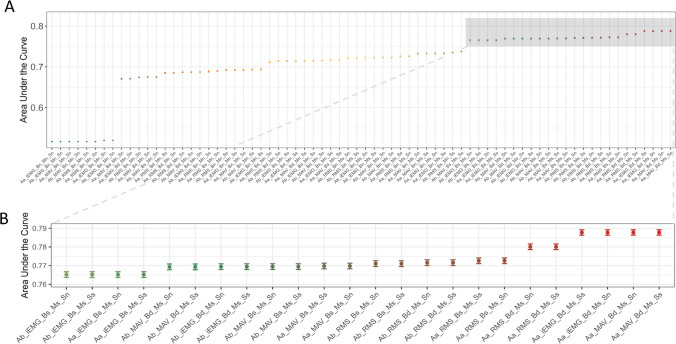
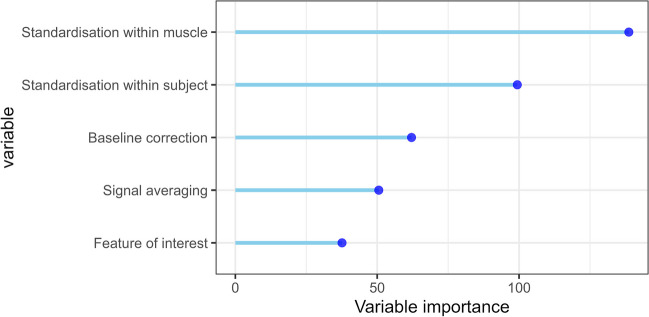
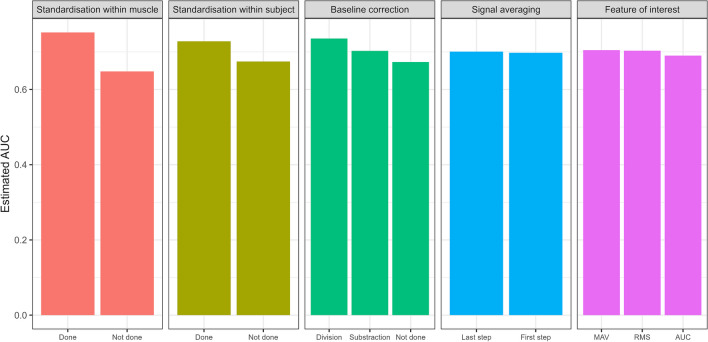
Surface facial electromyography (EMG) is commonly used to detect emotions from subtle facial expressions. Although there are established procedures for collecting EMG data and some aspects of their processing, there is little agreement among researchers about the optimal way to process the EMG signal, so that the study-unrelated variability (noise) is removed, and the emotion-related variability is best detected. The aim of the current paper was to establish an optimal processing pipeline for EMG data for identifying emotional expressions in facial muscles. We identified the most common processing steps from existing literature and created 72 processing pipelines that represented all the different processing choices. We applied these pipelines to a previously published dataset from a facial mimicry experiment, where 100 adult participants observed happy and sad facial expressions, whilst the activity of their facial muscles, zygomaticus major and corrugator supercilii, was recorded with EMG. We used a resampling approach and subsets of the original data to investigate the effect and robustness of different processing choices on the performance of a logistic regression model that predicted the mimicked emotion (happy/sad) from the EMG signal. In addition, we used a random forest model to identify the most important processing steps for the sensitivity of the logistic regression model. Three processing steps were found to be most impactful: baseline correction, standardisation within muscles, and standardisation within subjects. The chosen feature of interest and the signal averaging had little influence on the sensitivity to the effect. We recommend an optimal processing pipeline, share our code and data, and provide a step-by-step walkthrough for researchers.
Keywords: Emotion; Facial electromyography; Multiverse; Optimal pipeline; Surface electromyography.
© 2024. The Author(s).
Conflict of interest statement
The authors declare no conflicts of interest.
Figures
Similar articles
-
Study of posed emotion in facial EMG asymmetry.Percept Mot Skills. 2006 Apr;102(2):430-4. doi: 10.2466/pms.102.2.430-434. Percept Mot Skills. 2006. PMID: 16826664
-
Concordance between surface and intra-muscular recordings of facial emg during emotional expression.Electromyogr Clin Neurophysiol. 1996 Mar;36(2):73-9. Electromyogr Clin Neurophysiol. 1996. PMID: 8925783
-
EMG activity in response to static and dynamic facial expressions.Int J Psychophysiol. 2011 Feb;79(2):330-3. doi: 10.1016/j.ijpsycho.2010.11.001. Epub 2010 Nov 11. Int J Psychophysiol. 2011. PMID: 21074582
-
Facial EMG – Investigating the Interplay of Facial Muscles and Emotions.2022 Nov 29. In: Boggio PS, Wingenbach TSH, da Silveira Coêlho ML, Comfort WE, Murrins Marques L, Alves MVC, editors. Social and Affective Neuroscience of Everyday Human Interaction: From Theory to Methodology [Internet]. Cham (CH): Springer; 2023. Chapter 17. 2022 Nov 29. In: Boggio PS, Wingenbach TSH, da Silveira Coêlho ML, Comfort WE, Murrins Marques L, Alves MVC, editors. Social and Affective Neuroscience of Everyday Human Interaction: From Theory to Methodology [Internet]. Cham (CH): Springer; 2023. Chapter 17. PMID: 37988550 Free Books & Documents. Review.
-
Application of facial neuromuscular electrical stimulation (fNMES) in psychophysiological research: Practical recommendations based on a systematic review of the literature.Behav Res Methods. 2024 Apr;56(4):2941-2976. doi: 10.3758/s13428-023-02262-7. Epub 2023 Oct 20. Behav Res Methods. 2024. PMID: 37864116 Free PMC article.
Cited by
-
Surface Electromyographic Features for Severity Classification in Facial Palsy: Insights from a German Cohort and Implications for Future Biofeedback Use.Sensors (Basel). 2025 May 7;25(9):2949. doi: 10.3390/s25092949. Sensors (Basel). 2025. PMID: 40363384 Free PMC article.
-
Attachment is in the eye of the beholder: a pupillometry study on emotion processing.Sci Rep. 2025 Mar 7;15(1):8015. doi: 10.1038/s41598-025-92347-4. Sci Rep. 2025. PMID: 40055431 Free PMC article.
References
-
- Altimari, L., Dantas, J. L., Bigliassi, M., Kanthack, T., Moraes, A., & Abrao, T. (2012). Influence of different strategies of treatment muscle contraction and relaxation phases on EMG signal processing and analysis during cyclic exercise. In G. R. Naik (Ed.), Computational Intelligence in Electromyography Analysis. IntechOpen. 10.5772/50599
-
- Asendorpf, J. B., Conner, M., De Fruyt, F., De Houwer, J., Denissen, J. J. A., Fiedler, K., Fiedler, S., Funder, D. C., Kliegl, R., Nosek, B. A., Perugini, M., Roberts, B. W., Schmitt, M., van Aken, M. A. G., Weber, H., & Wicherts, J. M. (2013). Recommendations for Increasing Replicability in Psychology. European Journal of Personality,27(2), 108–119. 10.1002/per.1919 10.1002/per.1919 - DOI
-
- Besomi, M., Hodges, P. W., Clancy, E. A., Van Dieën, J., Hug, F., Lowery, M., Merletti, R., Søgaard, K., Wrigley, T., Besier, T., Carson, R. G., Disselhorst-Klug, C., Enoka, R. M., Falla, D., Farina, D., Gandevia, S., Holobar, A., Kiernan, M. C., McGill, K., & Tucker, K. (2020). Consensus for experimental design in electromyography (CEDE) project: Amplitude normalization matrix. Journal of Electromyography and Kinesiology,53, 102438. 10.1016/j.jelekin.2020.102438 10.1016/j.jelekin.2020.102438 - DOI - PubMed
-
- Bradley, A. P. (1997). The use of the area under the ROC curve in the evaluation of machine learning algorithms. Pattern Recognition,30(7), 1145–1159. 10.1016/S0031-3203(96)00142-2 - DOI
Publication types
MeSH terms
Grants and funding
LinkOut - more resources
Full Text Sources
