

Sodium quantification in skeletal muscle: comparison between Cartesian gradient-echo and radial ultra-short echo time 23Na MRI techniques
- PMID: 38773044
- PMCID: PMC11109078
- DOI: 10.1186/s41747-024-00461-1
Sodium quantification in skeletal muscle: comparison between Cartesian gradient-echo and radial ultra-short echo time 23Na MRI techniques
Abstract
Background: Clinical magnetic resonance imaging (MRI) studies often use Cartesian gradient-echo (GRE) sequences with ~2-ms echo times (TEs) to monitor apparent total sodium concentration (aTSC). We compared Cartesian GRE and ultra-short echo time three-dimensional (3D) radial-readout sequences for measuring skeletal muscle aTSC.
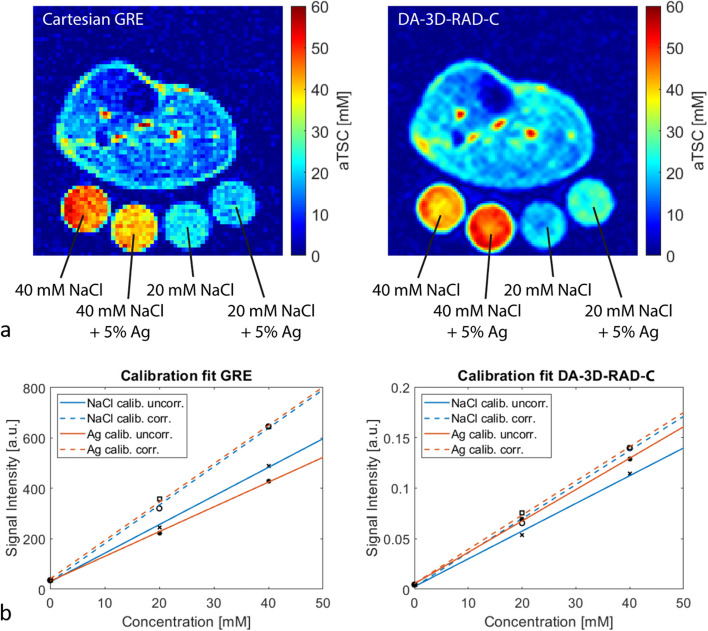
Methods: We retrospectively evaluated 211 datasets from 112 volunteers aged 62.3 ± 12.1 years (mean ± standard deviation), acquired at 3 T from the lower leg. For 23Na MRI acquisitions, we used a two-dimensional Cartesian GRE sequence and a density-adapted 3D radial readout sequence with cuboid field-of-view (DA-3D-RAD-C). We calibrated the 23Na MR signal using reference tubes either with or without agarose and subsequently performed a relaxation correction. Additionally, we employed a six-echo 1H GRE sequence and a multi-echo spin-echo sequence to calculate proton density fat fraction (PDFF) and water T2. Paired Wilcoxon signed-rank test, Cohen dz for paired samples, and Spearman correlation were used.
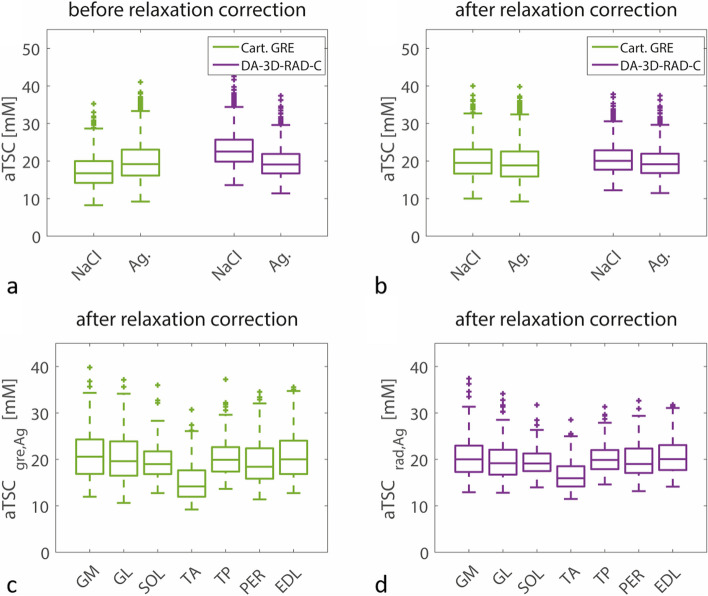
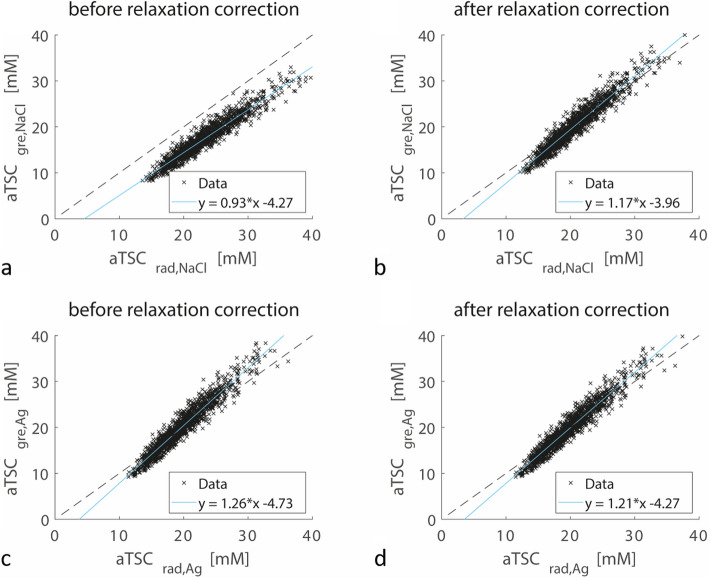
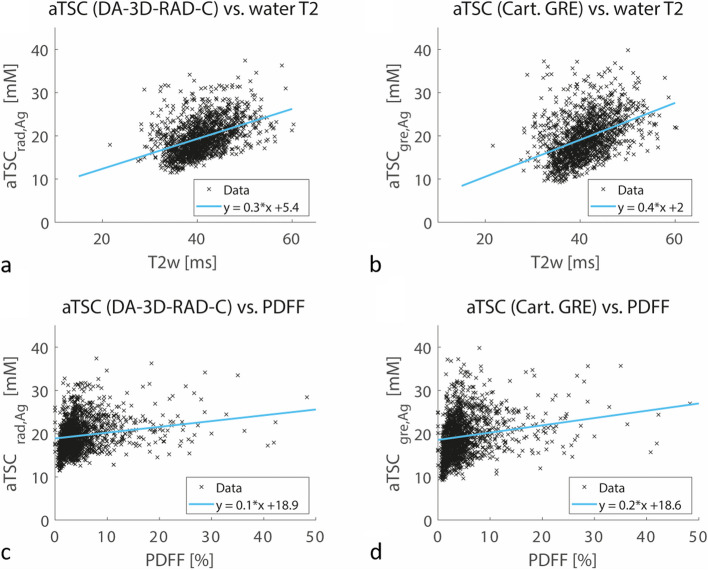
Results: Relaxation correction effectively reduced the differences in muscle aTSC between the two acquisition and calibration methods (DA-3D-RAD-C using NaCl/agarose references: 20.05 versus 19.14 mM; dz = 0.395; Cartesian GRE using NaCl/agarose references: 19.50 versus 18.82 mM; dz = 0.427). Both aTSC of the DA-3D-RAD-C and Cartesian GRE acquisitions showed a small but significant correlation with PDFF as well as with water T2.
Conclusions: Different 23Na MRI acquisition and calibration approaches affect aTSC values. Applying relaxation correction is advised to minimize the impact of sequence parameters on quantification, and considering additional fat correction is advisable for patients with increased fat fractions.
Relevance statement: This study highlights relaxation correction's role in improving sodium MRI accuracy, paving the way for better disease assessment and comparability of measured sodium signal in patients.
Key points: • Differences in MRI acquisition methods hamper the comparability of sodium MRI measurements. • Measured sodium values depend on used MRI sequences and calibration method. • Relaxation correction during postprocessing mitigates these discrepancies. • Thus, relaxation correction enhances accuracy of sodium MRI, aiding its clinical use.
Keywords: Calibration; Magnetic resonance imaging; Muscle (skeletal); Sodium; Volunteers.
© 2024. The Author(s).
Conflict of interest statement
The authors declare that they have no competing interests.
Figures

Similar articles
-
Advantages of a T1-Weighted Gradient-Recalled Echo (GRE) Sequence With a Radial 3D Sampling Approach Versus 2D Turbo Spin-Echo and Cartesian 3D GRE Sequences in Head and Neck MRI.AJR Am J Roentgenol. 2020 Apr;214(4):747-753. doi: 10.2214/AJR.19.21579. Epub 2020 Jan 8. AJR Am J Roentgenol. 2020. PMID: 31913067
-
Hepatic Iron Quantification Using a Free-Breathing 3D Radial Gradient Echo Technique and Validation With a 2D Biopsy-Calibrated R2* Relaxometry Method.J Magn Reson Imaging. 2022 May;55(5):1407-1416. doi: 10.1002/jmri.27921. Epub 2021 Sep 20. J Magn Reson Imaging. 2022. PMID: 34545639 Free PMC article.
-
Sodium MRI of the human heart at 7.0 T: preliminary results.NMR Biomed. 2015 Aug;28(8):967-75. doi: 10.1002/nbm.3338. Epub 2015 Jun 17. NMR Biomed. 2015. PMID: 26082025
-
Minimizing magnetic resonance image geometric distortion at 7 Tesla for frameless presurgical planning using skin-adhered fiducials.Med Phys. 2023 Feb;50(2):694-701. doi: 10.1002/mp.16035. Epub 2022 Nov 12. Med Phys. 2023. PMID: 36301228 Review.
-
Bone Biomarkers Based on Magnetic Resonance Imaging.Semin Musculoskelet Radiol. 2024 Feb;28(1):62-77. doi: 10.1055/s-0043-1776431. Epub 2024 Feb 8. Semin Musculoskelet Radiol. 2024. PMID: 38330971 Free PMC article. Review.
Cited by
-
Longitudinal Follow-Up of Patients With Duchenne Muscular Dystrophy Using Quantitative 23Na and 1H MRI.J Cachexia Sarcopenia Muscle. 2025 Apr;16(2):e13812. doi: 10.1002/jcsm.13812. J Cachexia Sarcopenia Muscle. 2025. PMID: 40254293 Free PMC article.
References
Publication types
MeSH terms
Grants and funding
LinkOut - more resources
Full Text Sources
Medical