

Deep learning of left atrial structure and function provides link to atrial fibrillation risk
- PMID: 38773065
- PMCID: PMC11109224
- DOI: 10.1038/s41467-024-48229-w
Deep learning of left atrial structure and function provides link to atrial fibrillation risk
Abstract
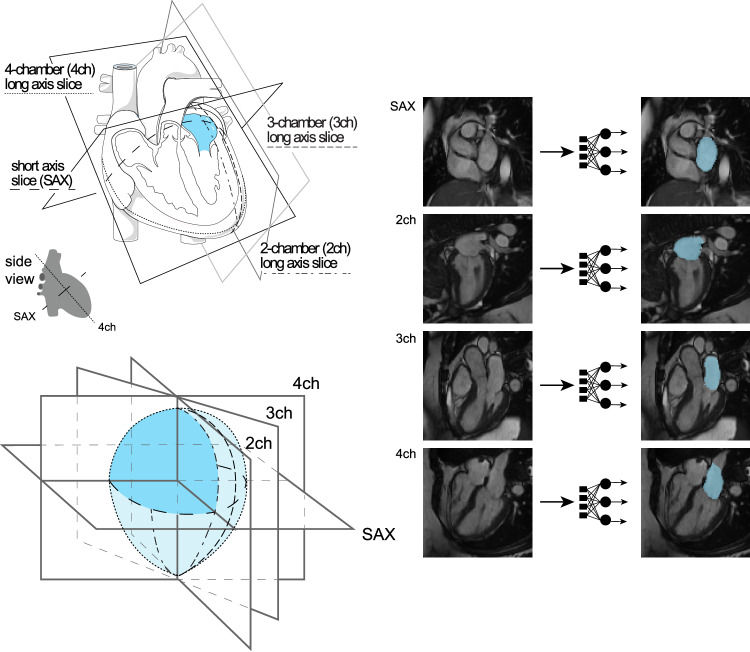
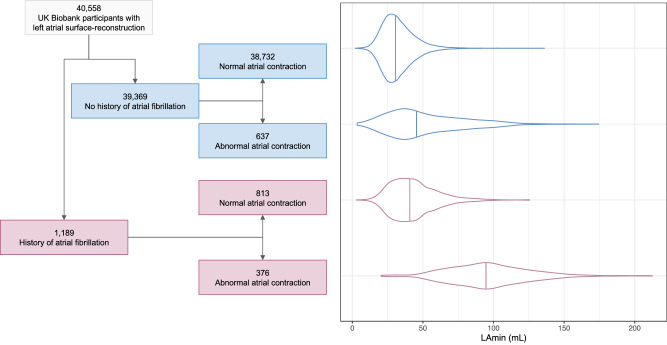
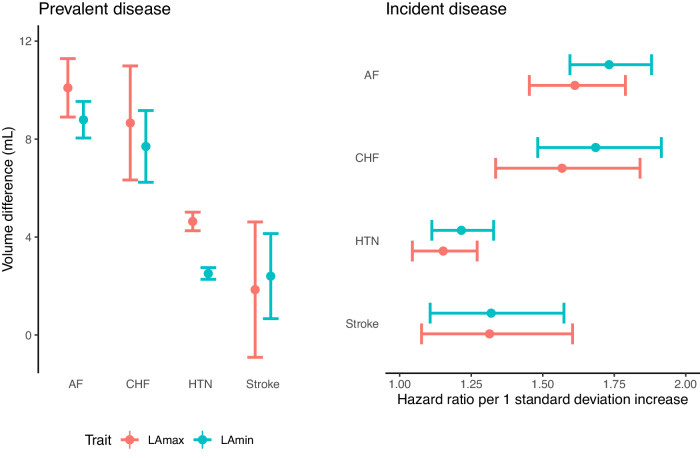
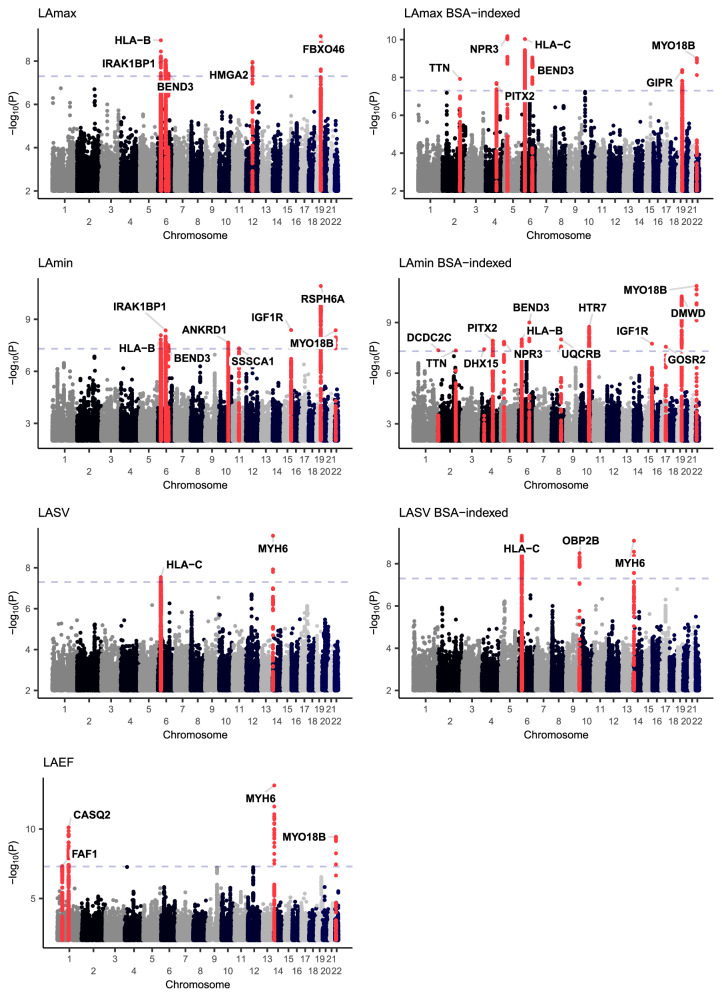
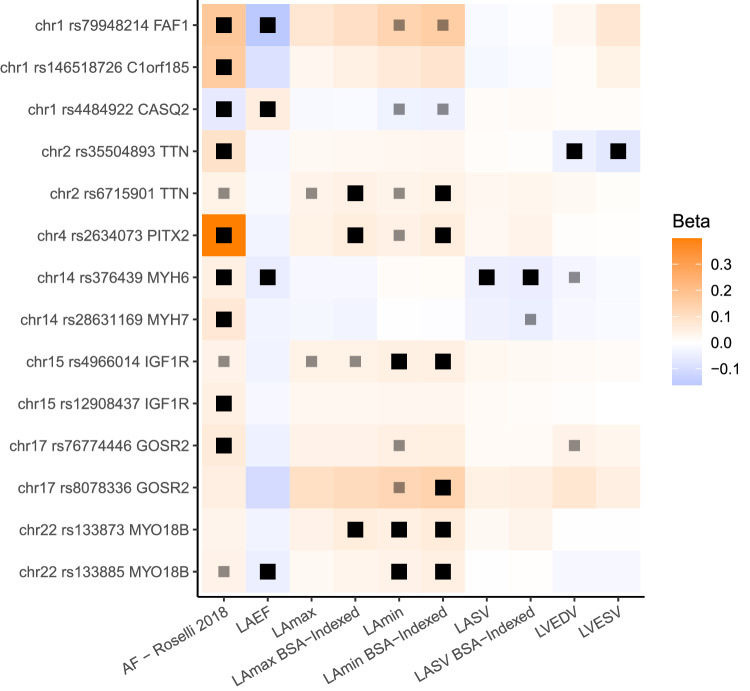
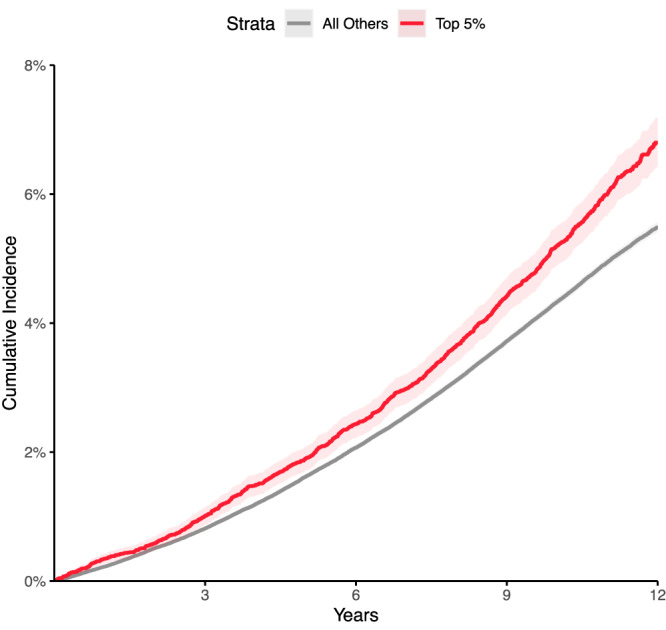
Increased left atrial volume and decreased left atrial function have long been associated with atrial fibrillation. The availability of large-scale cardiac magnetic resonance imaging data paired with genetic data provides a unique opportunity to assess the genetic contributions to left atrial structure and function, and understand their relationship with risk for atrial fibrillation. Here, we use deep learning and surface reconstruction models to measure left atrial minimum volume, maximum volume, stroke volume, and emptying fraction in 40,558 UK Biobank participants. In a genome-wide association study of 35,049 participants without pre-existing cardiovascular disease, we identify 20 common genetic loci associated with left atrial structure and function. We find that polygenic contributions to increased left atrial volume are associated with atrial fibrillation and its downstream consequences, including stroke. Through Mendelian randomization, we find evidence supporting a causal role for left atrial enlargement and dysfunction on atrial fibrillation risk.
© 2024. The Author(s).
Conflict of interest statement
Dr. Pirruccello has served as a consultant for Maze Therapeutics. Dr. Lubitz is an employee of Novartis as of July 2022. Dr. Lubitz received sponsored research support from Bristol Myers Squibb, Pfizer, Boehringer Ingelheim, Fitbit, Medtronic, Premier, and IBM, and has consulted for Bristol Myers Squibb, Pfizer, Blackstone Life Sciences, and Invitae. Dr. Ng is employed by IBM Research. Dr. Ho is supported by a grant from Bayer AG focused on machine learning and cardiovascular disease and a research grant from Gilead Sciences. Dr. Ho has received research supplies from EcoNugenics. Dr. Philippakis is employed as a Venture Partner at GV; he is also supported by a grant from Bayer AG to the Broad Institute focused on machine learning for clinical trial design. Dr. Ellinor is supported by a grant from Bayer AG to the Broad Institute focused on the genetics and therapeutics of cardiovascular diseases. Dr. Ellinor has also served on advisory boards or consulted for Bayer AG, Quest Diagnostics, MyoKardia and Novartis. The remaining authors report no disclosures.
Figures
References
MeSH terms
Grants and funding
- K08 HL159346/HL/NHLBI NIH HHS/United States
- R01 HL139731/HL/NHLBI NIH HHS/United States
- OT2 OD026556/OD/NIH HHS/United States
- OT2 OD025315/OD/NIH HHS/United States
- OT2 OD026551/OD/NIH HHS/United States
- U24 OD023121/OD/NIH HHS/United States
- OT2 OD026552/OD/NIH HHS/United States
- OT2 OD026549/OD/NIH HHS/United States
- OT2 OD025337/OD/NIH HHS/United States
- OT2 OD025277/OD/NIH HHS/United States
- OT2 OD026555/OD/NIH HHS/United States
- OT2 OD026550/OD/NIH HHS/United States
- OT2 OD026553/OD/NIH HHS/United States
- OT2 OD023205/OD/NIH HHS/United States
- OT2 OD025276/OD/NIH HHS/United States
- K23 HL169839/HL/NHLBI NIH HHS/United States
- OT2 OD026554/OD/NIH HHS/United States
- U24 OD023163/OD/NIH HHS/United States
- OT2 OD023206/OD/NIH HHS/United States
- K24 HL105780/HL/NHLBI NIH HHS/United States
- R01 HL140224/HL/NHLBI NIH HHS/United States
- U24 OD023176/OD/NIH HHS/United States
- OT2 OD026548/OD/NIH HHS/United States
- R01 HL092577/HL/NHLBI NIH HHS/United States
- U2C OD023196/OD/NIH HHS/United States
- R01 HL157635/HL/NHLBI NIH HHS/United States
- OT2 OD026557/OD/NIH HHS/United States
- K08HL159346/U.S. Department of Health & Human Services | NIH | National Heart, Lung, and Blood Institute (NHLBI)
- T32 HL007604/HL/NHLBI NIH HHS/United States
- K24 HL153669/HL/NHLBI NIH HHS/United States
- R01 HL134893/HL/NHLBI NIH HHS/United States
