. 2024 May 21;15(5):350.
doi: 10.1038/s41419-024-06737-z.

Seipin deficiency-induced lipid dysregulation leads to hypomyelination-associated cognitive deficits via compromising oligodendrocyte precursor cell differentiation

Affiliations

Seipin deficiency-induced lipid dysregulation leads to hypomyelination-associated cognitive deficits via compromising oligodendrocyte precursor cell differentiation

Wenli Cui et al. Cell Death Dis. .

Abstract

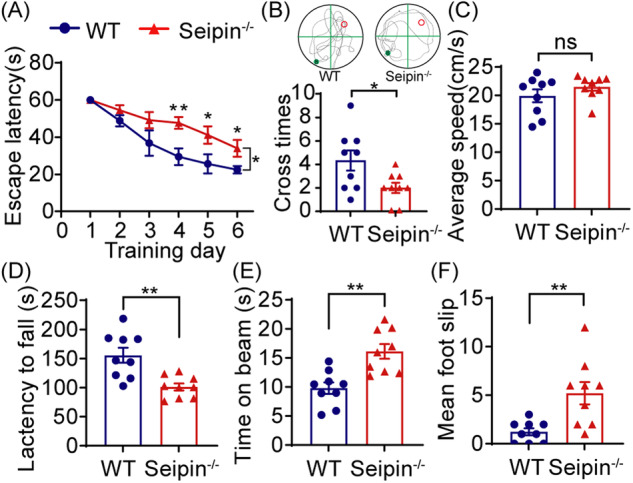
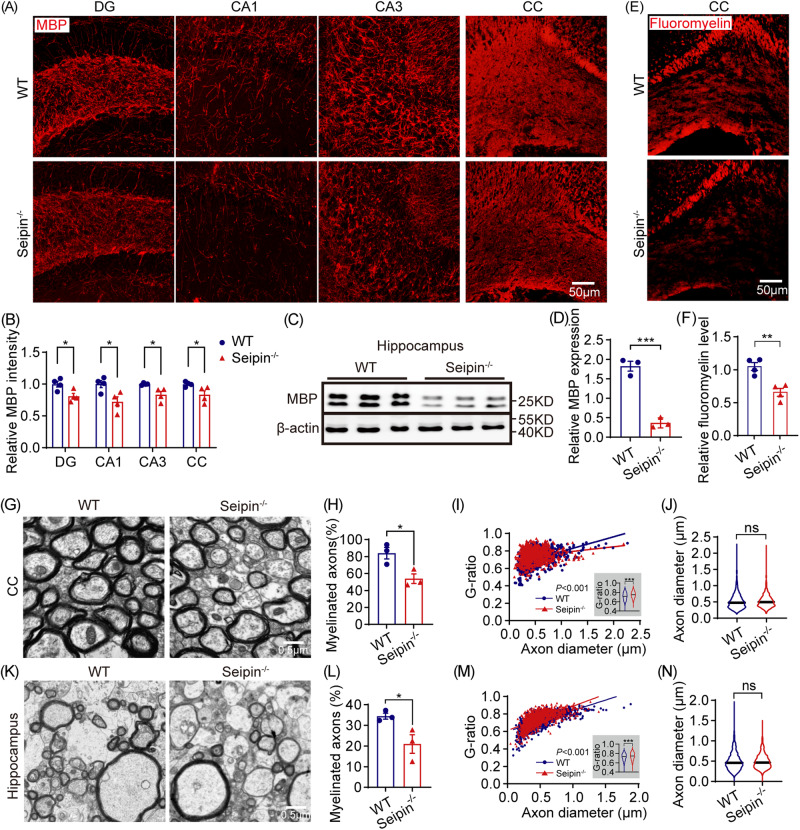
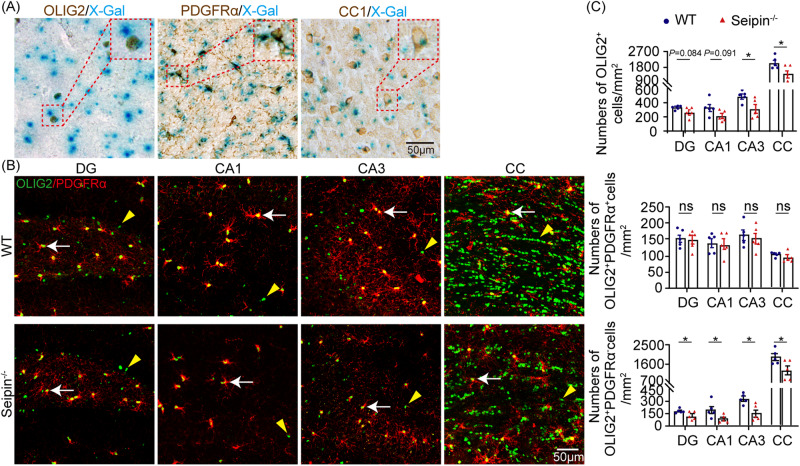
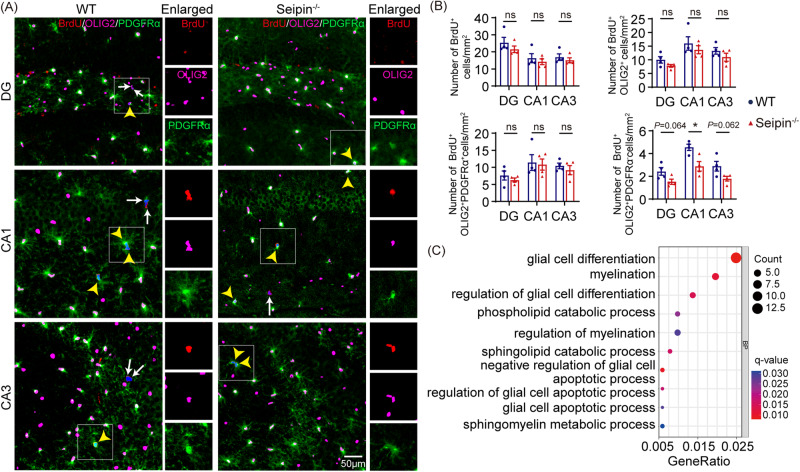
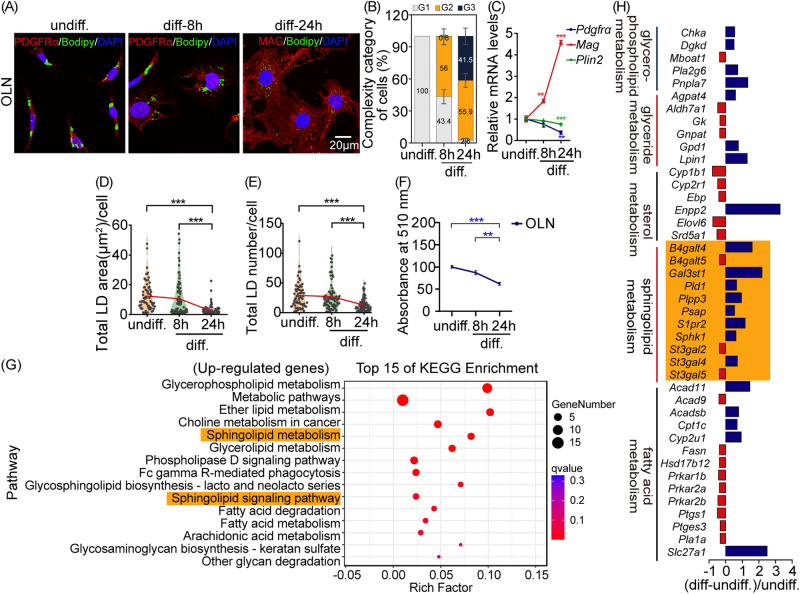
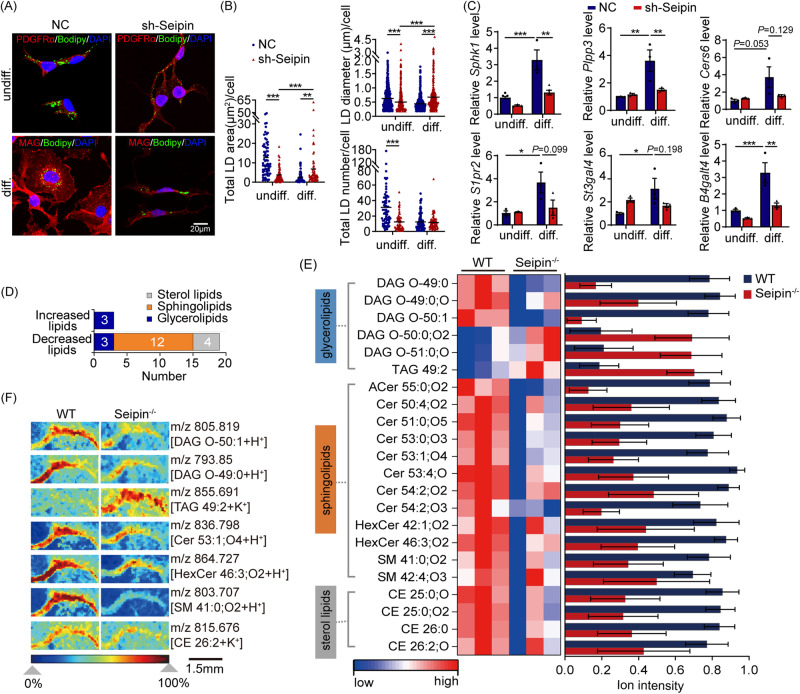
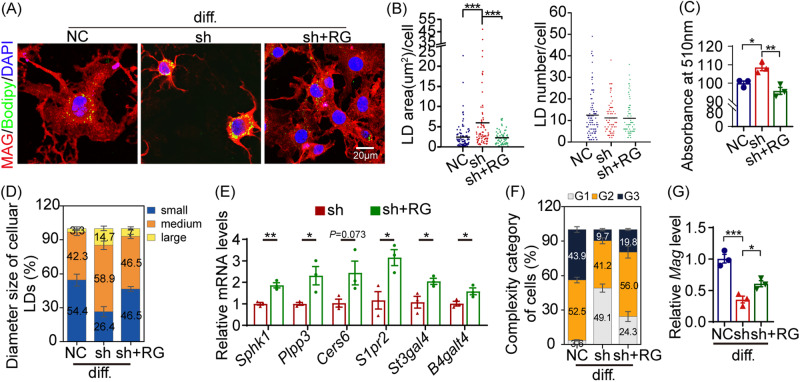
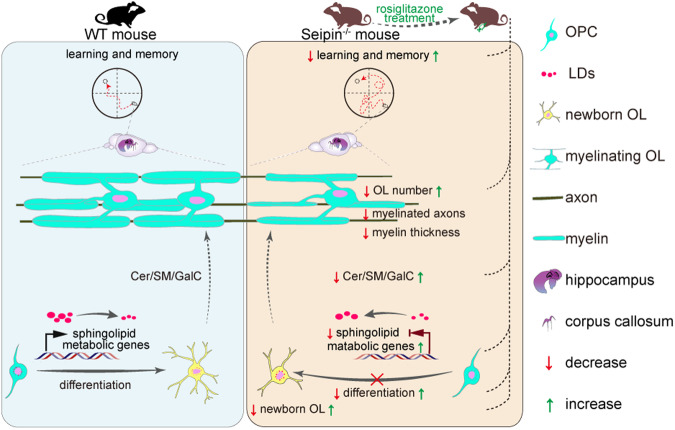
Seipin is one key mediator of lipid metabolism that is highly expressed in adipose tissues as well as in the brain. Lack of Seipin gene, Bscl2, leads to not only severe lipid metabolic disorders but also cognitive impairments and motor disabilities. Myelin, composed mainly of lipids, facilitates nerve transmission and is important for motor coordination and learning. Whether Seipin deficiency-leaded defects in learning and motor coordination is underlined by lipid dysregulation and its consequent myelin abnormalities remains to be elucidated. In the present study, we verified the expression of Seipin in oligodendrocytes (OLs) and their precursors, oligodendrocyte precursor cells (OPCs), and demonstrated that Seipin deficiency compromised OPC differentiation, which led to decreased OL numbers, myelin protein, myelinated fiber proportion and thickness of myelin. Deficiency of Seipin resulted in impaired spatial cognition and motor coordination in mice. Mechanistically, Seipin deficiency suppressed sphingolipid metabolism-related genes in OPCs and caused morphological abnormalities in lipid droplets (LDs), which markedly impeded OPC differentiation. Importantly, rosiglitazone, one agonist of PPAR-gamma, substantially restored phenotypes resulting from Seipin deficiency, such as aberrant LDs, reduced sphingolipids, obstructed OPC differentiation, and neurobehavioral defects. Collectively, the present study elucidated how Seipin deficiency-induced lipid dysregulation leads to neurobehavioral deficits via impairing myelination, which may pave the way for developing novel intervention strategy for treating metabolism-involved neurological disorders.


Conflict of interest statement

The authors declare that the research was conducted in the absence of any commercial or financial relationships that could be construed as a potential conflict of interest.

Figures

Fig. 1
Fig. 1. Seipin deficiency impaired cognition and motor coordination of mice.
A-C The Morris water maze test shows the latency to reach the hidden platform in the acquisition phase (A), the number of platform crossings in the target quadrant and representative tracks (B), and average swimming speed (C) in the Seipin-/- and WT mice. D Latency to fall off in the rotarod test. E, F Time to cross the beam (E) and number of foot slips (F) in the beam walking test. Graph data were presented as mean ± s.e.m. with n = 9 mice/group. *P < 0.05, **P < 0.01 (A Two-way repeated ANOVA was used for the latencies to platform from the 1st to 6th days. A-F Unpaired t-tests were used for the outcomes on the 4th, 5th, and 6th day).
Fig. 2
Fig. 2. Seipin deficiency induced hypomyelination in mice brain.
A, B Representative images (A) and quantification of MBP signal intensity (B) in the DG/CA1/CA3 of the hippocampus and CC of Seipin-/- and WT mice. C, D Immunoblot blots (C) and densitometric analysis (D) of MBP in hippocampus of Seipin-/- and WT mice. E, F Representative images (E) and quantification (F) of Fluoromyelin signal intensity in the CC of Seipin-/- and WT mice. G-J Representative electron micrographs (G), proportion of myelinated axons (H), scatter plots of g-ratio values across all axon diameters (I), and axon diameters (J) in the CC of Seipin-/- and WT mice. K-N Representative electron micrographs (K), quantification of the percentage of myelinated axons (L), scatter plots of g-ratio across all axon diameters (M), and axon diameters (N) in the hippocampus of Seipin-/- and WT mice. Graph data were presented as mean ± s.e.m. with n = 3-4 mice per group (B-F) and n > 850 axons from 3 mice/group (G-N). *P < 0.05, **P < 0.01; ***P < 0.001 (Unpaired t-tests).
Fig. 3
Fig. 3. Seipin deficiency reduced OL density in mice brains.
A Representative images of OLIG2, PDGFRα, or CC1 staining (brown) and X-gal staining (blue) of Seipin-/- mice brain sections. Red dotted boxes show the enlarged fields. B Representative merged images of OLIG2 (green) and PDGFRα (red) double staining. OPCs (OLIG2+PDGFRα+) are indicated by white arrows. OLs (OLIG2+PDGFRα-) are indicated by yellow arrowheads. C Quantification of OL lineage cells (OLIG2+), OPCs (OLIG2+PDGFRα+), and OLs (OLIG2+PDGFRα-) per mm2 in the DG, CA1, CA3, and CC. Graph data were presented as mean ± s.e.m. with n = 5 mice/group. *P < 0.05; ns, not significant (Unpaired t-tests).
Fig. 4
Fig. 4. Seipin deficiency compromised OPC differentiation in mice brains.
A Representative images illustrating triple-staining of BrdU (red) with OL linage marker OLIG2 (pink) and OPCs marker PDGFRα (green). Yellow arrowheads, proliferating OPCs (BrdU+OLIG2+PDGFRα+). White arrows, newly generated OLs (BrdU+OLIG2+PDGFRα-). B Quantification of proliferating cells (BrdU+), proliferating OL linage cells (BrdU+OLIG2+), proliferating OPCs, and newly generated OLs per mm2 in the DG, CA1, and CA3. C For GO functional analysis of all DEGs in isolated brain tissues from Seipin-/- relative to WT mice, scatter plots show items significantly enriched in the biological process (BP). Graph data were presented as mean ± s.e.m. with n = 4 mice/group. *P < 0.05; ns, not significant (Unpaired t-tests).
Fig. 5
Fig. 5. LDs and sphingolipid metabolism were involved in OPC differentiation.
A Representative fluorescent images show LDs in OLN cells with differentiation for 0, 8, or 24 h. B Percentage histogram of different histological categories of OLN cells. C Normalized levels of Pdgfrα, Mag, and Plin2 mRNA. asterisk, diff-24 versus undiff. or diff-8h versus undiff. D, E Violin plots depict area (D) and number (E) of LDs per cell. The mean values of LDs area and number at different times are connected by a red line. F Quantification of ORO staining. G Scattered plots show the top 15 pathways significantly enriched for all DEGs between diff- and undiff-OLN cells. H RNA-seq shows the fold changes of significantly altered sphingolipid metabolism-related genes (orange patch) in OLN cells after 24 h of differentiation. undiff.: undifferentiated. diff.: differentiated for 24 h. Graph data were presented as mean ± s.e.m. n > 150 cells (B, D, and E). **P < 0.01, ***P < 0.001 (One-way ANOVA and followed by Bonferroni’s post hoc test).
Fig. 6
Fig. 6. Seipin deficiency compromised LDs dynamics & sphingolipid metabolism in OPC differentiation.
A Representative confocal images of NC and sh-Seipin OLN cells before and after differentiation. B Violin plots illustrate area, diameter, and number of LDs per cell in NC and sh-Seipin OLN cells before and after differentiation. Black lines, mean values of LDs area, diameter, or number. C Normalized mRNA levels of sphingolipid metabolism-related genes in NC and sh-Seipin OLN cells before and after differentiation. D–F MALDI-TOF MSI shows distribution of identified lipids (D), heatmap analysis of significantly changed lipids (E), and ion images of representative lipids (F) in the CC of adult Seipin-/- mice. undiff.: undifferentiated. diff.: differentiated for 24 h. Graph data were presented as mean ± s.e.m. with n = 3 mice/group (D–F). *P < 0.05, **P < 0.01, ***P < 0.001 (B, C Two-way ANOVA followed by Turkey-Kramer post hoc tests).
Fig. 7
Fig. 7. RG treatment promoted OPC differentiation by restoring LDs dynamics and sphingolipid metabolism in OLN cells.
A Representative images of differentiated NC, sh-Seipin (sh), and sh+RG cells. B Violin plots illustrate the area and number of LDs in differentiated NC, sh, and sh+RG groups. Black lines, mean values of LDs area and number. C Quantification of ORO staining. D Distribution of different-sized LDs in differentiated NC, sh, and sh+RG cells. E Normalized mRNA levels of sphingolipid metabolism-related genes in differentiated sh and sh+RG cells. F Percentage histogram of histological categories of differentiated NC, sh, and sh+RG cells. G Normalized Mag mRNA levels in differentiated NC, sh, and sh+RG cells. diff.: differentiated for 24 h. NC: OLN cells transfected with NC-shRNA. sh: OLN cells transfected with Seipin-shRNA. sh+RG: sh-Seipin cells treated with RG. Graph data were presented as mean ± s.e.m. n > 150 cells (B, D, and F). *P < 0.05, **P < 0.01, ***P < 0.001 (B, C, and G One-way ANOVA followed by Bonferroni’s post hoc test. E unpaired t-test).
Fig. 8
Fig. 8. RG treatment improved myelination and cognition by restoring sphingolipid metabolism of Seipin-/- mice.
A Illustration of experimental schedule. B Relative mRNA levels of sphingolipid metabolism-related genes in Seipin-/- mice upon treatment with RG (Seipin-/-+RG). C, D Spatial distribution (C) and box plots (D) show ions intensity of sphingolipids in the hippocampus. AUC > 0.75, ***P < 0.001. E, F Representative images (E) and quantification (F) show the total number of proliferating OL linage cells (BrdU+OLIG2+), proliferating OPCs (BrdU+OLIG2+PDGFRα+), and newly generated OLs (BrdU+OLIG2+PDGFRα-) in the CA1. G, H MBP staining (G) and quantification (H) of CA1. Dashed boxed areas are enlarged. I, J Western blotting (I) and quantification (J) of the bands of MBP in the hippocampus. K Latency to reach the hidden platform in the MWM test. red asterisk, WT versus Seipin-/- mice; green asterisk, Seipin-/- versus Seipin-/-+RG mice. L-N Average swimming speed (L), the number of platform crossings in the target quadrant (M), and representative tracks (N) of WT, Seipin-/-, and Seipin-/-+RG mice in the MWM test. Graph data were presented as mean ± s.e.m. with n = 4-6 mice/group (B-J) and n = 10-18 mice per group (K-N). *P < 0.05, **P < 0.01, ***P < 0.001 (B Unpaired student’s t-test. K two-way repeated ANOVA followed by Bonferroni’s post hoc test. D, F, H, J, L and M one-way ANOVA followed by Bonferroni’s post hoc tests).
Fig. 9
Fig. 9. Summary schematic illustrating cognitive deficits induced by Seipin deficiency through impaired OPC differentiation, which is restored by RG administration.
Seipin deficiency impaired OPC differentiation, consequent myelination, and spatial cognition. Mechanistically, Seipin deficiency induced lipid dyshomeostasis via interfering expression of sphingolipid metabolism-related genes. RG administration rescued phenotypes induced by Seipin deficiency.

Similar articles

Cited by

References

    1. Su WC, Lin YH, Pagac M, Wang CW. Seipin negatively regulates sphingolipid production at the ER-LD contact site. J Cell Biol. 2019;218:3663–80. doi: 10.1083/jcb.201902072. - DOI - PMC - PubMed
    1. Ghanbarpour A, Valverde DP, Melia TJ, Reinisch KM. A model for a partnership of lipid transfer proteins and scramblases in membrane expansion and organelle biogenesis. Proc Natl Acad Sci USA. 2021;118:e2101562118. doi: 10.1073/pnas.2101562118. - DOI - PMC - PubMed
    1. Li YE, Wang Y, Du X, Zhang T, Mak HY, Hancock SE, et al. TMEM41B and VMP1 are scramblases and regulate the distribution of cholesterol and phosphatidylserine. J Cell Biol. 2021;220:e202103105. doi: 10.1083/jcb.202103105. - DOI - PMC - PubMed
    1. Zhao YG, Chen Y, Miao G, Zhao H, Qu W, Li D, et al. The ER-Localized Transmembrane Protein EPG-3/VMP1 Regulates SERCA Activity to Control ER-Isolation Membrane Contacts for Autophagosome Formation. Mol Cell. 2017;67:974–89 e6. doi: 10.1016/j.molcel.2017.08.005. - DOI - PubMed
    1. Zhu J, Lam SM, Yang L, Liang J, Ding M, Shui G, et al. Reduced phosphatidylcholine synthesis suppresses the embryonic lethality of seipin deficiency. Life Metab. 2022;1:175–89. doi: 10.1093/lifemeta/loac021. - DOI

Publication types

MeSH terms

Substances

Associated data

LinkOut - more resources