. 2024 May 21;15(1):4319.
doi: 10.1038/s41467-024-48436-5.

Determinants of gastric cancer immune escape identified from non-coding immune-landscape quantitative trait loci

Affiliations

Determinants of gastric cancer immune escape identified from non-coding immune-landscape quantitative trait loci

Christos Miliotis et al. Nat Commun. .

Abstract

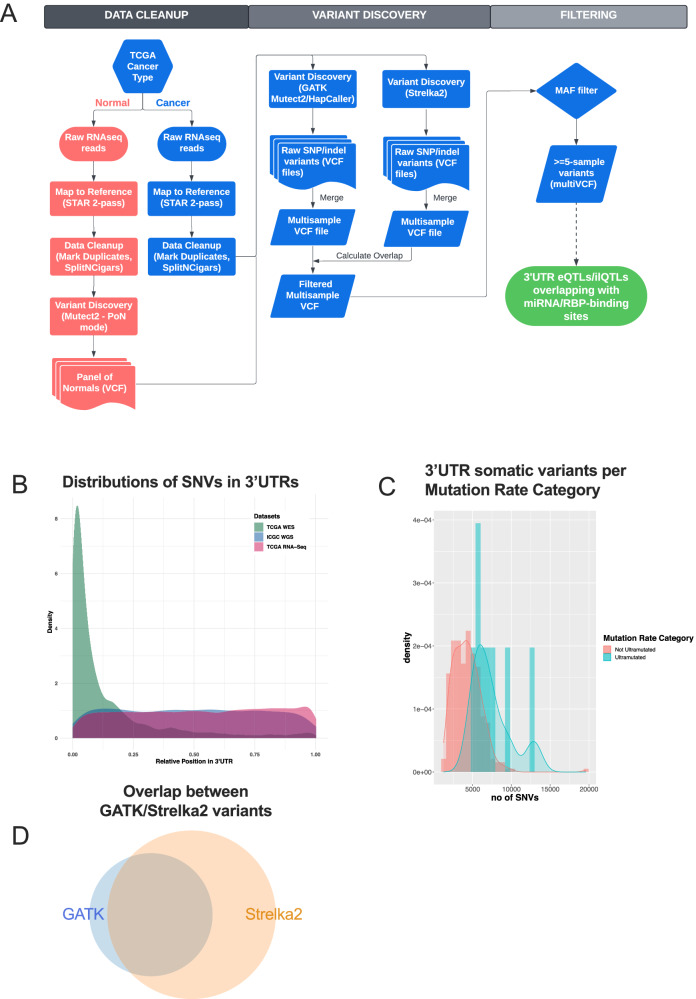
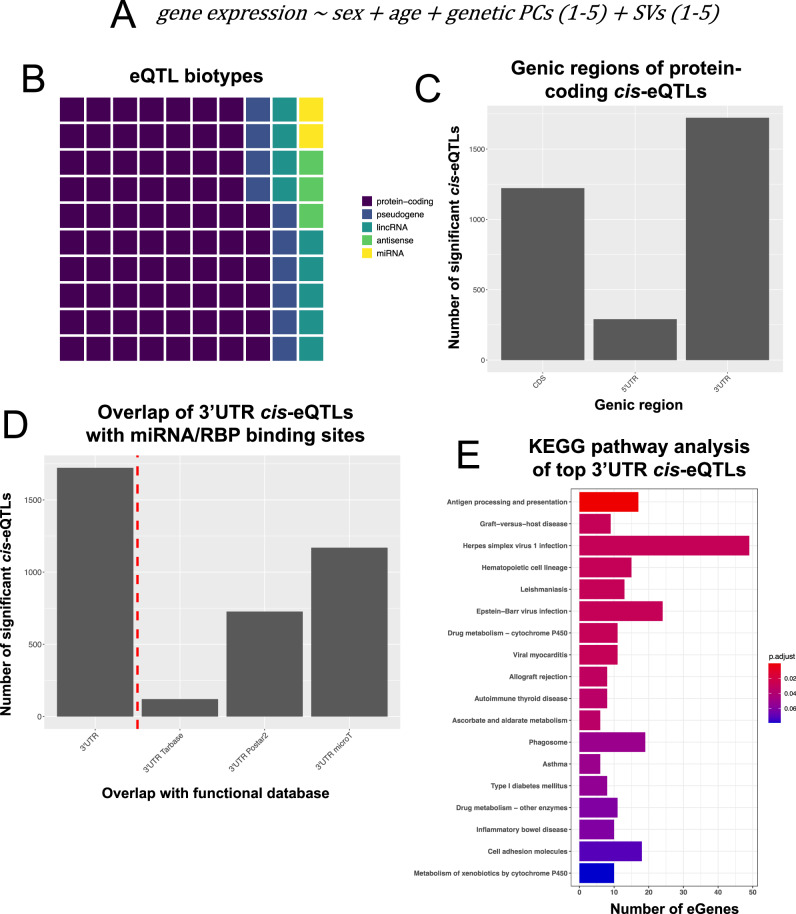
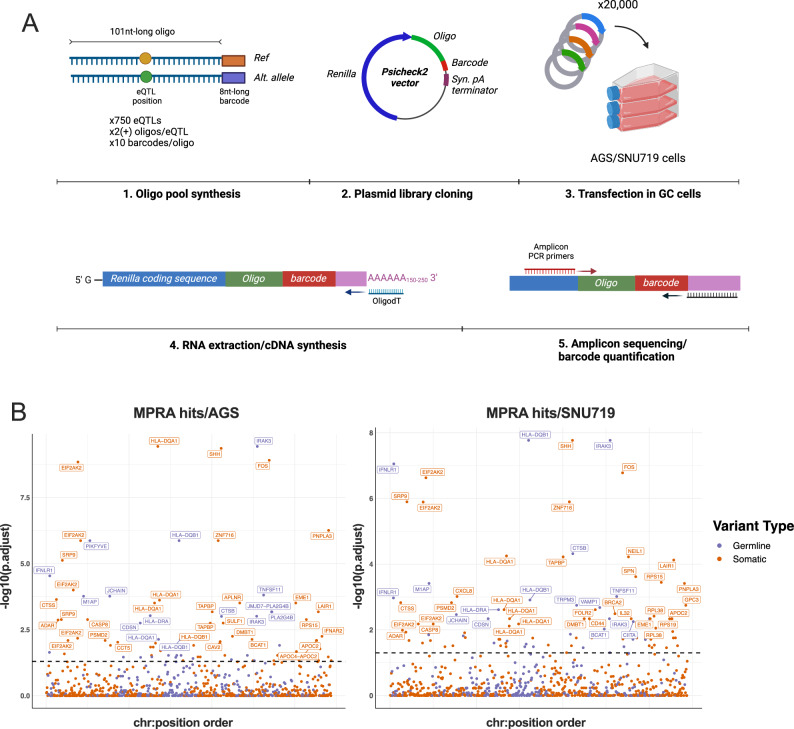
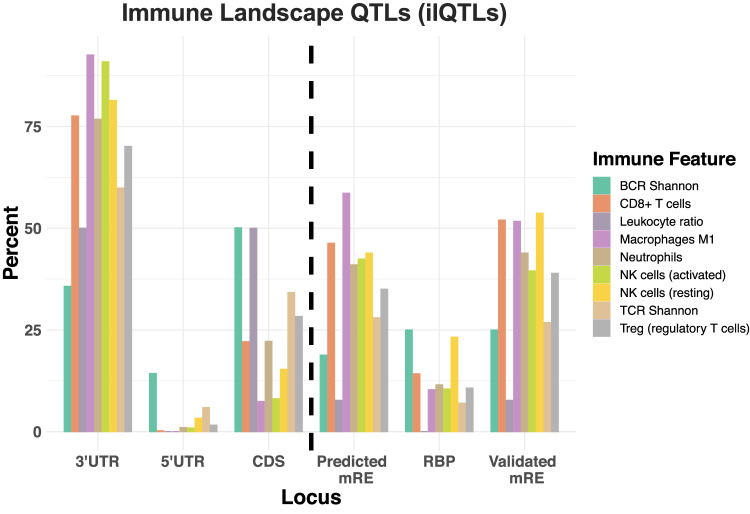
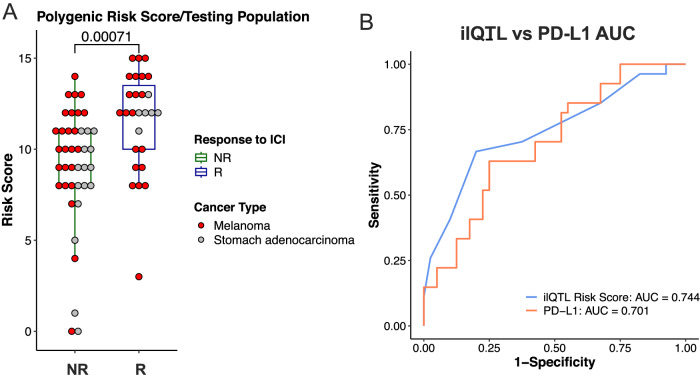
The landscape of non-coding mutations in cancer progression and immune evasion is largely unexplored. Here, we identify transcrptome-wide somatic and germline 3' untranslated region (3'-UTR) variants from 375 gastric cancer patients from The Cancer Genome Atlas. By performing gene expression quantitative trait loci (eQTL) and immune landscape QTL (ilQTL) analysis, we discover 3'-UTR variants with cis effects on expression and immune landscape phenotypes, such as immune cell infiltration and T cell receptor diversity. Using a massively parallel reporter assay, we distinguish between causal and correlative effects of 3'-UTR eQTLs in immune-related genes. Our approach identifies numerous 3'-UTR eQTLs and ilQTLs, providing a unique resource for the identification of immunotherapeutic targets and biomarkers. A prioritized ilQTL variant signature predicts response to immunotherapy better than standard-of-care PD-L1 expression in independent patient cohorts, showcasing the untapped potential of non-coding mutations in cancer.


Conflict of interest statement

I.S.V. consults for Guidepoint Global, Cowen, Mosaic, and NextRNA. Beth Israel Deaconess Medical Center has filed a patent application based on this work for “Methods and compositions related to non-coding variants for the prediction of response to cancer immunotherapy” under 63/378,392, where I.S.V., F.J.S., C.M., and E.K. are named as co-inventors. The remaining authors declare no competing interests.

Figures

Fig. 1
Fig. 1. Pipeline and quality control for identification of 3′-UTR variants in TCGA STAD cohort.
A Flowchart showing the variant-calling pipeline used for the analysis of TCGA STAD raw RNAseq data. B Distribution of the relative position of single nucleotide variant calls along the 3′-UTR as identified by analysis of TCGA WES, RNAseq and WGS data. C Number of RNAseq-derived somatic 3′-UTR single nucleotide variants per sample, grouped by “Mutation Rate Category” as defined by TCGA WES variant-calling data. D Overlap between transcriptome-wide variant calls in the analysis of RNAseq data with GATK and Strelka2 (GATK = 5,431,118, Strelka2 = 10,175,223, Overlap = 4,692,062). Figure data are provided in the Source Data file.
Fig. 2
Fig. 2. Analysis of PD-L1 3′-UTR variants in TCGA STAD.
Normalized PD-L1 expression (log2(read count+1)) in patients carrying the alternative allele (Alt) vs patients homozygous for the reference allele (Ref). For all three SNPs studied, Alt patients show higher levels of PD-L1 expression than Ref patients. Boxplot lines represent the median and upper or lower quartiles, while whiskers define the 1.5x interquartile range. Significance was assessed by two-tailed Student’s t test. rs2297136 (nAlt = 236, nRef = 139, p = 1.42e-8), rs4143815 (nAlt = 163, nRef = 212, p = 1.01e−4), rs4742098 (nAlt = 101, nRef = 274, p = 0.00173). Figure data are provided in the Source Data file. *P < 0.05, **P < 0.01, ***P < 0.001, ****P < 0.0001.
Fig. 3
Fig. 3. Identification and characterization of 3′-UTR cis-eQTLs in TCGA STAD.
A Model used for eQTL analysis. B Waffle plot showing the percentage of eQTLs that mapped to each of the indicated gene biotypes. A waffle plot consists of 100 squares and the number of colored squares represents the percentage of eQTLs mapping to each gene biotype. C Barplot showing the number of protein-coding cis-eQTLs that reside in each genic region (5′UTR, CDS or 3′-UTR). D Number of 3′-UTR cis-eQTLs that overlap with miRNA or RBP binding sites in the indicated databases. TarBase is a database of experimentally validated miRNA binding sites, microT includes predicted miRNA binding sites and POSTAR2 contains predicted RBP binding sites based on CLIP experimental  data. E KEGG pathway enrichment analysis of the 500 topmost significant 3′-UTR cis-eGenes. The X axis shows the number of eGenes that belong to the indicated pathway and the color (legend) represents the FDR-adjusted one-sided Fisher’s exact test p value for the enrichment of each gene-set. Figure data are provided in the Source Data file.
Fig. 4
Fig. 4. Massively parallel reporter assay for the characterization of 3′-UTR immune-related cis-eQTLs.
A Protocol followed for 3′-UTR MPRA assay. Ref: Reference allele, Alt. allele: Alternative allele, Syn. pA terminator: synthetic polyadenylation terminator, oligodT: primer containing 20 T nucleotides. Created with Biorender.com. B Manhattan plot showing the top hits from the MPRA assay in both gastric cancer cell lines. A two-sided Wilcoxon rank sum test was used to calculate p value of enrichment of alternative vs reference alleles and multiple comparison adjustment was performed by FDR. The black line (p. adj. = 0.05) separates significant from non-significant calls. Blue dots represent likely germline variants, while red dots represent likely somatic variants. Figure data are provided in the Source Data file.
Fig. 5
Fig. 5. Identification and characterization of 3′-UTR immune-related ilQTLs in TCGA STAD.
Left-hand side of dashed black line: distribution of significant ilQTLs along genic regions (5′UTR, CDS or 3′-UTR), showing enrichment in 3′-UTR variants. Right-hand side of dashed line: overlap of 3′-UTR ilQTLs with databases for miRNA response elements (mRE) and RBP binding sites. Figure data are provided in the Source Data file.
Fig. 6
Fig. 6. Identification of causal 3′-UTR eQTLs and ilQTLs in ADAR.
A Plot showing the distribution of CDS and 3′-UTR eQTLs and ilQTLs for the ADAR gene. The y-axis represents the nominal eQTL p value for each variant. The exon where the 3′-UTR is found is colored orange. B A cohort of gastric cancer and melanoma patients was classified into responders (R, n = 80) vs non-responders (NR, n = 55) according to response efficacy with anti-PD-1 immunotherapy. Primary cancer RNAseq data from these patients were analyzed. Differential gene expression analysis revealed increased expression of ADAR in R compared to NR (two-sided Wilcoxon rank sum test, Benjamini Hochberg FDR correction). Boxplot lines represent the median and upper or lower quartiles, while upper whiskers represent the max and min. Gastric and Melanoma cancer types are colored with grey and red, respectively. C Correlation analysis between ADAR and TARDBP log2 TPM normalized expression performed using TIMER v2.0 (timer.cistrome.org). Data from 415 STAD patients are included and the Spearman’s correlation coefficient (rho) and p value are reported. A linear regression line is shown in blue; the gray shaded area represents the standard error of the regression. Figure data are provided in the Source Data file.
Fig. 7
Fig. 7. ilQTL polygenic risk score for predicting response to immunotherapy in melanoma and gastric cancer patients.
A Comparison of the polygenic risk score (PRS) distribution in the non-responder (NR, n = 40) and responder (R, n = 27) groups of the testing population (two-sided, Wilcoxon rank sum test, Benjamini–Hochberg FDR correction). Boxplot lines represent the median and upper or lower quartiles, while upper whiskers represent the max and min. Gastric and Melanoma cancer types are colored with grey and red, respectively. B A receiver operator characteristic (ROC) curve showing the ability of the PRS score and PD-L1 expression classifications to distinguish between R and NR patients in the testing population. An Area Under the Curve (AUC) score is reported for both classifiers. Figure data are provided in the Source Data file.

Similar articles

Cited by

References

    1. Hanahan D, Weinberg RA. Hallmarks of cancer: the next generation. Cell. 2011;144:646–674. doi: 10.1016/j.cell.2011.02.013. - DOI - PubMed
    1. Waldman AD, Fritz JM, Lenardo MJ. A guide to cancer immunotherapy: from T cell basic science to clinical practice. Nat. Rev. Immunol. 2020;20:651–668. doi: 10.1038/s41577-020-0306-5. - DOI - PMC - PubMed
    1. Brar G, Shah MA. The role of pembrolizumab in the treatment of PD-L1 expressing gastric and gastroesophageal junction adenocarcinoma. Ther. Adv. Gastroenterol. 2019;12:1756284819869767. doi: 10.1177/1756284819869767. - DOI - PMC - PubMed
    1. Fashoyin-Aje L, et al. FDA approval summary: pembrolizumab for recurrent locally advanced or metastatic gastric or gastroesophageal junction adenocarcinoma expressing PD-L1. Oncologist. 2019;24:103–109. doi: 10.1634/theoncologist.2018-0221. - DOI - PMC - PubMed
    1. Sharma P, Hu-Lieskovan S, Wargo JA, Ribas A. Primary, adaptive, and acquired resistance to cancer immunotherapy. Cell. 2017;168:707–723. doi: 10.1016/j.cell.2017.01.017. - DOI - PMC - PubMed

Substances