. 2024 May 21;15(1):4316.
doi: 10.1038/s41467-024-48639-w.

Ciliary tip actin dynamics regulate photoreceptor outer segment integrity

Affiliations

Ciliary tip actin dynamics regulate photoreceptor outer segment integrity

Roly Megaw et al. Nat Commun. .

Abstract

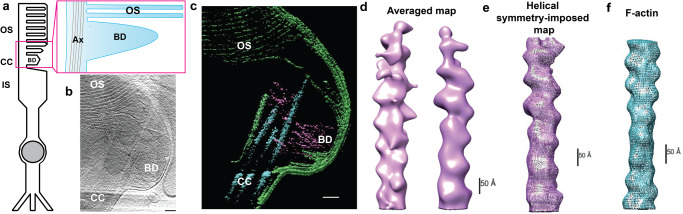
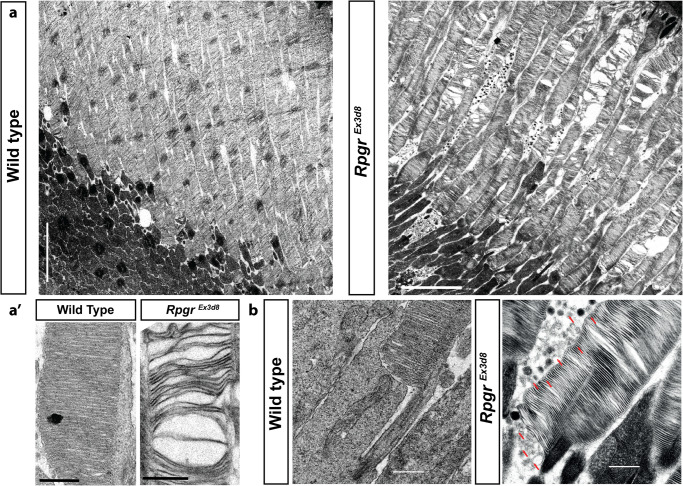
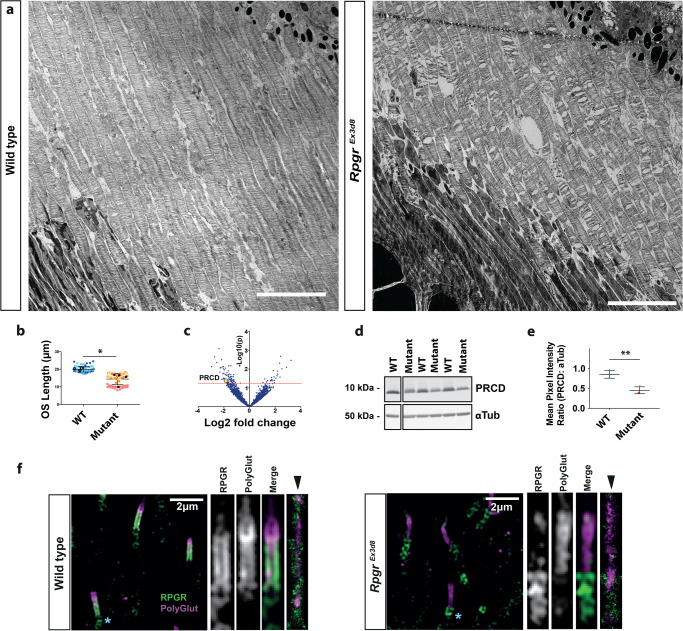
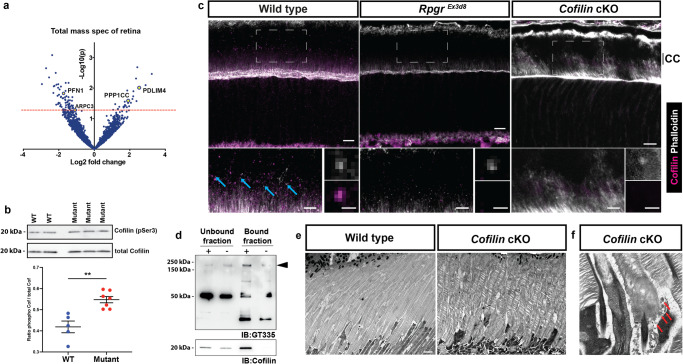
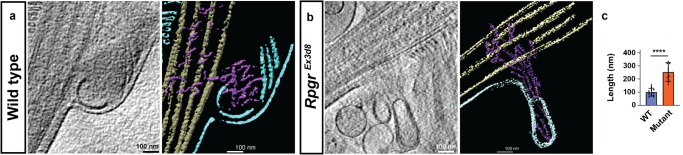
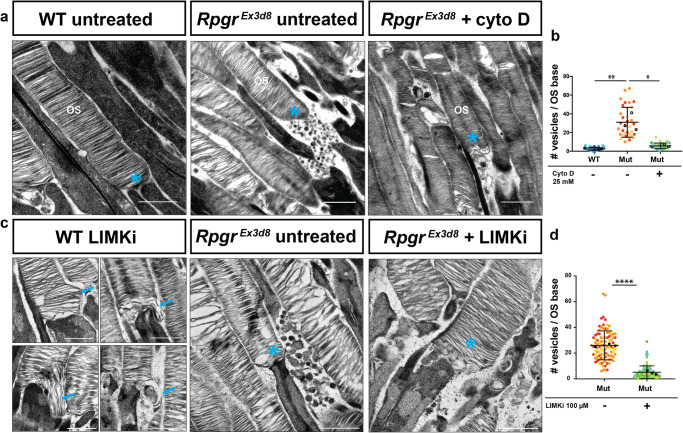
As signalling organelles, cilia regulate their G protein-coupled receptor content by ectocytosis, a process requiring localised actin dynamics to alter membrane shape. Photoreceptor outer segments comprise an expanse of folded membranes (discs) at the tip of highly-specialised connecting cilia, into which photosensitive GPCRs are concentrated. Discs are shed and remade daily. Defects in this process, due to mutations, cause retinitis pigmentosa (RP). Whilst fundamental for vision, the mechanism of photoreceptor disc generation is poorly understood. Here, we show membrane deformation required for disc genesis is driven by dynamic actin changes in a process akin to ectocytosis. We show RPGR, a leading RP gene, regulates actin-binding protein activity central to this process. Actin dynamics, required for disc formation, are perturbed in Rpgr mouse models, leading to aborted membrane shedding as ectosome-like vesicles, photoreceptor death and visual loss. Actin manipulation partially rescues this, suggesting the pathway could be targeted therapeutically. These findings help define how actin-mediated dynamics control outer segment turnover.


Conflict of interest statement

The authors declare no competing interests.

Figures

Fig. 1
Fig. 1. Photoreceptor disc formation is an actin-driven process.
a Schematic of a rod photoreceptor depicts the cell’s inner segment (IS) with the highly modified connecting cilium (CC) extending from its apex, containing a microtubule-based axoneme (Ax). From here an expanse of folded membrane extends, forming the outer segment (OS) discs. Basal discs (BD) are continually added at its base. b A projection from a tomogram of the basal disc of a wild-type photoreceptor. c A slice through a tomographic reconstruction, segmented to highlight the ciliary and disc membranes (green), microtubule-based axoneme (cyan) and microfilaments (purple). Microfilaments extend from the connecting cilium into the basal disc. d Front and back views of a subtomogram averaged map of microfilaments extending into the BD, with helical symmetry-imposed map (e). f Previously published structure of F-actin (EMBD-6448), highlighting 166.67 degree twist per molecule and 27.8 Å rise per molecule. (Scale bars; b, c = 100 nm; df = 50 Å) (Similar results were seen in 6 independent experiments, each pooling results from 9 to 32 eyes (8–16 mice) and 4–12 tomograms).
Fig. 2
Fig. 2. Mutations in Rpgr lead to early structural compromise of photoreceptor outer segments (OS).
a Transmission electron micrograph of 6 week old wild-type photoreceptors show OS composed of compacted discs extending to the underlying retinal pigment epithelium (RPE) (left panel). Disc compaction is compromised in age-matched mutant photoreceptors, with discs appearing split and spaced out (right panel). a’ Higher magnification examples. b Examination of basal discs at OS base shows compacted discs but an accumulation of shed vesicles (red arrows) in RpgrEx3d8 mice. (Scale bars; a = 5 μm; b = 0.5 μm). (Similar results seen in > 10 experiments repeated independently).
Fig. 3
Fig. 3. Loss of Rpgr leads to shortened photoreceptor outer segments (OS).
a Transmission electron micrograph of 6 week wild type and RpgrEx3d8 photoreceptors show OS are shorter in RpgrEx3d8 mice. b Quantification of OS length. Different colours represent measurements from individual mice. Mean OS length measurement of each experimental animal denoted by black circles (WT) and black squares (mutant); N = 3 animals per genotype; *, p = 0.0405; two-tailed, unpaired t-test; error bars denote SEM. c Mass spectrometry comparing protein composition of wild type versus RpgrEx3d8 3 month old retinas shows reduced expression of the outer segment protein PRCD in mutant mice. Red line denotes cut-off p value for significance (two-tailed, unpaired t-test, not corrected for multiple hypothesis testing). d Immunoblotting of whole retina lysates confirms reduced PRCD in mutant mice, in keeping with reduced outer segment lengths. e Quantification of intensity of PRCD relative to loading control α-tubulin; N = 3 animals per group; *p = 0.0062; two-tailed, unpaired t-test). Data presented as mean values +/− SEM. f Left panel: Localisation of RPGR’s retinal-specific isoform throughout the length of the photoreceptor connecting cilium, as evidenced by SIM imaging, showing co-localisation with polyglutamylated tubulin in wild type photoreceptors, which extends the length of the connecting cilium and into the OS. (Similar results seen in 4 independent experiments using separate animals). RPGR localizes to the ciliary membrane by STORM imaging (rightmost panel, arrowhead; similar results seen in 3 independent experiments). Right panel: RpgrEx3d8 photoreceptors show loss of RPGR staining at the connecting cilium. (NB. green staining below polyglutamylation labelling (see blue *) represents non-specific centrosomal staining; a common occurrence with rabbit polyclonal antibodies) (Scale bars; a = 5 μm; f = 2 μm). Source data provided as a Source Data file.
Fig. 4
Fig. 4. RPGR binds and regulates activity of the actin-severing protein cofilin.
a Mass spectrometry analysis of RpgrEx3d8 retina shows dysregulation of actin regulators (PFN1, PDLIM4, PPP1CC labelled in yellow; two-tailed, unpaired t-test, not corrected for multiple hypothesis testing). b Representative immunoblotting shows cofilin hyperphosphorylation at serine 3 (and therefore reduced activity) (y axis denotes phospho-cofilin:total cofilin ratio; N = 5 control animals, 7 mutant animals; **p = 0.0013; two-tailed, unpaired t-test; error bars denote SEM). c Immunohistochemistry shows cofilin localisation to photoreceptor connecting cilium (CC) in wild-type retinas, partially lost in RpgrEx3d8 mice, not seen in Cofilin knockout mice. White boxes define regions of interest depicted in bottom left panels (blue arrows highlight CC cofilin in wild type retina). Enlarged images (bottom right panels) highlight cofilin colocalization with CC actin in wild type photoreceptors. (Similar results seen in 2 independent experiments using separate animals). d Immunoprecipitation of wild type retinal lysates using magnetic beads coated (+) or uncoated (-) with cofilin antibody shows cofilin enrichment in bound fraction (bottom panel) and RPGR’s retinal specific isoform, detected using GT335 antibody (black arrowhead, top panel; 52 kDa band is acetylated tubulin, bands at 50 kDa and 25 kDa are immunoglobulins). e Transmission electron micrograph of 8-week wild-type photoreceptors show OS composed of compacted discs extending to underlying retinal pigment epithelium (RPE) (left panel). Disc compaction is compromised in age-matched, Cofilin knockout photoreceptors, with discs appearing split and spaced out (right panel; similar results seen in 3 independent experiments). f Examination of basal discs shows an accumulation of shed vesicles (red arrow) in Cofilin knockout mice. (Scale bars; c = 10 µm top panels; 5 µm bottom left panels; 0.5 µm bottom right panels; e = 2 µm; f = 1 µm). Source data provided as Source Data file.
Fig. 5
Fig. 5. Loss of Rpgr hyperstabilises actin in the basal photoreceptor disc.
a, b A projection from a tomogram (left panel) and a slice through a tomographic reconstruction (right panel) of the basal disc of a wild type (a) and RpgrEx3d8 (b) photoreceptor to highlight the ciliary and disc membranes (cyan), microtubule-based axoneme (tan) and actin filaments (purple). c Actin filament length quantification in the basal disc of photoreceptor tomograms (N = 4 animals per group; ****p ≤ 0.0001; two-tailed, unpaired t-test; error bars denote SEM). (Scale bars; a, b = 100 nm). Source data are provided as a Source Data file.
Fig. 6
Fig. 6. Targeting actin severing pathways rescues shedding of vesicles from Rpgr-mutant photoreceptors.
a TEM reveals high numbers of vesicles shed from OS bases in RpgrEx3d8 photoreceptors (middle panel) compared to controls (left panel). Shedding of vesicles is reduced upon intravitreal delivery of 25 mM cytochalasin D for 6 h (right panel) (OS = Outer Segment; cyan * = OS base). b Quantification of vesicle shedding at the base of photoreceptors by TEM. (Black symbols = mean number of vesicles at the base of each photoreceptor per experimental animal; N = 3 animals per genotype; error bars represent standard error of the mean; **p = 0.0068, *p = 0.0108; two-tailed, unpaired t-test; error bars denote SEM. Different colours represent measurements from individual mice). c TEM reveals intravitreal delivery of 100 μM LIM kinase inhibitor for 6 h to wild-type retinas leads to elongation of basal discs (blue arrows, left panel). Intravitreal LIMKi delivery to RpgrEx3d8 eyes reduces number of OS shed vesicles (middle and right panels; cyan * = OS base). d Quantification of vesicle shedding by control or LIMKi treatment from TEM images. (Black symbols = mean number of vesicles at OS base of photoreceptors per experimental animal; N = 3 animals per genotype; error bars represent standard error of the mean; ****p ≤ 0.0001; two-tailed, unpaired t-test; error bars denote SEM. Different colours represent measurements from individual mice). (Scale bars; a = 1 µm; c = 500 nm for 4 left panels of wild type treated photoreceptors; 1 µm for middle and right RpgrEx3d8 panels). Source data are provided as a Source Data file.

References

    1. Nachury MV, Mick DU. Establishing and regulating the composition of cilia for signal transduction. Nat. Rev. Mol. Cell Biol. 2019;20:389–405. doi: 10.1038/s41580-019-0116-4. - DOI - PMC - PubMed
    1. Phua SC, et al. Dynamic Remodeling of Membrane Composition Drives Cell Cycle through Primary Cilia Excision. Cell. 2017;168:264–279.e15. doi: 10.1016/j.cell.2016.12.032. - DOI - PMC - PubMed
    1. Nager AR, et al. An Actin Network Dispatches Ciliary GPCRs into Extracellular Vesicles to Modulate Signaling. Cell. 2017;168:252–263.e14. doi: 10.1016/j.cell.2016.11.036. - DOI - PMC - PubMed
    1. Papermaster DS, Schneider BG, Besharse JC. Vesicular transport of newly synthesized opsin from the Golgi apparatus toward the rod outer segment. Ultrastructural immunocytochemical and autoradiographic evidence in Xenopus retinas. Invest. Ophthalmol. Vis. Sci. 1985;26:1386–1404. - PubMed
    1. Deretic D, Papermaster DS. Polarized sorting of rhodopsin on post-Golgi membranes in frog retinal photoreceptor cells. J. Cell Biol. 1991;113:1281–1293. doi: 10.1083/jcb.113.6.1281. - DOI - PMC - PubMed

LinkOut - more resources