. 2024 May 21;15(1):4347.
doi: 10.1038/s41467-024-48730-2.

Astrocytic ALKBH5 in stress response contributes to depressive-like behaviors in mice

Affiliations

Astrocytic ALKBH5 in stress response contributes to depressive-like behaviors in mice

Fang Guo et al. Nat Commun. .

Abstract

Epigenetic mechanisms bridge genetic and environmental factors that contribute to the pathogenesis of major depression disorder (MDD). However, the cellular specificity and sensitivity of environmental stress on brain epitranscriptomics and its impact on depression remain unclear. Here, we found that ALKBH5, an RNA demethylase of N6-methyladenosine (m6A), was increased in MDD patients' blood and depression models. ALKBH5 in astrocytes was more sensitive to stress than that in neurons and endothelial cells. Selective deletion of ALKBH5 in astrocytes, but not in neurons and endothelial cells, produced antidepressant-like behaviors. Astrocytic ALKBH5 in the mPFC regulated depression-related behaviors bidirectionally. Meanwhile, ALKBH5 modulated glutamate transporter-1 (GLT-1) m6A modification and increased the expression of GLT-1 in astrocytes. ALKBH5 astrocyte-specific knockout preserved stress-induced disruption of glutamatergic synaptic transmission, neuronal atrophy and defective Ca2+ activity. Moreover, enhanced m6A modification with S-adenosylmethionine (SAMe) produced antidepressant-like effects. Our findings indicate that astrocytic epitranscriptomics contribute to depressive-like behaviors and that astrocytic ALKBH5 may be a therapeutic target for depression.


Conflict of interest statement

The authors declare no competing interests.

Figures

Fig. 1
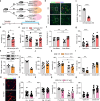
Fig. 1. ALKBH5 expression is upregulated in MDD patients and mouse depression models.
a Real-time quantitative PCR (qRT-PCR) analysis of the genes encoding m6A-modifying enzymes in the peripheral blood of MDD patients and healthy individuals (Ctrl). (Ctrl, n = 36; MDD, n = 30 participants). b Gene expression (logFC) in the dlPFC of MDD compared with linear regression. c qRT-PCR analysis of the genes encoding m6A-modifying enzymes in the peripheral blood of Sus, Res, and Ctrl mice. (n = 6 mice per group). d qRT-PCR analysis of the genes encoding m6A-modifying enzymes in the mPFC of Sus, Res, and Ctrl mice. (n = 6 mice per group). e Several patterns of gene expression correlated with the SI ratio. (n = 6 mice per group). f ALKBH5 protein in the mPFC of mice after CSDS. (Ctrl, n = 8; Sus, n = 6; Res, n = 6 mice). g Quantification of m6A levels in mRNA of the mPFC of Sus, Res, and Ctrl mice. (n = 6 mice per group). h ALKBH5 protein in the mPFC of mice with LPS-induced depression. (n = 6 mice per group). i, j Western blotting analysis of ALKBH5 protein in the primary cultured astrocytes (DIV8), neurons (DIV14) and endothelial cell line (bEnd3) treated with DXMS (0, 0.5, 1, and 5 μM) (i) or LPS (0, 0.5, 1, and 5 μg mL−1) (j) for 4 h. (i, j, n = 6 wells per group). Data were presented as the mean ± SEM. Two-sided unpaired t-test (a, h) or one-way ANOVA followed by Bonferroni’s test for multiple comparisons test (c, d, f, g, i, j). Two-tailed Fisher’s exact test and FDR corrected p < 0.05 were considered significant (b). *p < 0.05; **p < 0.01; ***p < 0.001; n.s. no significance. Source data are provided as a Source Data file. See Supplementary Data 4 for statistical details.
Fig. 2
Fig. 2. Astrocyte-specific knockout of ALKBH5 induces antidepressant-like behaviors.
a Genetic crosses used to delete the ALKBH5 of astrocytes, neurons, and endothelial cells from the whole brain and a schematic representation of the behavioral tests. b, c Representative images (red, ALKBH5; green, S100β) (b) and quantification of the ALKBH5 positive astrocytes (c) of Astrocyte cKO and Ctrl mice, Scale bar = 20 μm. (n = 6 mice per group). d, j, o Immobility time in the FST. (d Astrocyte cKO, n = 12; Ctrl, n = 11 mice; j Neuron cKO, n = 11; Ctrl, n = 9 mice; o EC cKO, n = 22; Ctrl, n = 19 mice). e, k, p Time spent in the interaction zone before and after CSDS. (e Astrocyte cKO, n = 11; Ctrl, n = 12 mice; k Neuron cKO, n = 7; Ctrl, n = 8 mice; p EC cKO, n = 9; Ctrl, n = 7 mice). f Sucrose preference for Astrocyte cKO and Ctrl mice in the SPT. (Astrocyte cKO, n = 7; Ctrl, n = 9 mice). g, l, q Time spent in the open arms and closed arms in the EPM. (g Astrocyte cKO, n = 12; Ctrl, n = 12 mice; l Neuron cKO, n = 8; Ctrl, n = 11 mice; q EC cKO, n = 22; Ctrl, n = 19 mice). h Western blotting analysis of the ALKBH5 in the mPFC of Neuron cKO mice. (Neuron cKO, n = 7; Ctrl, n = 6 mice). i Quantification of the ALKBH5 positive neurons of Neuron cKO and Ctrl mice, Scale bar = 20 μm. (n = 6 mice per group). m, n Representative images and quantification of the ALKBH5 positive endothelial cells (red, Cdh5; green, ALKBH5) of EC cKO and Ctrl mice, Scale bar = 20 μm. (n = 25 slices from 4 mice per group). All data were presented as the mean ± SEM. Two-sided unpaired t-test (c, d, gj, l, n, o, q) or Two-way ANOVA with Bonferroni’s multiple comparisons test (e, f, k, p). *p < 0.05; **p < 0.01; ***p < 0.001; n.s. no significance. Source data are provided as a Source Data file. See Supplementary Data 4 for statistical details.
Fig. 3
Fig. 3. Astrocyte-specific gain and loss of ALKBH5 in the mPFC mediates depression-related behaviors.
a, i Schematic of experimental paradigm. b Representative images of AAV-gfaABC1D-GFP-iCre expression in the mPFC of Alkbh5loxP/loxP mice (green, EGFP; red, S100β). Scale bars = 500 μm (left), 20 μm (right). (n = 6 replicates from three mice). c Western blotting analysis of ALKBH5 in the mPFC of GFAP△Alkbh5 and Ctrl mice. (n = 6 mice per group). dh Statistics analysis of the GFAP△Alkbh5 and Ctrl mice in FST (d), SI test (e), EPM (f), OFT (g), and LD (h). (d, fh Ctrl, n = 11; GFAP△Alkbh5 n = 12 mice; e Ctrl, n = 12; GFAP△Alkbh5, n = 11 mice). j Representative images of the AAV-DIO-ALKBH5 expression in the mPFC of Fgfr3-iCreERT2 mice. Scale bars = 500 μm (left), 20 μm (right). (n = 6 replicates from three mice). k Western blotting analysis of the ALKBH5 in the mPFC of ALKBH5 OE mice. (n = 5 mice per group). lp Statistics analysis of OE-Alkbh5 and Ctrl mice in FST (l OE, n = 10; Ctrl, n = 11 mice); SI test (m OE, n = 11; Ctrl, n = 8 mice); EPM (n), OFT (o), and LD (p), (np, OE, n = 11; Ctrl, n = 10 mice). qu Statistical analysis of Astrocyte cKO mice that injected with AAV-DIO-ALKBH5 or AAV-DIO-eGFP in FST (q Cre-Ctrl, n = 10; cKO-Ctrl, n = 10; cKO-OE, n = 10 mice); SI test (r Cre-Ctrl, n = 8; cKO-Ctrl, n = 15; cKO-OE, n = 14 mice); EPM (s Cre-Ctrl, n = 9; cKO-Ctrl, n = 10; cKO-OE, n = 9 mice); OFT (t Cre-Ctrl, n = 10; cKO-Ctrl, n = 10; cKO-OE, n = 9 mice); LD (u Cre-Ctrl, n = 10; cKO-Ctrl, n = 10; cKO-OE, n = 8 mice). All data were presented with the mean ± SEM. Two-sided unpaired t-test (c, d, fh, k, l, np) or one-way ANOVA followed by Bonferroni’s test for multiple comparisons (q, su), and two-way ANOVA with Bonferroni’s multiple comparisons test (e, m, r). *p < 0.05; **p < 0.01; ***p < 0.001; n.s. no significance. Source data are provided as a Source Data file. See Supplementary Data 4 for statistical details.
Fig. 4
Fig. 4. Astrocytic ALKBH5 deletion increases m6A levels and alters mPFC epitranscriptome.
a Transcriptome-wide distribution of m6A peaks of control samples. b Number and percent of m6A peaks. c Consensus motif of m6A sites identified in m6A peaks of control samples. d Volcano diagram showing overlap of genes with significant changes in mRNA expression in the Astrocyte cKO mice and Ctrl. e Clustering and heatmaps showing mRNA levels in the mPFC Astrocyte cKO and Ctrl mice. Relative mRNA expression level is represented in color. Only m6A genes with enrichment fold >1 in controls and significant differences in mRNA expression between the experimental and control groups. f GO analysis of mRNAs with reads per kilobase of transcript, per million mapped reads (RPKM) ratio <1 and p < 0.05. g KEGG analysis with FC >1 and p < 0.05. h m6A modification on SLC1A2 gene. Two-tailed Fisher’s exact test and FDR corrected p < 0.05 were considered significant (dg). Two-sided Fisher’s exact test with adjustments for multiple testing (c). See Supplementary Data 4 for statistical details.
Fig. 5
Fig. 5. Astrocytic ALKBH5 modulates glutamate levels through methylation modification of GLT-1.
a Targets to specifically alter m6A modification sites of GLT-1. b Dual-luciferase reporter constructs with the psiCHECK-2 vector contain Renilla luciferase and firefly luciferase driven by two different promoters. The effects of GLT-1 m6A were examined by transfection of a dual-luciferase reporter. (n = 4 biological replicates). c For single-base editing to construct and cotransfect dCas9-mCherry and sgRNA-puro-eGFP into mixed primary cultured astrocytes and representative images. Scale bars = 20 μm (right). (n = 6 replicates from three wells). d Western blotting analysis of ALKBH5 of sgRNA and Ctrl group. (n = 7 wells per group). e Glutamate uptake ability in the medium of astrocytes transfected with sgRNA and Ctrl plasmids. (n = 3 wells per group). f Western blotting analysis of ALKBH5 and GLT-1 in Alkbh5loxP/loxP astrocytes infected pLent-GFAP-Cre virus (cKO) and Ctrl virus. (n = 4 wells per group). g Glutamate uptake ability in the medium of cKO and Ctrl astrocytes. (n = 6 mice per group). h Western blotting analysis of GLT-1 in the mPFC of astrocyte cKO and Ctrl mice. (n = 8 mice per group). i, j Schematic illustrating fiber placement and representative images of AAV-Syn-iGluSnFR(A184S) expression. Scale bars = 500 μm (left), 20 μm (right). (n = 6 replicates from three mice). k Representative heatmaps of z-scores changes over all trials from single mice. Each row plots one trial, and a total of four trials are illustrated. l, m Time course of average iGluSnFR transient z-scores event locked to social interaction (l) and peak z-score (m) during social interaction. (Astrocyte cKO, n = 5; Ctrl, n = 7 mice). n, o Statistical analysis of GFAP△Alkbh5 mice injected with AAV-shRNA(GLT-1) or AAV-mCherry in FST (n n = 6 mice per group); SI test (o Ctrl, n = 6; GFAP△Alkbh5, n = 8; GFAP△Alkbh5-shGLT-1, n = 7 mice). All data were presented as the mean ± SEM. Two-sided unpaired t-test (dh) or one-way ANOVA followed by Bonferroni’s test for multiple comparisons (b, n), or two-way ANOVA (m, o) with Bonferroni’s multiple comparisons test. *p < 0.05; ***p < 0.001; ***p < 0.001; n.s. no significance. Source data are provided as a Source Data file. See Supplementary Data 4 for statistical details.
Fig. 6
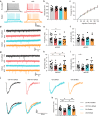
Fig. 6. Knockout of astrocytic ALKBH5 prevents the disruption of glutamatergic synaptic transmission from social stress.
a Representative traces of action potentials measured by whole-cell current-clamp recordings from mPFC layer IV-V pyramidal neurons of Ctrl and Astrocyte cKO mice with or without the CSDS experiments. Representative voltage traces in neurons showing the effects of a series of 500 ms current pulses ranging from 0 to 120 pA in 20 pA steps. b, c Quantification of the amplitude of action potentials currents (b Ctrl, n = 12; Astrocyte cKO, n = 20 cells from four individual mice) and Summarized results of firing rate under increasing step currents (c Ctrl, n = 12; Astrocyte cKO, n = 21 cells from four individual mice) of pyramidal neurons from Ctrl and Astrocyte cKO mice with or without the CSDS paradigm. d Representative traces of sEPSCs recorded from mPFC neurons from Ctrl and Astrocyte cKO mice with or without the CSDS. e, f Quantification of sEPSCs frequency (e) and amplitude (f). (Ctrl Non-defeat, n = 17; cKO Non-defeat, n = 16; Ctrl Defeat, n = 12; cKO Defeat, n = 11 cells from four individual mice). g Representative traces of mEPSCs recorded from mPFC neurons from Ctrl and Astrocyte cKO mice with or without the CSDS. h, i Quantification of mEPSC frequency (h) and amplitudes (i). (Ctrl Non-defeat, n = 13 in (h), n = 12 in (j); cKO Non-defeat, n = 21; Ctrl Defeat, n = 13; cKO Defeat, n = 18 cells from four individual mice). j Representative traces of mean individual mEPSCs from Ctrl and Astrocyte cKO mice with or without the CSDS. k Quantification mean value of mEPSC decay time. (Ctrl Non-defeat, n = 18; cKO Non-defeat, n = 15; Ctrl Defeat, n = 17; cKO Defeat, n = 18 cells from four individual mice). All data were presented as the mean ± SEM. Two-way ANOVA with Bonferroni’s multiple comparisons test (b, c, e, f, h, i, k). *p < 0.05; ***p < 0.001; n.s. no significance. Source data are provided as a Source Data file. See Supplementary Data 4 for statistical details.
Fig. 7
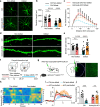
Fig. 7. Astrocytic ALKBH5 preserves neuronal morphology and Ca2+ activity under social stress.
ac Representative confocal images showing that pyramidal neurons infected with AAV-fDIO-EGFP and AAV-FLP (a), quantification of total dendrite length (b), and Sholl analysis (c) in the mPFC of Astrocyte cKO or Ctrl mice after CSDS paradigm. Scale bar = 20 μm. (Ctrl Non-defeat, n = 24; cKO Non-defeat, n = 22; Ctrl Defeat, n = 31; cKO Defeat, n = 20 cells from six individual mice). d, e Representative images of dendritic segments (d), quantification of total spine density (e). Scale bar = 5 μm. (Ctrl Non-defeat, n = 23; cKO Non-defeat, n = 22; Ctrl Defeat, n = 29; cKO Defeat, n = 19 cells from six individual mice). f Schematic illustrating fiber photometry. g Schematic illustrating fiber placement and representative images of GCamp6s expression. Scale bars = 500 μm (left), 20 μm (right). (n = 6 replicates from three mice). h Representative heatmaps of GCaMP6s transient z-scores event locked to social interaction. Each row plots one trial, and a total of four trials are illustrated. i, j Average and peak z-score changes during social interaction. (Astrocyte cKO, n = 7; Ctrl, n = 9 mice). All data were presented as the mean ± SEM. Two-way ANOVA with Bonferroni’s multiple comparisons test (b, c, e, i, j). *p < 0.05; **p < 0.01; ***p < 0.001; ****p < 0.0001 and n.s. no significance. Source data are provided as a Source Data file. See Supplementary Data 4 for statistical details.
Fig. 8
Fig. 8. SAMe produces antidepressant-like behaviors.
a Model of the SAMe function in m6A modification. b ELISA analysis of SAMe levels in the plasma of MDD patients and healthy individuals. (Ctrl, n = 21; MDD, n = 69 samples). c SAMe levels in the plasma of the mice with LPS-induced depression. (n = 6 mice per group). d, e SAMe levels in the mPFC of mice with LPS-induced depression (d n = 6 mice per group) and Sus, Res, and Ctrl mice after CSDS (e n = 5 mice per group). f m6A levels in the plasma of C57BL/6J mice treated with SAMe (300 μg mL−1) or vehicle. (n = 7 mice per group). g MeRIP-qPCR of GLT-1 m6A levels in the mPFC of C57BL/6J mice treated with SAMe (300 μg mL−1) or vehicle. (n = 3 mice per group). hk Statistics analysis of C57BL/6J mice treated with SAMe or vehicle in FST (1 W) (h n = 10 mice per group), FST (3 W) (i n = 12 mice per group), SI test (j Ctrl, n = 7; SAMe, n = 8 mice), EPM (k n = 10 mice per group). l Schematic of the experimental paradigm. m, n Statistics analysis of OE-Alkbh5 and Ctrl mice treated with SAMe (300 μg mL−1) or vehicle in FST (m), SI test (n). (Ctrl, n = 8; OE, n = 7; OE-SAMe, n = 7 mice). All data were presented as the mean ± SEM. Two-sided unpaired t-test (bd, fi, k), one-way (e, m, n), two-way (j) ANOVA with Bonferroni’s multiple comparisons test. *p < 0.05; **p < 0.01; n.s. no significance. Source data are provided as a Source Data file. See Supplementary Data 4 for statistical details.

References

    1. World, H.O. Depression and Other Common Mental Disorders: Global Health Estimates (World Health Organization, 2017).
    1. Kessler RC, et al. The epidemiology of major depressive disorder: results from the National Comorbidity Survey Replication (NCS-R) JAMA. 2003;289:3095–3105. doi: 10.1001/jama.289.23.3095. - DOI - PubMed
    1. Otte C, et al. Major depressive disorder. Nat. Rev. Dis. Primers. 2016;2:16065. doi: 10.1038/nrdp.2016.65. - DOI - PubMed
    1. Peña, C. J. & Nestler, E. J. Progress in epigenetics of depression. In Progress in Molecular Biology and Translational Science (ed. D. R. Grayson). Vol. 151, 41–66 (Academic Press, 2018). - PMC - PubMed
    1. Park C, et al. Stress, epigenetics and depression: a systematic review. Neurosci. Biobehav. Rev. 2019;102:139–152. doi: 10.1016/j.neubiorev.2019.04.010. - DOI - PubMed

MeSH terms