

Optimizing multi-spectral ore sorting incorporating wavelength selection utilizing neighborhood component analysis for effective arsenic mineral detection
- PMID: 38773148
- PMCID: PMC11109168
- DOI: 10.1038/s41598-024-62166-0
Optimizing multi-spectral ore sorting incorporating wavelength selection utilizing neighborhood component analysis for effective arsenic mineral detection
Abstract
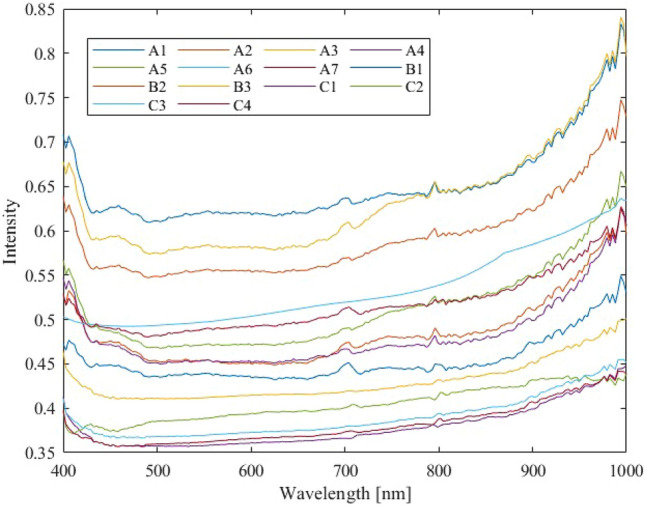
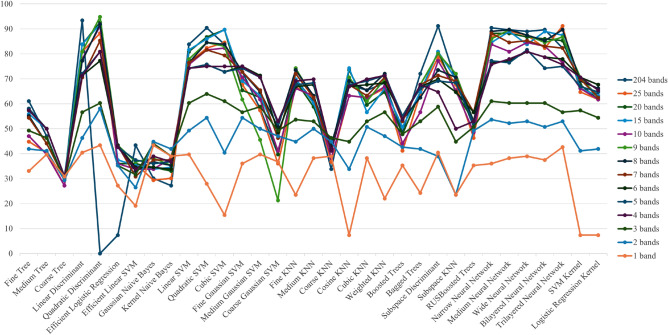
Arsenic contamination not only complicates mineral processing but also poses environmental and health risks. To address these challenges, this research investigates the feasibility of utilizing Hyperspectral imaging combined with machine learning techniques for the identification of arsenic-containing minerals in copper ore samples, with a focus on practical application in sorting and processing operations. Through experimentation with various copper sulfide ores, Neighborhood Component Analysis (NCA) was employed to select essential wavelength bands from Hyperspectral data, subsequently used as inputs for machine learning algorithms to identify arsenic concentrations. Results demonstrate that by selecting a subset of informative bands using NCA, accurate mineral identification can be achieved with a significantly reduced the size of dataset, enabling efficient processing and analysis. Comparison with other wavelength selection methods highlights the superiority of NCA in optimizing classification accuracy. Specifically, the identification accuracy showed 91.9% or more when utilizing 8 or more bands selected by NCA and was comparable to hyperspectral data analysis with 204 bands. The findings suggest potential for cost-effective implementation of multispectral cameras in mineral processing operations. Future research directions include refining machine learning algorithms, exploring broader applications across diverse ore types, and integrating hyperspectral imaging with emerging sensor technologies for enhanced mineral processing capabilities.
Keywords: Machine learning; Mineral processing; Neighborhood component analysis; Sensor-based ore sorting; System; Wavelength selection.
© 2024. The Author(s).
Conflict of interest statement
The authors declare no competing interests.
Figures


References
-
- Elshkaki A, Graedel T, Ciacci L, Change BR. Copper demand, supply, and associated energy use to 2050. Glob. Environ. Chang. 2016;39:305–315. doi: 10.1016/j.gloenvcha.2016.06.006. - DOI
-
- Pell R, et al. Towards sustainable extraction of technology materials through integrated approaches. Nat. Rev. Earth Environ. 2021;2(10):665–679. doi: 10.1038/s43017-021-00211-6. - DOI
-
- Ferreccio C, Sancha AM. Arsenic exposure and its impact on health in Chile. J. Health Popul. Nutr. 2006;24:164–175. - PubMed
-
- Okada N, Maekawa Y, Owada N, Haga K, Shibayama A, Kawamura Y. Automated identification of mineral types and grain size using hyperspectral imaging and deep learning for mineral processing. Minerals. 2020 doi: 10.3390/min10090809. - DOI
Grants and funding
LinkOut - more resources
Full Text Sources
