. 2024 May 21;15(1):4324.
doi: 10.1038/s41467-024-48681-8.

Electrostatic-induced ion-confined partitioning in graphene nanolaminate membrane for breaking anion-cation co-transport to enhance desalination

Affiliations

Electrostatic-induced ion-confined partitioning in graphene nanolaminate membrane for breaking anion-cation co-transport to enhance desalination

Haiguang Zhang et al. Nat Commun. .

Abstract

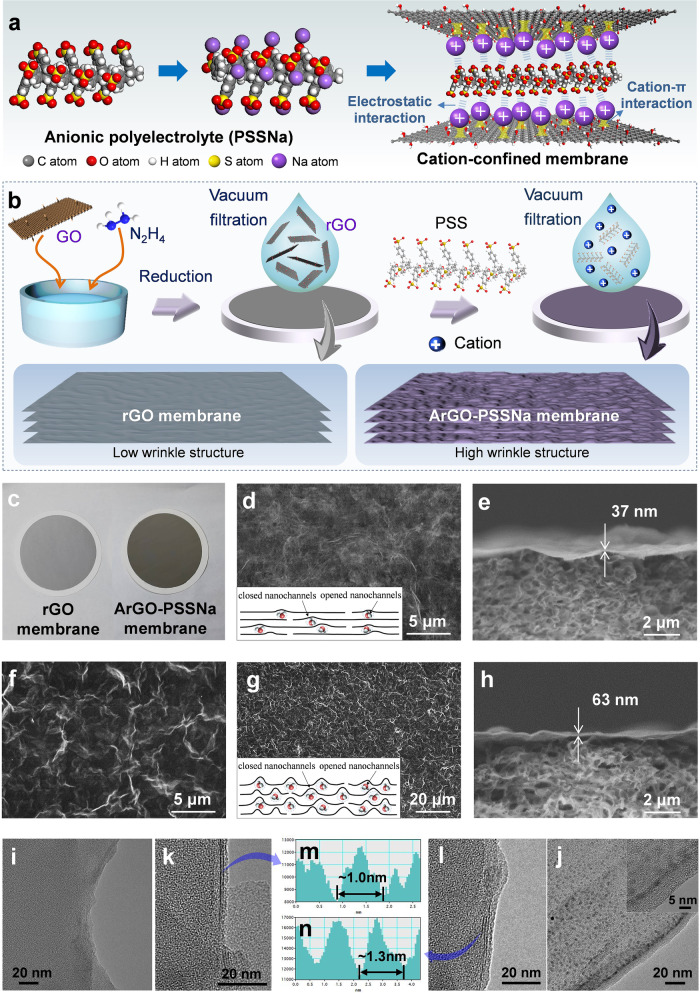
Constructing nanolaminate membranes made of two-dimensional graphene oxide nanosheets has gained enormous interest in recent decades. However, a key challenge facing current graphene-based membranes is their poor rejection for monovalent salts due to the swelling-induced weak nanoconfinement and the transmembrane co-transport of anions and cations. Herein, we propose a strategy of electrostatic-induced ion-confined partitioning in a reduced graphene oxide membrane for breaking the correlation of anions and cations to suppress anion-cation co-transport, substantially improving the desalination performance. The membrane demonstrates a rejection of 95.5% for NaCl with a water permeance of 48.6 L m-2 h-1 bar-1 in pressure-driven process, and it also exhibits a salt rejection of 99.7% and a water flux of 47.0 L m-2 h-1 under osmosis-driven condition, outperforming the performance of reported graphene-based membranes. The simulation and calculation results unveil that the strong electrostatic attraction of membrane forces the hydrated Na+ to undergo dehydration and be exclusively confined in the nanochannels, strengthening the intra-nanochannel anion/cation partitioning, which refrains from the dynamical anion-cation correlations and thereby prevents anions and cations from co-transporting through the membrane. This study provides guidance for designing advanced desalination membranes and inspires the future development of membrane-based separation technologies.


Conflict of interest statement

The authors declare no competing interests.

Figures

Fig. 1
Fig. 1. Preparation and structure of ArGO-PSSNa membrane.
a Structural illustration of ArGO-PSSNa membrane. b Schematic diagrams of the preparation procedure and the wrinkle structures of rGO and ArGO-PSSNa membranes. c Digital photographs of rGO and ArGO-PSSNa membranes. d, e Top and cross-section SEM images of rGO membrane. The inset of d shows the schematic diagram of the wrinkle structures of the rGO membrane. f, g Top SEM images of ArGO-PSSNa membrane. The inset of g shows the schematic diagram of the wrinkle structures of the ArGO-PSSNa membrane. h Cross-section view of ArGO-PSSNa membrane. il, TEM images of rGO membrane (i, k) and ArGO-PSSNa membrane (j, l). The inset of j shows the high-resolution TEM image of the ArGO-PSSNa membrane. m, n Interlayer spacing measurements of rGO membrane (m) and ArGO-PSSNa membrane (n) using the DigitalMicrograph software.
Fig. 2
Fig. 2. Characterization of ArGO-PSSNa membrane structures and properties.
a XRD diffraction patterns of PVDF substrate, GO, rGO, ArGO, and ArGO-PSSNa membranes. b 2D-WAXD patterns of GO (i), rGO (ii), ArGO (iii), and ArGO-PSSNa (iv) membranes. c Variation of element content over XPS etching depth in GO (i), rGO (ii), ArGO (iii), and ArGO-PSSNa (iv) membranes. The lines between symbols are guides to the eye. d FTIR spectra of GO, rGO, ArGO, and ArGO-PSSNa membranes. The dashed lines are guide to the eye. e Zeta potentials of GO, rGO, ArGO, and ArGO-PSSNa membranes. Error bars represent the standard deviation of three replicate measurements. Source data are provided as a Source Data file.
Fig. 3
Fig. 3. Membrane performance evaluation.
a Pure water permeances of GO, rGO, ArGO, and ArGO-PSSNa membranes. b Time variations of water contact angles for GO, rGO, ArGO, and ArGO-PSSNa membranes. Ultrapure water serves as the test solution. The lines denote the linear fits made with the numerical model. c Surface free energies of GO, rGO, ArGO, and ArGO-PSSNa membranes calculated according to the contact angle measurements. d Water permeances and salt rejection rates of GO, rGO, ArGO, and ArGO-PSSNa membranes for filtering a 5 mM NaCl solution under a transmembrane pressure of 5 bar. e Water permeances and NaCl rejection rates of ArGO-PSSNa membranes with different ArGO-PSSNa loadings. The solid lines are drawn as guides to the eye. f Performance comparison of ArGO-PSSNa membrane with the graphene-based membranes reported in previous literatures. The lines are drawn as guides to the eye. The detailed performance parameters of membranes and the references are shown in Supplementary Table 3. g IV curves of GO, rGO, ArGO, and ArGO-PSSNa membranes between a deionized water and a 5 mM NaCl solution. The inset of g shows the diagram of electrochemical two-compartment cell. Two Ag/AgCl electrodes were used for testing the IV curves. h Arrhenius-type plots for NaCl salt transport through GO, rGO, ArGO, and ArGO-PSSNa membranes from 5 mM NaCl solution to DI water. Natural logarithm of the salt flux divided by salt concentration difference of two cells (Jsalt/ΔC) is plotted as a function of 1/T. The lines denote the linear fits made with the numerical model. i Energy barriers for NaCl salt during the transmembrane process through GO, rGO, ArGO, and ArGO-PSSNa membranes from 5 mM NaCl solution to DI water. The inset of i shows the diagram of transmembrane energy barrier profiles for salt transported through GO and ArGO-PSSNa membranes. Error bars represent the standard deviation of three replicate measurements. Source data are provided as a Source Data file.
Fig. 4
Fig. 4. Simulations of ion distribution and transport behavior in rGO and ArGO-PSSNa nanochannels.
a Simulated ion concentration profiles in the feed and membrane nanochannels. (i) Cation (Na+) concentration in rGO membrane nanochannels; (ii) Cation (Na+) concentration in ArGO-PSSNa membrane nanochannels; (iii) Anion (Cl) concentration in rGO membrane nanochannels; (iv) Anion (Cl) concentration in ArGO-PSSNa membrane nanochannels. b Cation (Na+) concentration variations from the feed side to the rGO and ArGO-PSSNa membrane nanochannels. c Anion (Cl) concentration variations from the feed side to the rGO and ArGO-PSSNa membrane nanochannels. d Snapshots of the MD simulations for NaCl solution transporting through the rGO nanochannels. e Snapshots of the MD simulations for NaCl solution transporting through the ArGO-PSSNa nanochannels. The C, O, H, S, Na, and Cl atoms are shown in gray, red, white, yellow, blue, and green spheres, respectively. f Time evolution of the number of Na+ and Cl in the rGO nanochannels. g Time evolution of the number of Na+ and Cl in the ArGO-PSSNa nanochannels. h, i MD-calculated RDF and coordination numbers for oxygen and hydrogen of water molecules around the Na+ ions in the feed side (h) and ArGO-PSSNa nanochannels (i). The solid lines represent the RDF, and the dashed lines denote the coordination numbers. j Schematic diagram of ion distribution behavior in the feed side and ArGO-PSSNa nanochannels. Source data are provided as a Source Data file.
Fig. 5
Fig. 5. Performance and mechanism of osmosis-driven membrane processes.
a Water fluxes and NaCl permeation fluxes of GO, rGO, ArGO, and ArGO-PSSNa membranes. The tests were conducted at room temperature under FO (the active layer facing the feed solution) mode using 0.5 M NaCl and DI water as the draw and feed solutions, respectively. b Salt rejection rates and Js/Jw of GO, rGO, ArGO, and ArGO-PSSNa membranes. c Performances of ArGO-PSSNa membrane and the membranes in literatures. The lines are drawn as guides to the eye. The detailed membrane performance parameters and the references are shown in Supplementary Table 6. d, e Arrhenius-type plots for individual cation (Na+) and anion (Cl) transporting through GO, rGO, ArGO, and ArGO-PSSNa membranes from 0.5 M NaCl solution to DI water. The natural logarithm of the lumped parameter (GtT) was plotted as a function of 1/T. The lines denote the linear fits made with the numerical model. f Energy barriers of salt (NaCl), cation (Na+), and anion (Cl) during the transmembrane process through GO, rGO, ArGO, and ArGO-PSSNa membranes from 0.5 M NaCl solution to DI water. The inset of f shows the diagram of transmembrane energy barrier profiles that the energy barrier of NaCl is equal to the sum of energy barriers of Na+ and Cl. g, h Snapshots of MD simulations for osmosis-driven desalination processes of rGO (g) and ArGO-PSSNa (h) nanochannels. The C, O, H, S, Na, and Cl atoms are shown in gray, red, white, yellow, blue, and green spheres, respectively. i, j Time evolutions of MSD of water molecule, Na+, and Cl in the entire simulation period for rGO (i) and ArGO-PSSNa (j) nanochannels. k, l Average number density distributions of Na+ and Cl in the feed side, nanochannel, and permeate side during the entire simulation period for rGO (k) and ArGO-PSSNa (l) nanochannels. Error bars represent the standard deviation of three replicate measurements. Source data are provided as a Source Data file.
Fig. 6
Fig. 6. Interactions between ArGO-PSSNa membrane and ions.
ad DFT-calculated electron density difference distributions between rGO and Na+ (a), rGO and PSS (b), PSS and Na+ (c), and rGO, PSS and Na+ (d). The blue and green regions represent the accumulation and depletion of electron density, respectively, and the isosurface is 0.01 e A−3. e DFT-calculated adsorption energies of rGO-Na+, rGO-PSS, PSS-Na+, and rGO-PSS-Na+. f Element contents of S and Na in XPS etching spectra of ArGO-Na, ArGO-PSS, and ArGO-PSSNa membranes. gj Schematics of the ion-membrane interactions and ion transport behavior in the ArGO (g, h) and ArGO-PSSNa (i, j) membrane nanochannels. Source data are provided as a Source Data file.

Similar articles

Cited by

References

    1. Nair RR, Wu HA, Jayaram PN, Grigorieva IV, Geim AK. Unimpeded permeation of water through helium-leak–tight graphene-based membranes. Science. 2012;335:442–444. doi: 10.1126/science.1211694. - DOI - PubMed
    1. Chen L, et al. Ion sieving in graphene oxide membranes via cationic control of interlayer spacing. Nature. 2017;550:380–383. doi: 10.1038/nature24044. - DOI - PubMed
    1. Joshi RK, et al. Precise and ultrafast molecular sieving through graphene oxide membranes. Science. 2014;343:752–754. doi: 10.1126/science.1245711. - DOI - PubMed
    1. Liu G, Jin W, Xu N. Graphene-based membranes. Chem. Soc. Rev. 2015;44:5016–5030. doi: 10.1039/C4CS00423J. - DOI - PubMed
    1. You Y, Sahajwalla V, Yoshimura M, Joshi RK. Graphene and graphene oxide for desalination. Nanoscale. 2016;8:117–119. doi: 10.1039/C5NR06154G. - DOI - PubMed