. 2024 May 21;14(1):11533.
doi: 10.1038/s41598-024-62188-8.

Ferritin nanocage-enabled detection of pathological tau in living human retinal cells

Affiliations

Ferritin nanocage-enabled detection of pathological tau in living human retinal cells

Lorenzo Barolo et al. Sci Rep. .

Abstract

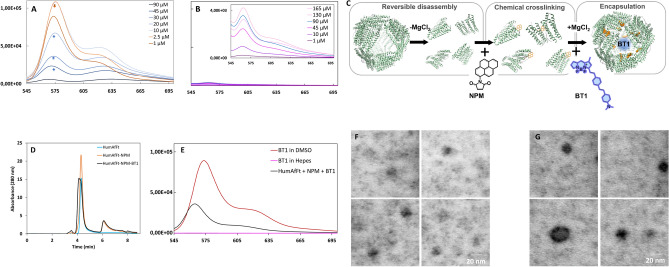
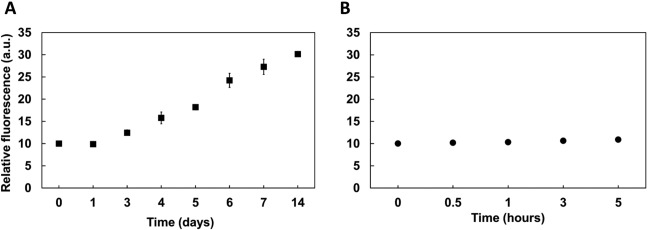
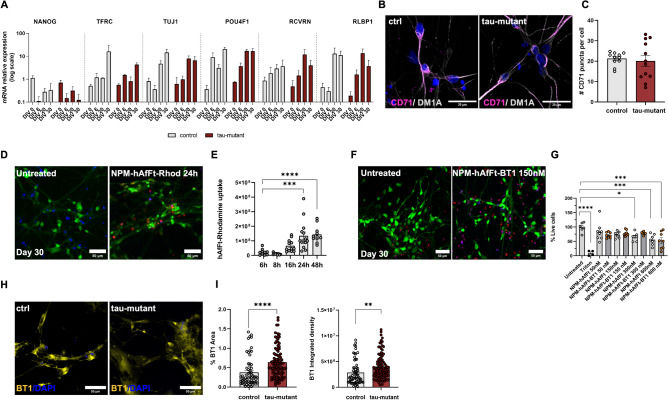
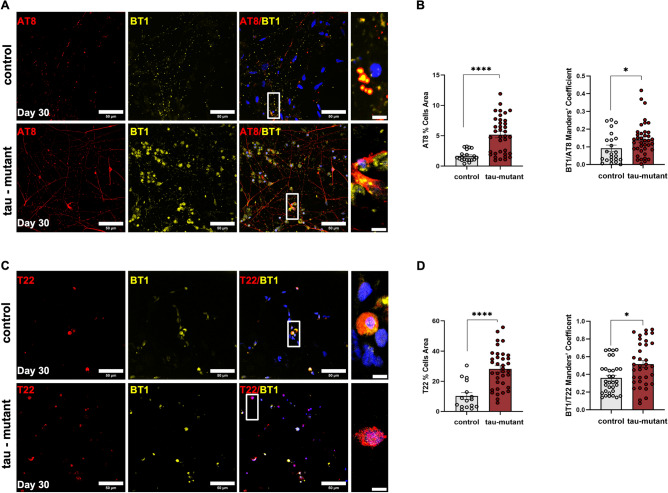
Tauopathies, including Alzheimer's disease and Frontotemporal Dementia, are debilitating neurodegenerative disorders marked by cognitive decline. Despite extensive research, achieving effective treatments and significant symptom management remains challenging. Accurate diagnosis is crucial for developing effective therapeutic strategies, with hyperphosphorylated protein units and tau oligomers serving as reliable biomarkers for these conditions. This study introduces a novel approach using nanotechnology to enhance the diagnostic process for tauopathies. We developed humanized ferritin nanocages, a novel nanoscale delivery system, designed to encapsulate and transport a tau-specific fluorophore, BT1, into human retinal cells for detecting neurofibrillary tangles in retinal tissue, a key marker of tauopathies. The delivery of BT1 into living cells was successfully achieved through these nanocages, demonstrating efficient encapsulation and delivery into retinal cells derived from human induced pluripotent stem cells. Our experiments confirmed the colocalization of BT1 with pathological forms of tau in living retinal cells, highlighting the method's potential in identifying tauopathies. Using ferritin nanocages for BT1 delivery represents a significant contribution to nanobiotechnology, particularly in neurodegenerative disease diagnostics. This method offers a promising tool for the early detection of tau tangles in retinal tissue, with significant implications for improving the diagnosis and management of tauopathies. This study exemplifies the integration of nanotechnology with biomedical science, expanding the frontiers of nanomedicine and diagnostic techniques.

Keywords: Alzheimer’s disease; BODYPY tau fluorophores; Diagnostic probes; Ferritin nanocages; Frontotemporal Dementia; Induced pluripotent stem cells; Nanobiotechnology; Nanomedicine; Nanoscale delivery systems; Neurodegenerative diseases; Retinal tissue detection; Tauopathies.


Conflict of interest statement

The funders had no role in the design of the study; in the collection, analysis, or interpretation of data; in the writing of the manuscript; or in the decision to publish the results. YG is employed by D-Tails s.r.l.; MP and SG were employed by D-Tails s.r.l; SDA and AB are scientific advisors of D-Tails s.r.l. The remaining authors declare that the research was conducted in the absence of any commercial or financial relationships that could be construed as a potential conflict of interest.

Figures

Figure 1
Figure 1
Characterization of successful BT1 encapsulation in ferritin nanoparticles. (A, B) Representative fluorescence spectra of BT1 showing the influence of polar solvents on the BT1 fluorescence: (A) Variations of fluorescence intensities as a function of BT1 concentration in 100% DMSO and (B) 20 mM Hepes pH 7.4: a closed-up view is included for clarity. (C) Illustrative drawing of the pyrene-based functionalization and BT1 encapsulation within ferritin nanocage. HumAfFt here is shown as green helices. NPM is displayed in orange sticks and covalently linked to C54 per monomer. BT1 structure is highlighted in blue and, for simplicity, represented as a blue sphere inside the nanocage. (D) Representative chromatograms showing HPLC analysis of HumAfFt (CTRL) in cyano, NPM-HumAfFt in orange and BT1-loaded NPM-HumAfFt in black (n = 3 preparations). (E) Fluorescence spectra of BT1 in NPM-HumAfFt in 20 mM Hepes, pH 7.4 is shown in green. Note the enhancement of fluorescence intensity induced by BT1 encapsulation. For comparison, 1 μM BT1 in 100% DMSO is shown in red and 1 μM BT1 dissolved in 20 mM Hepes pH 7.4 in magenta. NPM-HumAfFt does not show any absorbance in the observed range. All the spectra were measured in the 545–700 nm range (λex = 520 nm; Ex. bandwidth = 5 nm; Em. bandwidth = 5 nm) and performed on 6 preparations. Representative STEM images of the HumAfFt (CTRL) and (F) BT1-loaded NPM-HumAfFt. Scale bars = 20 nm (n = 25 particles, 6 images, 2 samples for each condition). (G).
Figure 2
Figure 2
Time courses of fluorescence emission intensities of K18 tau protein and fibrillated BSA. Variation of fluorescence of BT1-loaded NPM-HumAfFt upon binding to β-sheet structures of (A) K18 tau protein before and after treatment with heparin at 37 °C (non-visible error bars are lower than 2%; n = 4 independent preparations) and (B) BSA protein before and after heating at 63 °C (non-visible error bars are lower than 2%; n = 4 independent preparations). All the spectra were measured using a λex = 520 nm and λem = 565 nm.
Figure 3
Figure 3
NPM-HumAfFt-BT1 Complex Demonstrates Successful Internalization in Retinal Neurons with Minimal Toxicity. (A) Bar chart showing the expression of retinal and neuronal transcripts in human control (gray bars) and tau-mutant (burgundy bars) iPSC-derived retinal cells during culture differentiation and maturation over a 30-day time course. Values are expressed as fold change normalized to DIV 0 of control cultures, set as 1 for each transcript. Retinal cell types are characterized by specific markers: NANOG for stem cells, TUJ1 for neuronal cells, POU4F1 (BRN3a) for retinal ganglion cells; RCVRN for photoreceptors; RLBP1 for Müller glia. Note that both control and tau-mutant retinal cultures express the transferrin receptor-CD71 (TFRC) (n = 15/3/3 fields of view/coverslips/independent cultures for both control and tau-mutant iPSCs; Student t-test or Mann Whitney ns). (B) Representative confocal images (maximum intensity projection 20 stacks, z = 0.2 µm) showing the expression of the transferrin receptor CD71 (magenta) in control and tau-mutant iPSC-derived retinal cultures at DIV 30. The cytoskeletal marker DM1A (gray) is used to identify neuronal cells and to create the mask used for the analysis. Scale bar: 20 µm. Nuclei were stained with HOECST (blue). (C) Bar chart showing the quantification of CD71 expression in control and tau-mutant hiPSC-derived retinal cultures at DIV 30 in control (light gray, n = 15/3/3 fields of view/coverslips/independent cultures for both control and tau-mutant iPSCs) and tau-mutant (burgundy, n = 15/3/3 fields of view/coverslips/independent cultures for both control and tau-mutant iPSCs Student t-test ns). (D) Representative confocal images of control hiPSC-derived retinal neurons at DIV 30 treated with 150 nM NPM-HumanAfFt-Rhodamine (red) for 24 h. Live cells were stained with Fluorescein Diacetate (FDA; green), nuclei were counterstained with HOECST in blue. The images depict a maximum intensity projection of a defined region of interest (20 stacks with a z-spacing of 0.2 µm). Scale bar: 50 µm. (E) Bar charts displaying the quantitative analysis of NPM-HumanAfFt-Rhodamine (150 nM) uptake by retinal neurons at DIV 30 at different time points (6, 8, 16, 24, and 48 h). The intensity of rhodamine fluorescence increases progressively over time, with statistically significant differences observed when compared to the 6-h treatment period (n = 15/3/3 fields of view/coverslips/independent cultures for both control and tau-mutant iPSCs, one-way ANOVA, ***p < 0.001, ****p < 0.0001). (F) Representative confocal images of control hiPSC-derived retinal neurons (DIV 30) treated with 150 nM NPM-HumanAfFt-BT1 complex for 24 h to evaluate BT1 cytotoxicity. Living cells are stained in green with FDA (green), dead cells are stained in red with Propidium iodide (red) and nuclei are stained in blue with HOECTS. Scale bar: 50 µm. Images show a maximum intensity projection of a region of interest (20 stacks, z = 0.2 µm). (G) Bar charts showing the dose–response effect on cell survival following 24-h exposure to NPM-HumanAfFt BT1 (dark gray bars with orange dots). Cells incubated with NPM-HumanAfFt (vehicle, light gray bars with white dots) are used as control. Cells treated with 10% triton for 4 min are used as control for dead cells (light gray bars with black dots). Untreated cells are used as positive control (light gray bars with white dots; n = 15/3/3 fields of view/coverslips/independent cultures for each condition). Significant differences are reported compared to the untreated condition (one-way ANOVA, *p < 0.05, **p < 0.01, ****p < 0.0001). (H) Representative confocal images illustrating the internalization of the NPM-HumAfFt-BT1 complex (yellow) within living retinal neurons at DIV 30 (control and tau-mutant). Nuclei were counterstained with HOECST in blue. The images represent a maximum intensity projection of a region of interest, composed of 16 stacks with a z-spacing of 0.2 µm. Scale bar: 50 µm. (I) Bar charts showing the quantification of the area covered by BT1 signal (left) and the integrated density analysis of BT1 signal (right) in DIV 30 control and tau-mutant retinal neurons. (n = 15/3/3 fields of view/coverslips/independent cultures for both control and tau-mutant iPSCs; one-way ANOVA, **p < 0.01, ****p < 0.0001).
Figure 4
Figure 4
NPM-HumAfFt-BT1 Nanocages Enable Accurate Detection of p-tau and o-tau in Retinal Neurons (A) Representative confocal images of control (top) and tau-mutant (bottom) iPSC-derived retinal neurons (at DIV 30) treated with 150 nM NPM-HumanAfFt-BT1 complex for 24 h, then fixed and immunostained for anti PHF-tau Ser202/Thr205 antibody (AT8). Images show a maximum intensity projection of a region of interest. Scale bar: 50 µm. Zoomed images reveal the cytoplasmic co-localization of BT1 (yellow) and AT8 (red). HOECST was used to stain nuclei (blue). Scale bar: 5 µm. (B) Bar charts showing the quantification of the area covered by AT8 (left) and the Manders co-localization coefficient of BT1 and AT8 (right) in control (grey) and tau-mutant (burgundy) retinal neurons (n = 15/3/3 fields of view/coverslips/independent cultures for both control and tau-mutant iPSCs, one-way ANOVA *p < 0.05,****p < 0.0001). (C) Representative confocal images of control (top) and tau- mutant (bottom) iPSC-derived retinal neurons (at DIV 30) treated with 150 nM NPM-HumanAfFt-BT1 complex for 24 h, then fixed and immunostained for anti o-tau antibody (T22). Images show a maximum intensity projection of a region of interest. Scale bar: 50 µm. Zoomed images reveal the cytoplasmic co-localization of BT1 (yellow) and T22 (burgundy). HOECST was used to stain nuclei (blue). Scale bar: 5 µm. (D) Bar charts showing the quantification of the area covered by T22 staining (left) and the Manders co-localization coefficient of BT1 and T22 signals (right) in control (gray) and tau-mutant (burgundy) retinal neurons. (n = 15/3/3 fields of view/coverslips/independent cultures for both control and tau-mutant iPSCs, one-way ANOVA *p < 0.05, ****p < 0.0001).

Similar articles

Cited by

References

    1. Huang LK, Kuan YC, Lin HW, Hu CJ. Clinical trials of new drugs for Alzheimer disease: A 2020–2023 update. J. Biomed. Sci. 2023;30(1):83. doi: 10.1186/s12929-023-00976-6. - DOI - PMC - PubMed
    1. Cummings J, Zhou Y, Lee G, Zhong K, Fonseca J, Cheng F. Alzheimer’s disease drug development pipeline: 2023. Alzheimer’s Dementia Transl. Res. Clin. Interv. 2023;9(2):e12385. doi: 10.1002/trc2.12385. - DOI - PMC - PubMed
    1. Self WK, Holtzman DM. Emerging diagnostics and therapeutics for Alzheimer disease. Nat. Med. 2023;29:2187–2199. doi: 10.1038/s41591-023-02505-2. - DOI - PubMed
    1. Wang YTT, Rosa-Neto P, Gauthier S. Advanced brain imaging for the diagnosis of Alzheimer disease. Curr. Opin. Neurol. 2023;36:481–490. doi: 10.1097/WCO.0000000000001198. - DOI - PubMed
    1. Ossenkoppele R, Pichet Binette A, Groot C, Smith R, Strandberg O, Palmqvist S, et al. Amyloid and tau PET-positive cognitively unimpaired individuals are at high risk for future cognitive decline. Nat. Med. 2022;28(11):2381–2387. doi: 10.1038/s41591-022-02049-x. - DOI - PMC - PubMed