

A comparative study on the dose-effect of low-dose radiation based on microdosimetric analysis and single-cell sequencing technology
- PMID: 38773212
- PMCID: PMC11109114
- DOI: 10.1038/s41598-024-62501-5
A comparative study on the dose-effect of low-dose radiation based on microdosimetric analysis and single-cell sequencing technology
Abstract
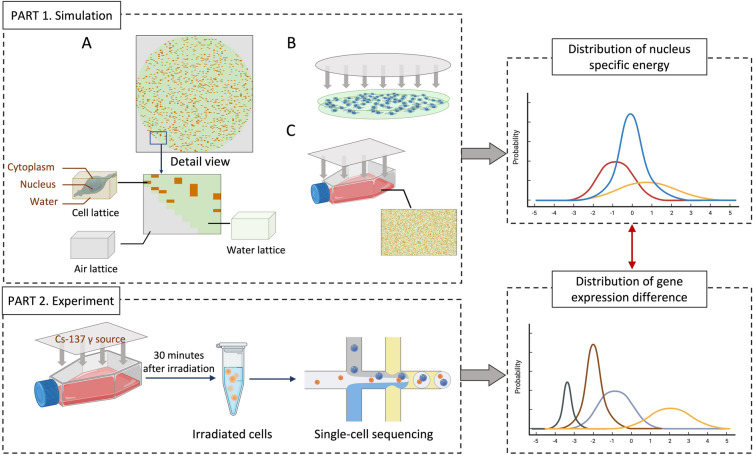
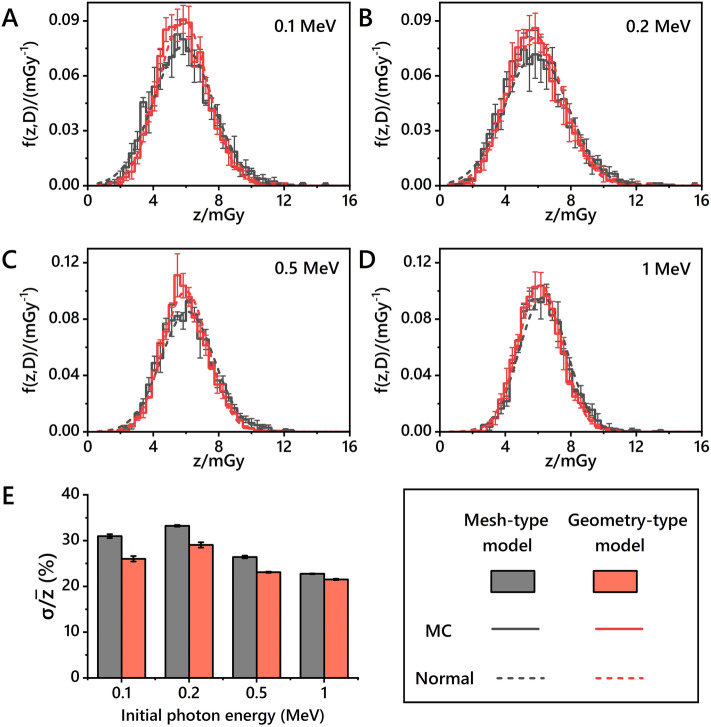
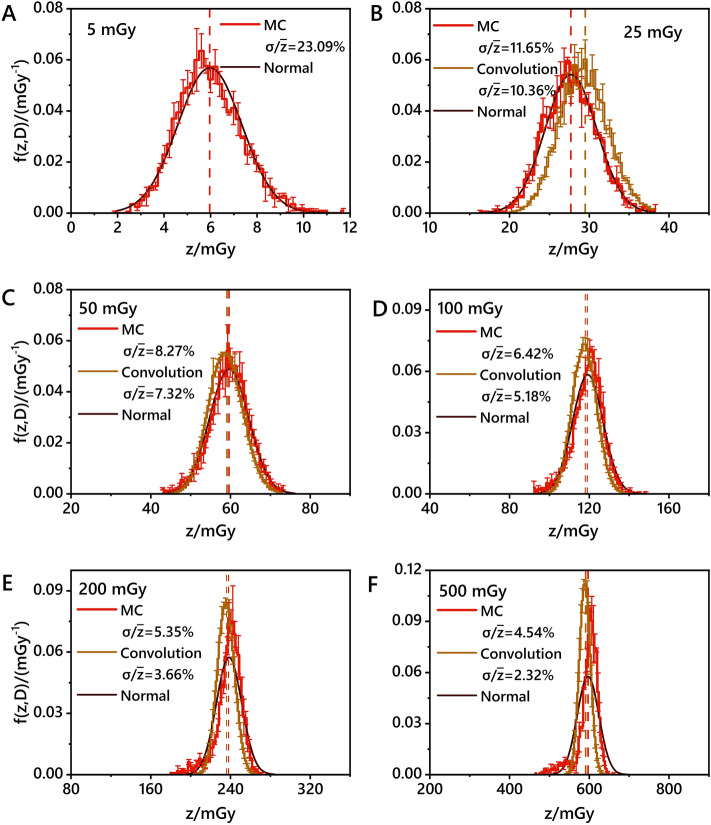
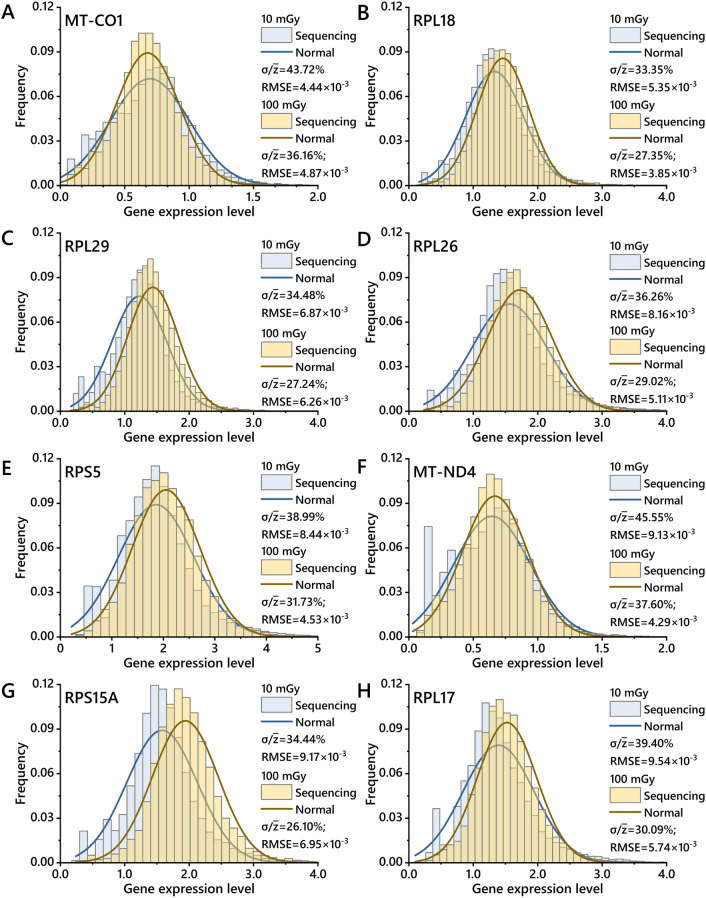
The biological mechanisms triggered by low-dose exposure still need to be explored in depth. In this study, the potential mechanisms of low-dose radiation when irradiating the BEAS-2B cell lines with a Cs-137 gamma-ray source were investigated through simulations and experiments. Monolayer cell population models were constructed for simulating and analyzing distributions of nucleus-specific energy within cell populations combined with the Monte Carlo method and microdosimetric analysis. Furthermore, the 10 × Genomics single-cell sequencing technology was employed to capture the heterogeneity of individual cell responses to low-dose radiation in the same irradiated sample. The numerical uncertainties can be found both in the specific energy distribution in microdosimetry and in differential gene expressions in radiation cytogenetics. Subsequently, the distribution of nucleus-specific energy was compared with the distribution of differential gene expressions to guide the selection of differential genes bioinformatics analysis. Dose inhomogeneity is pronounced at low doses, where an increase in dose corresponds to a decrease in the dispersion of cellular-specific energy distribution. Multiple screening of differential genes by microdosimetric features and statistical analysis indicate a number of potential pathways induced by low-dose exposure. It also provides a novel perspective on the selection of sensitive biomarkers that respond to low-dose radiation.
Keywords: Low dose radiation; Mesh-type cell model; Microdosimetry; Monte Carlo; Single-cell sequencing.
© 2024. The Author(s).
Conflict of interest statement
The authors declare no competing interests.
Figures
Similar articles
-
Microdosimetric assessment about proton spread-out Bragg peak at different depths based on the normal human mesh-type cell population model.Phys Med Biol. 2023 Aug 14;68(17). doi: 10.1088/1361-6560/acec2b. Phys Med Biol. 2023. PMID: 37578025
-
MIMC-β: microdosimetric assessment method for internal exposure ofβ-emitters based on mesh-type cell cluster model.Phys Med Biol. 2024 Nov 11;69(22). doi: 10.1088/1361-6560/ad8c92. Phys Med Biol. 2024. PMID: 39526343
-
Microdosimetric considerations for radiation response studies using Raman spectroscopy.Med Phys. 2018 Oct;45(10):4734-4743. doi: 10.1002/mp.13145. Epub 2018 Sep 21. Med Phys. 2018. PMID: 30141185
-
Microdosimetric properties of ionizing electrons in water: a test of the PENELOPE code system.Phys Med Biol. 2002 Jan 7;47(1):79-88. doi: 10.1088/0031-9155/47/1/306. Phys Med Biol. 2002. PMID: 11814229
-
Radiobiological challenges posed by microdosimetry.Health Phys. 1996 Jun;70(6):832-6. doi: 10.1097/00004032-199606000-00008. Health Phys. 1996. PMID: 8635908 Review.
Cited by
-
Monte Carlo methods to assess biological response to radiation in peripheral organs and in critical organs near the target.Rep Pract Oncol Radiother. 2024 Dec 4;29(5):638-648. doi: 10.5603/rpor.103525. eCollection 2024. Rep Pract Oncol Radiother. 2024. PMID: 39759550 Free PMC article. Review.
References
-
- National Academies of Sciences Medicine . Leveraging Advances in Modern Science to Revitalize Low-Dose Radiation Research in the United States. The National Academies Press; 2022. - PubMed
-
- UNSCEAR . The UNSCEAR 2020/2021 Report Volume III Scientific Annex C: Biological Mechanisms Relevant for the Inference of Cancer Risks from Low-Dose and Low-Dose-Rate Radiation. United Nations; 2021.
-
- NCRP . Medical Radiation Exposure of Patients in the United States: Recommendations of the National Council on Radiation Protection and Measurements. National Council on Radiation Protection and Measurements; 2019.
-
- NCRP . Implications of Recent Epidemiologic Studies for the Linear-Nonthreshold Model and Radiation Protection (NCRP Commentary No. 27) National Council on Radiation Protection and Measurements; 2018.
-
- UNSCEAR . Report of the United Nations Scientific Committee on the Effects of Atomic Radiation Sixty-Seventh Session (2–6 November 2020) United Nations; 2020.
Publication types
MeSH terms
Grants and funding
- No. 12105200/National Natural Science Foundation of China
- No. 12175161/National Natural Science Foundation of China
- No. U2267220/National Natural Science Foundation of China
- GZC00401/Innovative project of the State Key Laboratory of Radiation Medicine and Protection
- GZC00402/Innovative project of the State Key Laboratory of Radiation Medicine and Protection
LinkOut - more resources
Full Text Sources
Molecular Biology Databases
