

Sericin promotes chondrogenic proliferation and differentiation via glycolysis and Smad2/3 TGF-β signaling inductions and alleviates inflammation in three-dimensional models
- PMID: 38773312
- PMCID: PMC11109159
- DOI: 10.1038/s41598-024-62516-y
Sericin promotes chondrogenic proliferation and differentiation via glycolysis and Smad2/3 TGF-β signaling inductions and alleviates inflammation in three-dimensional models
Abstract
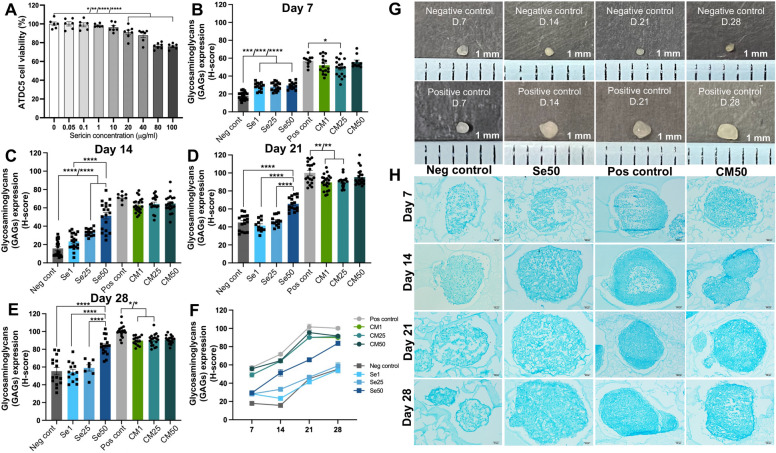
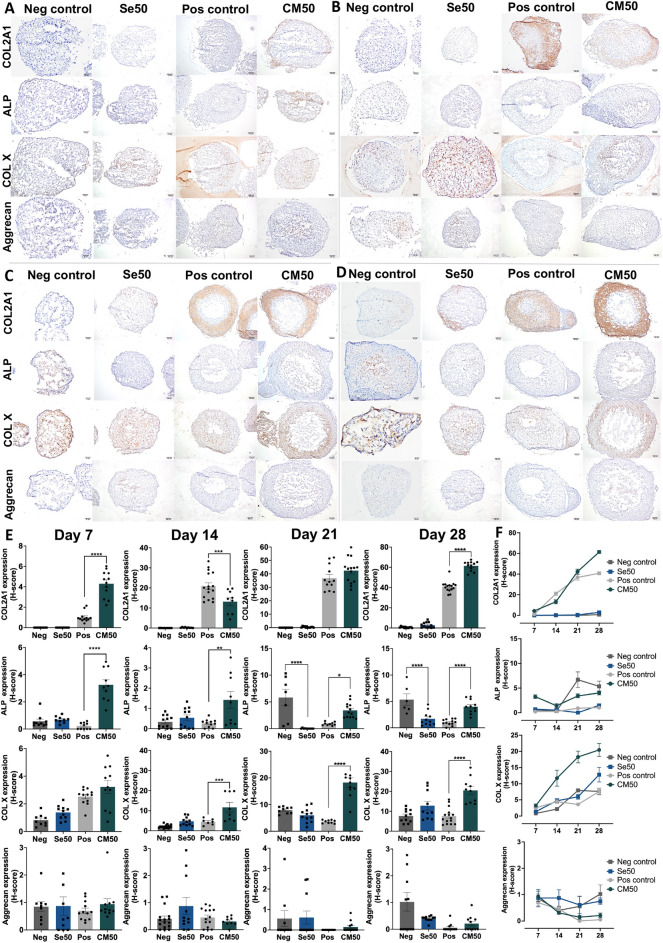
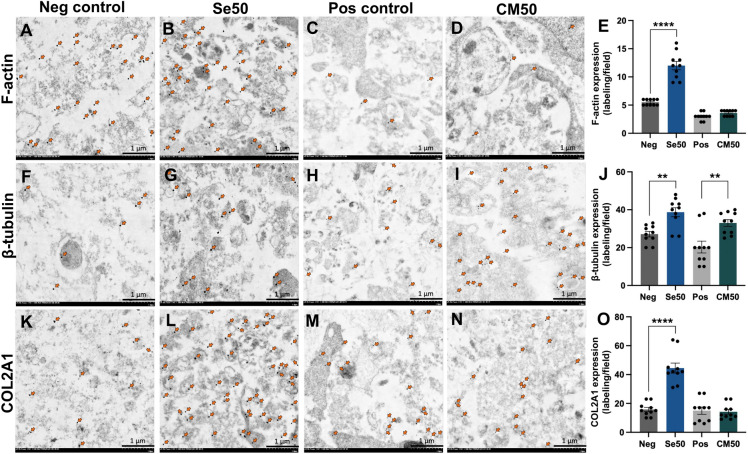
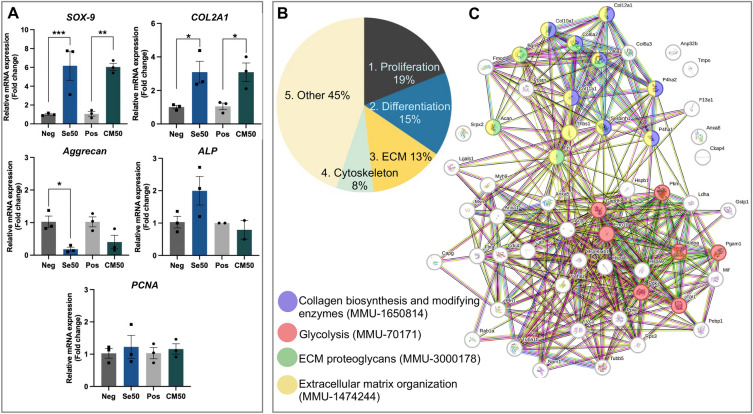
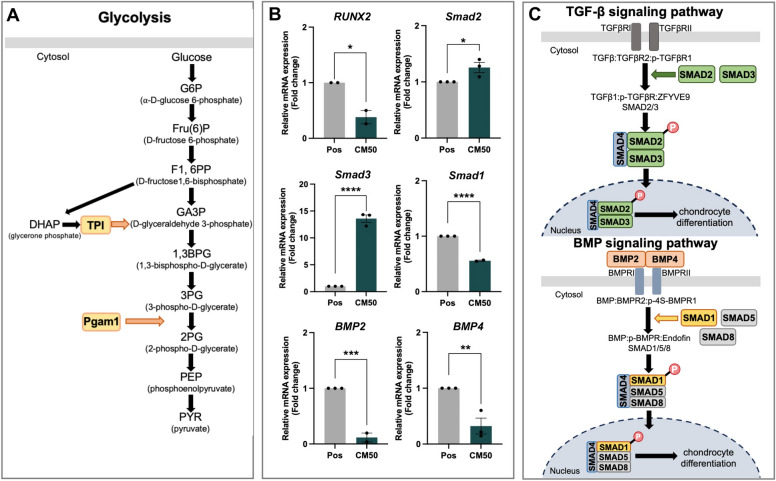
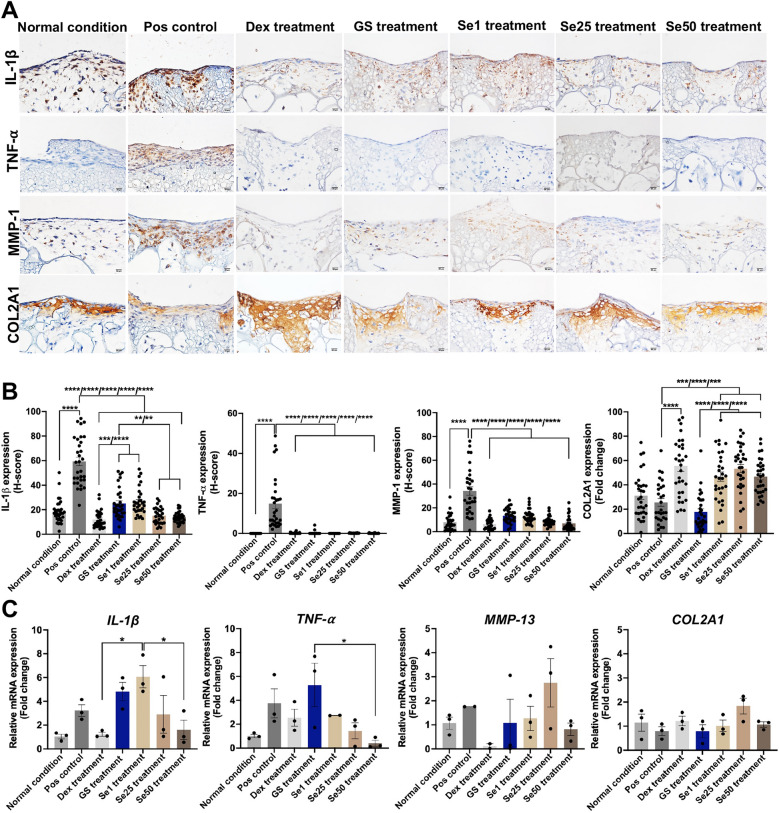
Knee osteoarthritis is a chronic joint disease mainly characterized by cartilage degeneration. The treatment is challenging due to the lack of blood vessels and nerve supplies in cartilaginous tissue, causing a prominent limitation of regenerative capacity. Hence, we investigated the cellular promotional and anti-inflammatory effects of sericin, Bombyx mori-derived protein, on three-dimensional chondrogenic ATDC5 cell models. The results revealed that a high concentration of sericin promoted chondrogenic proliferation and differentiation and enhanced matrix production through the increment of glycosaminoglycans, COL2A1, COL X, and ALP expressions. SOX-9 and COL2A1 gene expressions were notably elevated in sericin treatment. The proteomic analysis demonstrated the upregulation of phosphoglycerate mutase 1 and triosephosphate isomerase, a glycolytic enzyme member, reflecting the proliferative enhancement of sericin. The differentiation capacity of sericin was indicated by the increased expressions of procollagen12a1, collagen10a1, rab1A, periostin, galectin-1, and collagen6a3 proteins. Sericin influenced the differentiation capacity via the TGF-β signaling pathway by upregulating Smad2 and Smad3 while downregulating Smad1, BMP2, and BMP4. Importantly, sericin exhibited an anti-inflammatory effect by reducing IL-1β, TNF-α, and MMP-1 expressions and accelerating COL2A1 production in the early inflammatory stage. In conclusion, sericin demonstrates potential in promoting chondrogenic proliferation and differentiation, enhancing cartilaginous matrix synthesis through glycolysis and TGF-β signaling pathways, and exhibiting anti-inflammatory properties.
Keywords: Differentiation; Glycolysis; Proliferation; Sericin; TGF-β signaling.
© 2024. The Author(s).
Conflict of interest statement
The authors declare no competing interests.
Figures
Similar articles
-
Fibulin-3 regulates the inhibitory effect of TNF-α on chondrocyte differentiation partially via the TGF-β/Smad3 signaling pathway.Biochim Biophys Acta Mol Cell Res. 2022 Sep;1869(9):119285. doi: 10.1016/j.bbamcr.2022.119285. Epub 2022 May 13. Biochim Biophys Acta Mol Cell Res. 2022. PMID: 35577279
-
Gulp1 regulates chondrocyte growth arrest and differentiation via the TGF-β/SMAD2/3 pathway.FEBS Lett. 2024 Apr;598(8):935-944. doi: 10.1002/1873-3468.14862. Epub 2024 Mar 29. FEBS Lett. 2024. PMID: 38553249
-
Age-related alterations in TGF beta signaling as a causal factor of cartilage degeneration in osteoarthritis.Biomed Mater Eng. 2014;24(1 Suppl):75-80. doi: 10.3233/BME-140976. Biomed Mater Eng. 2014. PMID: 24928920
-
SMAD3 and SMAD4 have a more dominant role than SMAD2 in TGFβ-induced chondrogenic differentiation of bone marrow-derived mesenchymal stem cells.Sci Rep. 2017 Feb 27;7:43164. doi: 10.1038/srep43164. Sci Rep. 2017. PMID: 28240243 Free PMC article.
-
A tale of two proteins: differential roles and regulation of Smad2 and Smad3 in TGF-beta signaling.J Cell Biochem. 2007 May 1;101(1):9-33. doi: 10.1002/jcb.21255. J Cell Biochem. 2007. PMID: 17340614 Review.
Cited by
-
Compliant immune response of silk-based biomaterials broadens application in wound treatment.Front Pharmacol. 2025 Feb 12;16:1548837. doi: 10.3389/fphar.2025.1548837. eCollection 2025. Front Pharmacol. 2025. PMID: 40012629 Free PMC article. Review.
-
Investigating the Therapeutic Potential of Sericin Nanofibers and Rice-Encapsulated Nanosericin for Psoriasis: Mechanistic Insights from a 3D Skin Model.Int J Nanomedicine. 2025 Apr 7;20:4257-4284. doi: 10.2147/IJN.S508995. eCollection 2025. Int J Nanomedicine. 2025. PMID: 40225220 Free PMC article.
References
-
- Disease GBD, Injury I, Prevalence C. Global, regional, and national incidence, prevalence, and years lived with disability for 354 diseases and injuries for 195 countries and territories, 1990–2017: A systematic analysis for the Global Burden of Disease Study 2017. Lancet. 2018;392:1789–1858. doi: 10.1016/S0140-6736(18)32279-7. - DOI - PMC - PubMed
MeSH terms
Grants and funding
LinkOut - more resources
Full Text Sources
Research Materials
Miscellaneous
