. 2024 Jul;27(7):1274-1284.
doi: 10.1038/s41593-024-01650-2. Epub 2024 May 21.

LINE-1 retrotransposons contribute to mouse PV interneuron development

Affiliations

LINE-1 retrotransposons contribute to mouse PV interneuron development

Gabriela O Bodea et al. Nat Neurosci. 2024 Jul.

Abstract

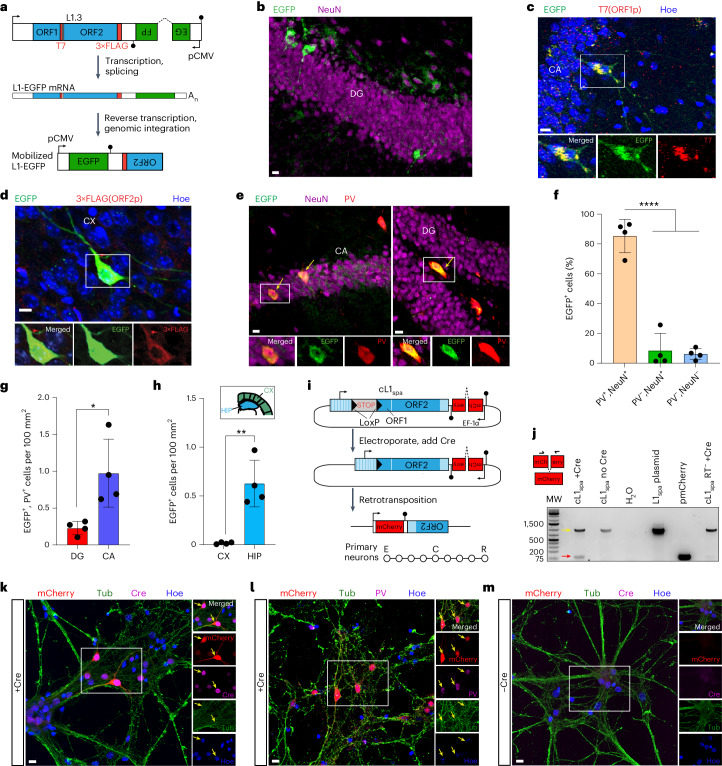
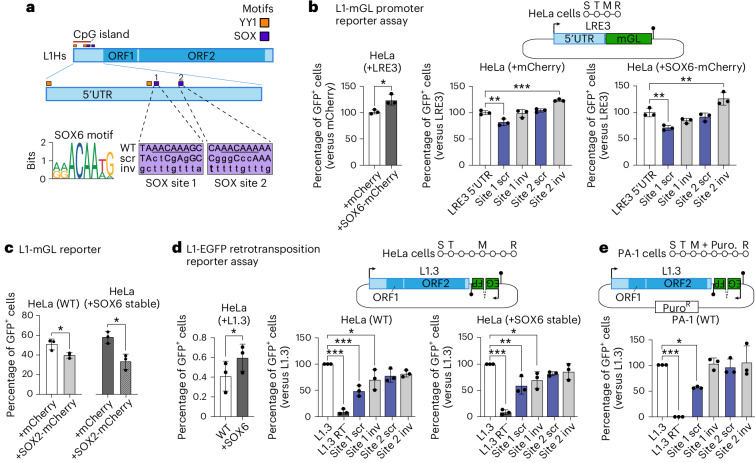
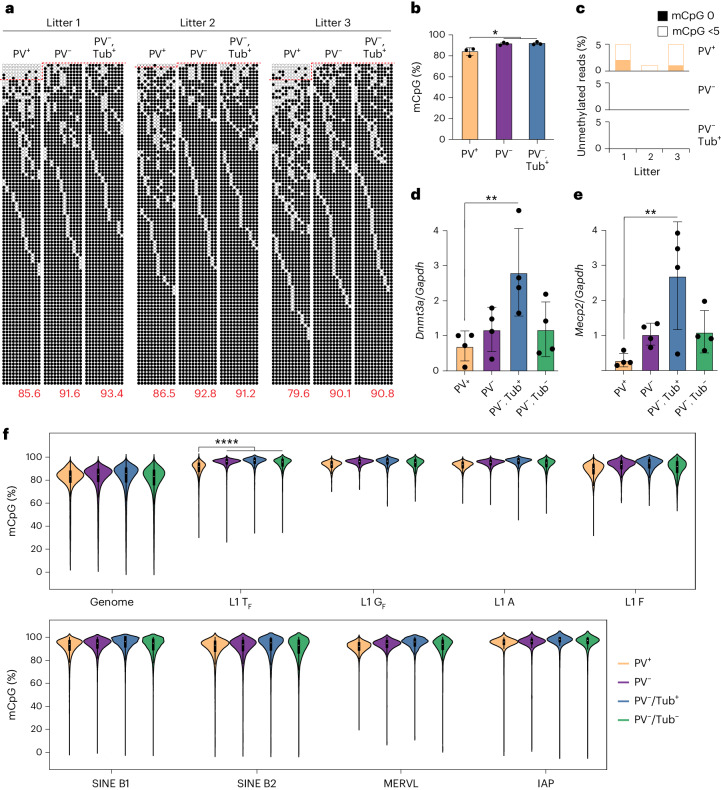
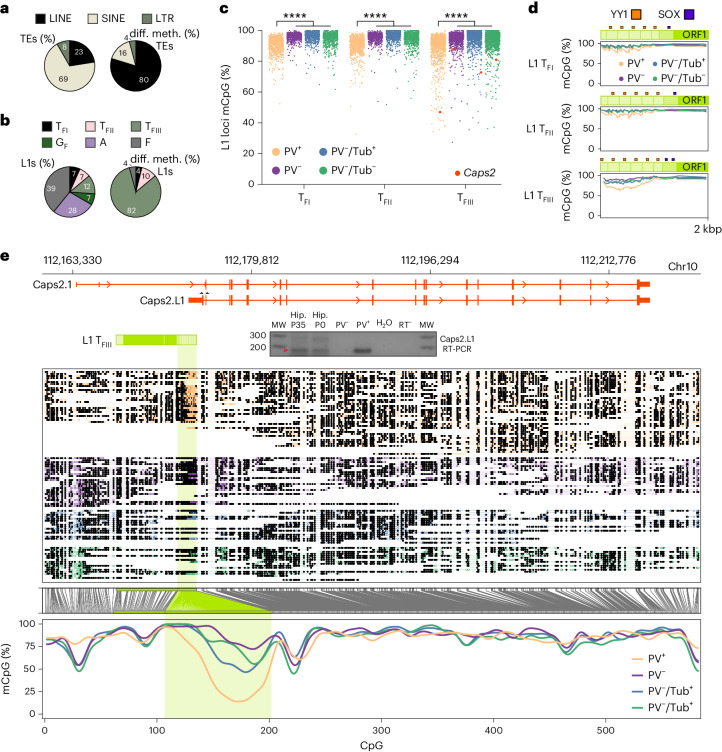
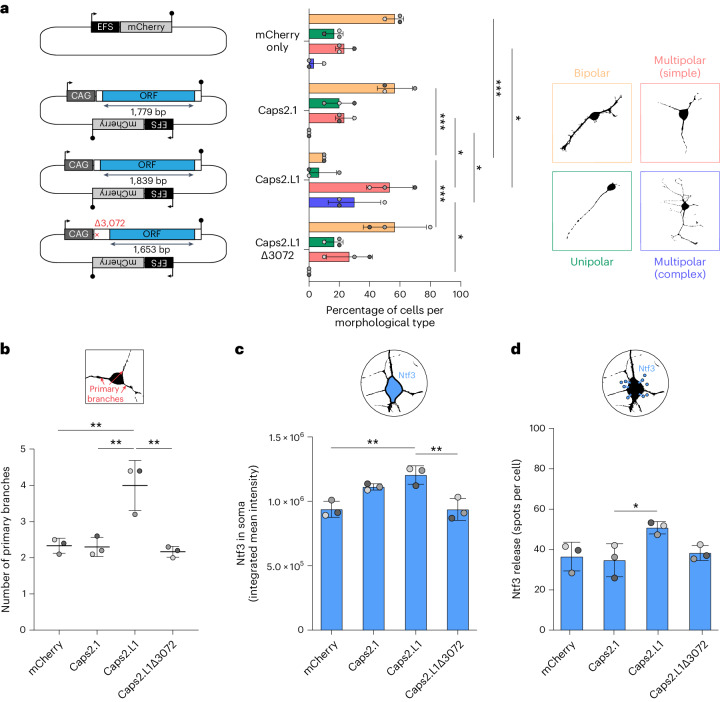
Retrotransposons are mobile DNA sequences duplicated via transcription and reverse transcription of an RNA intermediate. Cis-regulatory elements encoded by retrotransposons can also promote the transcription of adjacent genes. Somatic LINE-1 (L1) retrotransposon insertions have been detected in mammalian neurons. It is, however, unclear whether L1 sequences are mobile in only some neuronal lineages or therein promote neurodevelopmental gene expression. Here we report programmed L1 activation by SOX6, a transcription factor critical for parvalbumin (PV) interneuron development. Mouse PV interneurons permit L1 mobilization in vitro and in vivo, harbor unmethylated L1 promoters and express full-length L1 mRNAs and proteins. Using nanopore long-read sequencing, we identify unmethylated L1s proximal to PV interneuron genes, including a novel L1 promoter-driven Caps2 transcript isoform that enhances neuron morphological complexity in vitro. These data highlight the contribution made by L1 cis-regulatory elements to PV interneuron development and transcriptome diversity, uncovered due to L1 mobility in this milieu.


Conflict of interest statement

The authors declare no competing interests.

Figures

Fig. 1
Fig. 1. L1 retrotransposition in PV interneurons.
a, L1-EGFP reporter schematic. A mobile human L1 (L1.3) is expressed from its native promoter, harbors epitope tagged ORF1 (T7) and ORF2 (3×FLAG) sequences, and carries an EGFP indicator cassette. The EGFP is antisense to the L1, incorporates a ɣ-globin intron in the same orientation as the L1 and is terminated by a polyadenylation signal (filled black lollipop). L1-EGFP retrotransposition removes the ɣ-globin intron, enabling EGFP expression. b, Example EGFP+ cells detected in the hippocampus. c, A representative confocal image of ORF1p (T7) immunostaining of L1-EGFP adult mouse brain. The image insets show a selected cell in merged and single channels for EGFP and ORF1p. d, As for c, except for ORF2p (3×FLAG) in cortex (CX). e, EGFP and PV immunostaining of L1-EGFP mouse coronal hippocampus sections. The yellow arrows indicate EGFP+ neurons. f, The percentage of hippocampal EGFP+ cells colocalized with NeuN and PV. ****P = 0.0001, one-way ANOVA with Tukey’s post-hoc test. g, The distribution of EGFP+/PV+ cells counted in the main hippocampal substructures. *P = 0.02, two-tailed t-test. h, EGFP+ cell counts in cortex and hippocampus (HIP). **P = 0.002, two-tailed t-test. Note: fh represent data as mean ± s.d., and N(mice) = 4. i, cL1spa reporter schematic. A mobile mouse L1 (L1spa) is expressed from its native monomeric 5′UTR, harbors a LoxP-Stop-LoxP cassette and carries an mCherry indicator cassette. Cre-Lox recombination removes the Stop, enabling L1spa transcription and retrotransposition. Primary neurons were electroporated (E) with cL1spa, then transduced with a Cre (C) lentivirus 4 days later, and results (R) were analyzed 8 days post-electroporation. j, mCherry splice junction PCR assay. The black arrows above the mCherry cassette (left) indicate oligo positions. 994 bp product: unspliced, 92 bp product: spliced. Gel lanes (left to right): molecular weight (MW) ladder, primary neurons electroporated with cL1spa with or without Cre, nontemplate control, L1spa plasmid positive control, pmCherry plasmid positive and cL1spa RT mutant negative control. The red and yellow arrows indicate the expected sizes of the spliced and unspliced DNA products, respectively. k, Representative confocal images of mCherry immunostaining in primary neurons upon Cre addition. The image insets show cells in merged (top) and single channels for mCherry, Cre, Tub and Hoechst (Hoe) (nuclei). The yellow arrows indicate mCherry+ neurons. l, As in k but showing mCherry and PV colocalization. m, As in k except showing mCherry immunostaining without Cre. Scale bars, 10 µm (be and km). Source data
Fig. 2
Fig. 2. L1 mRNA and ORF1p are abundant in PV interneurons.
a, Representative maximum intensity projection (MIP) confocal image of a coronal hippocampus section showing L1 TF (green) and PV (magenta) transcripts detected by RNA FISH, Tub, (red) immunohistochemistry and DAPI staining (blue). The image insets show higher magnification of a selected PV+ neuron (dashed rectangle). The dashed lines in the image insets demark nuclear and cellular boundaries defined for PV and L1 mRNA quantification. Scale bars, 10 μm. GCL, granular cell layer; SO, stratum oriens. b, L1 TF RNA FISH spot (puncta) count per cell in CA PV+/Tub+ and PV/Tub+ neurons. **P = 0.009, n(cells per mouse) = 29-31, N(mice) = 3. Cells from different mice are color coded. Dashed line, median; dotted lines, quartiles. c, As for b, except for DG. **P = 0.009, n = 9–10, N = 3. d, Multiplexed TaqMan qPCR measuring mRNA abundance of the L1 TF monomeric 5′UTR (VIC channel) relative to 5S rRNA (FAM channel) in PV+, PV, PV/Tub+ and PV/Tub cell populations. Cells were sorted from pooled neonate (P0) litter hippocampi. **P = 0.0022, N = 4 litters (one-way ANOVA with Tukey’s post-hoc test). e, TSS usage within full-length L1 TF copies, detected by L1-specific 5′RACE. RNA was obtained from bulk (blue, top) and sorted PV+ hippocampal cells (orange, bottom). The pie charts indicate the percentages of L1 TF mRNAs initiating at upstream TSSs, or TSSs in the L1 TF 5′UTR or body (ORF1). The L1 TF diagram provided underneath indicates the position of the L1-specific primer used for 5′RACE. f, Endogenous ORF1p expression in PV+ neurons. An MIP confocal image of a hippocampus coronal section showing PV (green), ORF1p (red) and NeuN (magenta) colocalization. The insets show a higher-magnification view of a selected PV+/ORF1p+/NeuN+ neuron. Hoechst stains nuclei. Scale bar, 10 μm. g, The percentages of PV+/NeuN+ and PV/NeuN+ neurons expressing ORF1p in hippocampus CA (regions 1–3). ****P = 0.0001, n = 1,017 average cells per mouse, N = 5. h, As for g, except in DG. ****P = 0.0001, n = 719, N = 5. Note: significance testing in b, c, g and h was via two-tailed t-test, comparing animal or litter mean values. Data in d, g and h are represented as mean ± s.d. Source data
Fig. 3
Fig. 3. SOX motif-dependent L1 activation by SOX6.
a, L1Hs schematic. 5′UTR embedded YY1- (orange) and SOX-binding (purple) sites are shown, with the latter numbered 1 and 2 and corresponding to L1Hs positions +470 to +477 and +570 to +577, respectively. These SOX motifs were scrambled (scr) or inverted (inv) in our L1 reporter assays. Site 1 more closely matched the JASPAR SOX6 binding site motif. b, L1 promoter assay. The native 5′UTR of the highly mobile L1Hs element LRE3 (top) was used to promote mGreenLantern (mGL) expression (S, seeding; T, transfection; M, change of medium; R, result analysis; filled lollipop, polyadenylation signal). The promoter strength is measured as the percentage of GFP+ sorted cells. LRE3 5′UTR plasmids, including those with scrambled or inverted SOX motifs, were cotransfected into HeLa cells with mCherry (middle) or SOX6-mCherry (right) expression vectors, with a higher percentage of GFP+ cells observed in the latter experiment (left). c, The reporter from b was cotransfected with mCherry or SOX2-mCherry expression vectors into wild-type (WT) and SOX6 stably overexpressing HeLa cells. d, L1 retrotransposition assay. The assay design (top) shows a highly mobile L1Hs element, L1.3 expressed from its native promoter (black arrow) and tagged with an EGFP cassette activated upon retrotransposition and driven by a CBh promoter (S, seeding; T, transfection; M, change of medium; R, result analysis; filled lollipop, polyadenylation signal). The retrotransposition efficiency is measured as the percentage of GFP+ sorted cells. Plasmids included positive (L1.3) and negative (L1.3 RT, D702A mutant) controls and L1.3 sequences with scrambled or inverted SOX motifs. Each element was assayed in WT (middle) and SOX6 stably overexpressing HeLa cells (right), with a higher percentage of GFP+ cells observed in the latter experiment (left). e, As for d, except conducted in WT PA-1 cells using a CMV promoter-driven EGFP cassette and cells were selected for puromycin resistance (PuroR). Note: histogram data in be are represented as mean ± s.d. with n = 3 biological replicates. Significance testing in b, d and e was via one-way ANOVA against the corresponding positive control (LRE3 5′UTR or L1.3) with Dunnett’s multiple comparison test (middle, right or only panel) or two-tailed t-test (left). Significance testing in c was via two-tailed t-test. *P < 0.05, **P < 0.01, ***P < 0.001. Source data
Fig. 4
Fig. 4. Global L1 TF promoter hypomethylation in PV interneurons.
a, Targeted bisulfite sequencing of L1 TF promoter monomer CpG islands was performed on PV+, PV and PV/Tub+ cells sorted from pooled hippocampal tissue from each of three neonate (P0) litters. Each cartoon displays 100 nonidentical randomly selected sequences, where methylated CpGs (mCpGs) and unmethylated CpGs are represented by black and white circles, respectively, as well as the overall mCpG percentage (red numbers). Amplicons above the dotted red line contain <5 mCpGs. b, L1 TF monomer methylation was significantly lower (*P = 0.02, one-way ANOVA with Tukey’s multiple comparison test) in PV+ neurons than in either PV or PV/Tub+ cells. c, Fully (mCpG = 0) and nearly (mCpG <5) unmethylated L1 TF monomers were found only in PV+ neurons. d, Dnmt3a mRNA abundance measured by qPCR in hippocampal cell populations, relative to Gapdh. **P = 0.01, one-way ANOVA with Dunnett’s multiple comparison test only to the PV+ population, N = 4 litters. e, As for d, except for Mecp2. **P = 0.005. f, CpG methylation ascertained by barcoded ONT sequencing upon matched hippocampal PV+ and PV cells from 11 separate neonate litter pools as well as PV/Tub+ and PV/Tub cells from one of those pools. Results are shown for the whole genome (divided into 10 kbp windows) and for CpG dinucleotides located within the 5′UTR of TF, GF, A-type and F-type L1s >6 kbp, or within B1 (>140 bp) and B2 (>185 bp) short interspersed elements (SINEs), and murine endogenous retrovirus L (MERVL) MT2 (>470 bp) and intracisternal A particle (IAP) (>320 bp) long terminal repeat sequences. Each included element accrued at least 20 methylation calls and 4 reads in each cell population. ****P = 0.0001, Kruskall–Wallis test comparing the PV+ population (N = 11 litter means) against the three PV populations combined (N = 13 litter means) followed by Dunn’s multiple comparison test. Note: histogram data are represented as mean ± s.d. Source data
Fig. 5
Fig. 5. PV interneuron genes harbor hypomethylated L1 TF promoters.
a, Composition of all young (left) and differentially methylated (diff. meth.) (P < 0.01) young (right) retrotransposons, by superfamily. Note: MERVL (murine endogenous retrovirus L) and IAP (intracisternal A particle) are LTR retrotransposons. b, As per a, except showing the breakdown of young L1 subfamilies (left) and their contribution to the 50 differentially methylated loci showing the largest absolute change in methylation percentage. c, L1 TFI, TFII and TFIII subfamily CpG methylation strip plots for PV+, PV, PV−/Tub+ and PV-/Tub cells, as represented collectively by the L1 TF violin plot in Fig. 4f. Each point represents an L1 locus, with an example intronic to Caps2 highlighted by an orange dot. ****P = 0.0001, Kruskall–Wallis test on PV+ population (N = 11 litter means) versus three PV populations combined (N = 13 litter means) followed by Dunn’s multiple comparison test. d, Composite DNA methylation profiles for the L1 TF subfamilies displayed in c, representing the mean methylation for CpGs within the first 2 kbp of elements with six monomers. Darker green shading represents the nonmonomeric 5′UTR region. e, Methylation profile of the Caps2 locus obtained from ONT sequencing. The first panel shows a full-length L1 TFIII with intact ORFs, as highlighted in c, orientated antisense to the first intron of the canonical Caps2.1 isoform. ENCODE long-read transcriptome sequencing of hippocampus tissue (ENCLB505CBY) indicated a chimeric transcript, labeled here Caps2.L1, spliced into Caps2.1 exon 3 and encoding an ORF in frame with the Caps2.1 ORF. The gel image displays PCR products generated using primers specific to Caps2.L1 (marked by opposing black arrows), with input template cDNA from bulk adult (P35) hippocampus (5′RACE) and neonate (P0) hippocampus (reverse-transcribed total RNA from bulk and sorted PV+ and PV cells). The red arrow indicates on-target products confirmed by capillary sequencing. The second panel displays aligned ONT reads, with unmethylated CpGs colored in orange (PV+), purple (PV), blue (PV/Tub+) and green (PV/Tub), and methylated CpGs colored black. The third panel indicates the relationship between CpG positions in genome space and CpG space, including those corresponding to the L1 TFIII 5′UTR (shaded light green). The fourth panel indicates the fraction of methylated CpGs for each cell type across CpG space. MW, molecular weight. Source data
Fig. 6
Fig. 6. Caps2.L1 enhances neuron morphological complexity and Ntf3 release.
a, Caps2 mRNA expression construct design (left). Each is expressed from a CAG promoter. The Caps2.L1 ORF (blue) is larger than that of Caps2.1 and encodes an alternative N-terminus, whereas the Caps2.L1Δ3072 construct is identical to Caps2.L1 except with a 4 bp deletion at position 3,072 that results in a truncated Caps2.L1 ORF. All constructs have an mCherry cassette driven by an EFS promoter on their backbone. An empty mCherry vector was used as a transfection control. The black arrows represent promoters. The filled lollipops indicate polyadenylation signals. N2a neuroblastoma cells were transfected with each construct (left) and differentiated, and the morphology type (right) of mCherry+ cells was quantified (middle). Observed morphological types were classified as: (1) bipolar (orange), (2) unipolar (green), (3) multipolar (simple) (red) or (4) multipolar (complex) (blue). Each histogram data point represents the average of values from an independent experiment. N = 3 experiments, n = 10 cells per experiment. b, Caps2 constructs assayed as in a but here showing the number of primary branches per cell. c, Ntf3 integrated mean immunofluorescence intensity in cell soma. N = 3 experiments, n = 95 cells per experiment. d, Ntf3 release quantified as Ntf3 spots per cell, outside of the soma. Analysis was performed on high-magnification confocal images within a fixed radius set around the cell soma. N = 3 experiments, n = 8–10 cells per experiment Note: in each histogram, experimental replicates are colored different shades of gray and data are represented as mean ± s.d. Significance values were calculated on the basis of the averages of independent experiments via two-way ANOVA with Šidák’s post-hoc test in a and one-way ANOVA with Tukey’s post-hoc test in bd. *P < 0.05, **P < 0.01, ***P < 0.001. Source data
Fig. 7
Fig. 7. Model of L1 activation by SOX6 in mouse PV interneurons.
Full-length L1 mRNA transcription and L1 protein expression occur in PV interneurons (top) and may be influenced by environmental cues or contribute to neuron functional diversity. L1 promoter elements are stimulated by SOX6 in the PV interneuron lineage (bottom), driving transcription of chimeric RNAs formed with adjacent genes, such as Caps2, and potentially increasing L1 mobility.
Extended Data Fig. 1
Extended Data Fig. 1. Assessment of L1 retrotransposition in brain and non-brain tissues of L1-EGFP animals.
a, EGFP cassette genotyping PCR results for the offspring of founder animal #1.2. Circles and squares represent female and male mice, respectively. The 1.7kbp PCR product (red arrow) corresponds to the integrated intron-containing EGFP indicator cassette. Gel labels are as follows: mw, molecular weight (ladder); 1-5, transgenic offspring littermates; +, EGFP positive control plasmid DNA; -, H20. Offspring 2, 4 and 5 carried the L1-EGFP transgene. b, Ovary and testis c, heart d, muscle and e, liver tissues of adult L1-EGFP mice were immunostained for EGFP and L1 proteins (T7-tagged ORF1p and 3×FLAG-tagged ORF2p). EGFP+ cells were observed in the interstitial cells of the ovaries but not in other tissues. DNA was stained with Hoechst dye (blue). f, Representative maximum intensity projection confocal image of a coronal hippocampus section from a transgenic L1-EGFP animal showing immunostaining for EGFP (green) and the interneuron marker Gad1 (red). Yellow arrowheads indicate EGFP+/Gad1+ neurons in DG. The image is presented as merged and single channels for EGFP and Gad1. Scale bar: 100 µm. Source data
Extended Data Fig. 2
Extended Data Fig. 2. Retrotransposition of an engineered mouse L1 delivered to cultured neurons.
a, Primary neurons were electroporated with an L1spa reporter construct driven by its native promoter and carrying an mCherry indicator cassette. The mCherry is antisense to the L1, incorporates a ɣ-globin intron in the same orientation as the L1, and is terminated by a polyadenylation signal (filled black lollipop). Retrotransposition removes the ɣ-globin intron, enabling mCherry expression. Experimental timeline is shown below the schematic. Circles represent days in culture, E: electroporation, R: analysis. b, Example of a degenerating neuron expressing mCherry (red) and parvalbumin (PV, green). c, Representative confocal images of H2A.X (magenta) immunostaining of neurons (Tub, green) shows DNA breaks in mCherry neurons after L1spa electroporation. Immunostaining of L1spa RT mutant (retrotransposition negative control) and no electroporation controls are shown in the panels below. d, Representative confocal images of cL1spa reporter electroporation showing mCherry (red) and SOX6 (magenta) colocalization in primary neurons upon Cre addition. Note: scale bars in (b-d) indicate 10 µm.
Extended Data Fig. 3
Extended Data Fig. 3. Retrotransposition of an engineered mouse L1 delivered in utero.
a, Schematic representation of L1-EGFP reporter in utero electroporation (IUE). A coronal view of electrode positioning is shown at left. Embryos were co-injected with pmCherry (where a CMV promoter controls mCherry expression) and a second plasmid, carrying a mouse L1 tagged with an EGFP indicator cassette (pUBC-L1SM-UBC-EGFP), into the left hemisphere. As a negative control, embryos were co-injected with pmCherry and a disabled L1 reporter plasmid (pMut2-UBC-L1SM-UBC-EGFP) into the right hemisphere. The red inset, shown at right, displays a coronal section of an electroporated mouse brain with pmCherry visible in the targeted hippocampal region. Scale bar indicates 100 µm. IUE was performed on embryonic day (E)14.5. Embryos were born and then sacrificed at postnatal day (P)10. Note: UBC-L1SM-UBC-EGFP consists of a heterologous UBC promoter driving expression of a synthetic mouse L1 TF (L1SM) containing a native L1 monomeric 5′UTR promoter, codon-optimized ORF1 and ORF2 sequences, the 5′ part of the L1 3′UTR, and an intron-interrupted EGFP indicator cassette with its own UBC promoter and polyadenylation signal (pA). In this system, a cell becomes EGFP positive only when the L1-EGFP mRNA is transcribed, spliced, reverse transcribed and integrated into the genome, allowing a functional EGFP to be expressed from its UBC promoter. Mut2-UBC-L1SM-UBC-EGFP is the same as UBC-L1SM-UBC-EGFP, except it carries mutations known to disable ORF2p reverse transcriptase and endonuclease activities. b, Example maximum intensity projection confocal image of a hippocampus section from an embryo electroporated with UBC-L1SM-UBC-EGFP. A PV+ (magenta), mCherry+ (red), NeuN+ (blue), EGFP+ cell is indicated with a yellow arrowhead. c, No EGFP+ cells were found for the retrotransposition-incompetent Mut2-UBC-L1SM-UBC-EGFP plasmid. An empty arrowhead points to a PV+, NeuN+, mCherry, EGFP cell. Note: scale bars in (a) and (b) indicate 10 µm.
Extended Data Fig. 4
Extended Data Fig. 4. Single-molecule L1 TF RNA FISH experimental design.
a, L1 TF RNAscope probe A consisted of 20 ‘ZZ’ oligo pairs targeting the L1 TF 5ʹUTR monomeric and non-monomeric region (consensus positions 827 to 1688). b, L1 TF probe B was composed of 17 ZZ oligo pairs and targeted the L1 TF 5ʹUTR monomeric region (positions 142 to 1423). c, Imaris analysis performed on Z-stack images of L1 TF and PV RNA FISH coronal hippocampus sections immunostained for Tub. Imaris workflow: 1: neuron identification, based on cytoplasmic Tub (red) fluorescence, and cell volume drawing, 2: nucleus definition by DAPI (blue) staining followed by drawing of nuclear volume, 3: delineation of cell and nucleus surfaces, 4: cell surface masking to eliminate voxels outside the cell, 5: nucleus surface masking to exclude voxels inside the nucleus, and 6: L1 TF mRNA (green) fluorescence signal within the defined cytoplasmic volume. d, Maximum intensity projection confocal images of hippocampal sections showing L1 TF probe A (green) and PV (magenta) RNA FISH, and Tub (red) immunohistochemistry. Dashed lines demark nuclear and cellular boundaries defined for PV and L1 mRNA quantification. Selected PV and PV+ neurons are shown top and bottom, respectively. e, Confocal images of hippocampal sections treated with either DNase or RNase and subsequently processed for RNAscope using the L1 TF probe A (green). f, Confocal images of N2a cells transfected with either mouse L1 construct (pL1SM-mCherry) or control (pmCherry) showing specificity of L1 TF RNA FISH probe A (green) signal in cells expressing the L1 construct. g, As for (f), except performed on HEK293T cells and showing specificity of L1 TF RNA FISH probe B (green) in cells expressing the L1 construct. h, Schematic showing L1 TF sequences assayed by RNA FISH and TaqMan qPCR. Scale bar for (d-g): 10 μm.
Extended Data Fig. 5
Extended Data Fig. 5. Additional L1 TF RNA FISH data for hippocampus and cortex.
a-c, Number of L1 TF RNA FISH (probe B) spots in PV+/Tub+ neurons (orange plot) and PV/Tub+ neurons (blue plot) in CA (a), DG (b) and CX (c). **P = 0.003, *P = 0.03 and *P = 0.01 for (a), (b) and (c), respectively. Two-tailed t test comparing animal means, n(cells)=2-10, N(mice)=3-4. Solid line: median. Dashed lines: quartiles. Source data
Extended Data Fig. 6
Extended Data Fig. 6. Elevated L1 transcription in PV interneurons.
a, Multiplexed TaqMan qPCR measuring mRNA abundance of the L1 TF non-monomeric 5ʹUTR sequence (FAM channel) relative to Gapdh (VIC channel) in sorted PV+, PV, PV/Tub+ and PV/Tubcells. Cells were sorted from pooled neonate litter hippocampi. N = 4 litters. b, As for (a), except relative to URR1 repetitive DNA (HEX channel). *P = 0.015. c, As for (a), except measuring L1 TF ORF2 (FAM channel) relative to Gapdh (VIC channel). Data are represented as mean ± SD. Significance values were calculated via one-way ANOVA with Tukey’s post-hoc test. Source data
Extended Data Fig. 7
Extended Data Fig. 7. L1 ORF1p antibody specificity.
Confocal images of HeLa cells transfected with either a HA-tagged ORF1p (L1spa) expression vector or with transfection reagents alone (mock), showing specificity of the ORF1p antibody (green) in human cells expressing mouse ORF1p. Scale bar 10 μm.
Extended Data Fig. 8
Extended Data Fig. 8. L1 activation by the LHX6/SOX6 transcriptional program.
a, The L1Hs 5ʹUTR, with YY1- (orange) and SOX-binding (purple) sites marked, is shown above MapRRCon profiles of ENCODE K562 SOX6 and YY1 ChIP-seq binding and chromatin accessibility profiles in human hippocampal tissue as measured by scATAC-seq. Cells were grouped based on selected accessible genes to define neural cell populations (PV: parvalbumin inhibitory interneuron, EXC: excitatory neurons, VIP: vasoactive intestinal polypeptide-expressing inhibitory interneurons, GFAP: glia). b, Lhx6, Sox2, Sox5, Sox6, Sox11 and Caps2 expression in excitatory (EXC) pyramidal neuron, PV interneuron and VIP interneuron cortex populations defined by Mo et al., measured by RNA-seq tags per million (TPM). N = 2. c, Proportion of ATAC-seq reads aligned to peaks associated with full-length L1 TF copies in neuronal populations defined by Mo et al. N = 2. d, L1Hs subfamily expression measured by RNA-seq TPM in neurons derived via in vitro differentiation of induced pluripotent stem cells, with (LHX6↑) and without (control) LHX6 overexpression. *P = 0.03, two-tailed t test, N = 3. e, L1 TF family expression measured by RNA-seq TPM in bulk hippocampus of animals with (Ctcf cKO) and without (control) conditional knockout of Ctcf and associated induction of Lhx6 expression. *P = 0.01, two-tailed t test, N = 3. Note: histogram data in (d,e) are represented as mean ± SD. Source data
Extended Data Fig. 9
Extended Data Fig. 9. SOX6 overexpression is associated with increased L1 transcription and ORF1p expression in primary neuronal cultures.
a, Confocal images of mouse primary neuronal cultures showing SOX6 (red) expression in Tub+ (green) neurons. b, Primary neuronal cultures after 5 days in vitro were transiently transduced with AAV2 vectors carrying either mCherry or a mouse SOX6 construct (mSOX6-T2A-mCherry) under the control of a CBh promoter. qPCR analysis at 12 and 24 h post-transduction revealed a significant increase in SOX6 mRNA expression in mSOX6-T2A-mCherry transduced cultures compared to mCherry controls. *P < 0.03, two-way ANOVA with Tukey’s multiple comparison test, N = 4. c, TaqMan qPCR measuring abundance of the L1 TF mRNA monomeric 5ʹUTR (VIC channel) relative to 5 S rRNA (FAM channel) in mCherry versus mSOX6-T2A-mCherry 24 h post-transduction. *P = 0.012, paired two-tailed t test, N = 4. d, Images showing L1 ORF1p (magenta), mCherry (red) and Tub (green) immunostaining in neurons 72 h post-transduction with AAV2-mCherry. e, As per (d), except for mSOX6-T2A-mCherry. f, Analysis of L1 ORF1p intensity in mCherry+ neurons shows significantly more ORF1p expression in mSOX6-T2A-mCherry transduced neurons than in mCherry controls. *P = 0.015, two-tailed t test, N = 3 transductions, n = 10-12 cells quantified per experiment. Note: data in (b), (c) and (f) are from independent experiments, with replicates color coded and represented as mean ± SD. Scale bar: 10 μm. Source data
Extended Data Fig. 10
Extended Data Fig. 10. Hypomethylated L1s in PV interneuron genes, as identified by ONT sequencing.
a, Methylation profile of a full-length L1 TFIII element with intact ORFs, intronic to Chl1. The first panel shows the L1 orientated in sense to the last intron of Chl1. The second panel displays aligned ONT reads, with unmethylated CpGs colored in orange (PV+) and purple (PV), blue (PV/Tub+) and green (PV/Tub), and methylated CpGs colored black. The third panel indicates the relationship between CpG positions in genome space and CpG space, including those corresponding to the L1 TFIII 5ʹUTR (shaded light green). The fourth panel indicates the fraction of methylated CpGs for each cell type across CpG space. b, As for (a), except displaying an L1 TFIII antisense and intronic to Erbb4.

References

    1. Kazazian HH, Jr, Moran JV. Mobile DNA in health and disease. N. Engl. J. Med. 2017;377:361–370. - PMC - PubMed
    1. Moran JV, et al. High frequency retrotransposition in cultured mammalian cells. Cell. 1996;87:917–927. - PubMed
    1. Wei W, et al. Human L1 retrotransposition: cis preference versus trans complementation. Mol. Cell. Biol. 2001;21:1429–1439. - PMC - PubMed
    1. Feng Q, Moran JV, Kazazian HH, Jr, Boeke JD. Human L1 retrotransposon encodes a conserved endonuclease required for retrotransposition. Cell. 1996;87:905–916. - PubMed
    1. Luan DD, Korman MH, Jakubczak JL, Eickbush TH. Reverse transcription of R2Bm RNA is primed by a nick at the chromosomal target site: a mechanism for non-LTR retrotransposition. Cell. 1993;72:595–605. - PubMed

LinkOut - more resources