. 2024 May 21;25(1):128.
doi: 10.1186/s13059-024-03270-2.

Diurnal control of iron responsive element containing mRNAs through iron regulatory proteins IRP1 and IRP2 is mediated by feeding rhythms

Affiliations

Diurnal control of iron responsive element containing mRNAs through iron regulatory proteins IRP1 and IRP2 is mediated by feeding rhythms

Hima Priyanka Nadimpalli et al. Genome Biol. .

Abstract

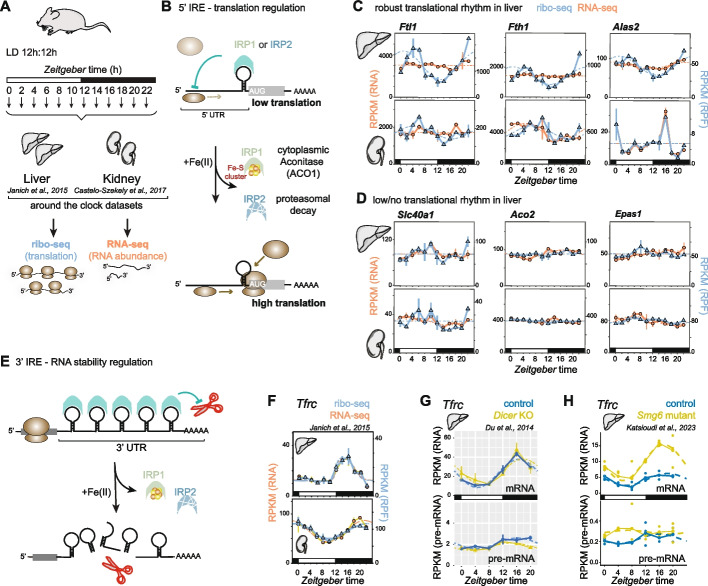
Background: Cellular iron homeostasis is regulated by iron regulatory proteins (IRP1 and IRP2) that sense iron levels (and other metabolic cues) and modulate mRNA translation or stability via interaction with iron regulatory elements (IREs). IRP2 is viewed as the primary regulator in the liver, yet our previous datasets showing diurnal rhythms for certain IRE-containing mRNAs suggest a nuanced temporal control mechanism. The purpose of this study is to gain insights into the daily regulatory dynamics across IRE-bearing mRNAs, specific IRP involvement, and underlying systemic and cellular rhythmicity cues in mouse liver.

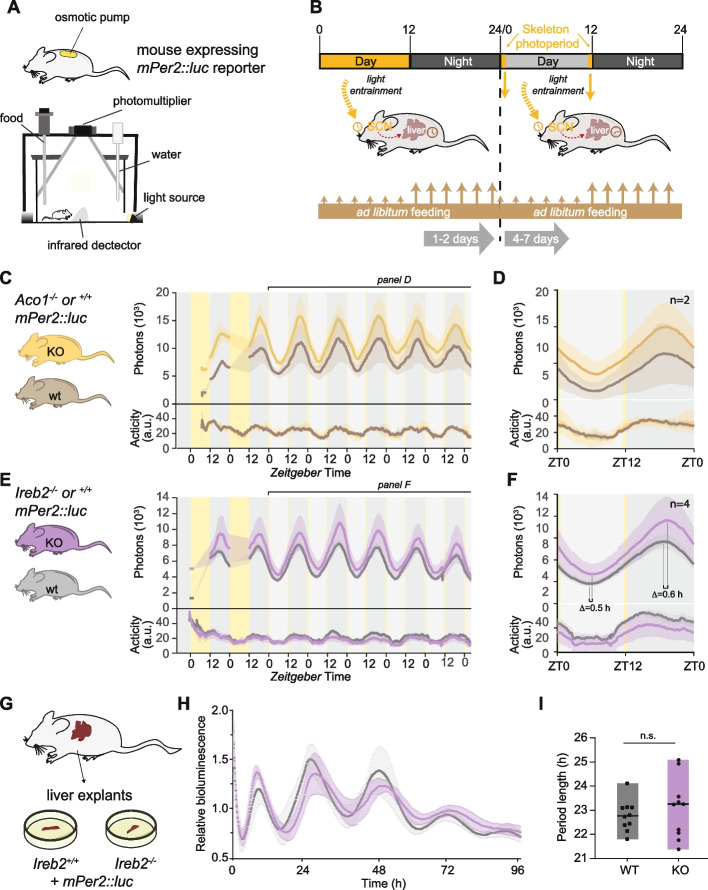
Results: We uncover high-amplitude diurnal oscillations in the regulation of key IRE-containing transcripts in the liver, compatible with maximal IRP activity at the onset of the dark phase. Although IRP2 protein levels also exhibit some diurnal variations and peak at the light-dark transition, ribosome profiling in IRP2-deficient mice reveals that maximal repression of target mRNAs at this timepoint still occurs. We further find that diurnal regulation of IRE-containing mRNAs can continue in the absence of a functional circadian clock as long as feeding is rhythmic.

Conclusions: Our findings suggest temporally controlled redundancy in IRP activities, with IRP2 mediating regulation of IRE-containing transcripts in the light phase and redundancy, conceivably with IRP1, at dark onset. Moreover, we highlight the significance of feeding-associated signals in driving rhythmicity. Our work highlights the dynamic nature and regulatory complexity in a metabolic pathway that had previously been considered well-understood.

Keywords: Circadian clocks; IRE; IRP; Iron metabolism; Liver; Ribosome profiling; Translation.


Conflict of interest statement

The authors declare that they have no competing interests.

Figures

Fig. 1
Fig. 1
Transcript- and tissue-specific rhythmicity of IRE-containing mRNAs. A Schematic of the dataset collection carried out for the studies [6, 17] for the liver and kidney gene expression graphs shown in panels C and D (below). B Schematic model of IRP activity on 5′ IREs. IRP1 and IRP2 bind to IRE hairpins under conditions of low iron, thereby inhibiting scanning ribosomes from accessing the start codon. When iron is abundant, IRP1 assembles an Fe–S cluster, converting it to cytoplasmic Aconitase (ACO1) that is unable to bind IREs. IRP2 is degraded in an iron-dependent proteasomal pathway that relies on an iron-sensor F-box protein, FBXL5. After the removal of IRPs from the 5′ IRE sequence, ribosomes can translate the coding sequence (CDS). C RPKM values of CDS-mapping ribosome protected fragment (RPF) data (blue) and RNA-seq data (orange) from the datasets of [6, 17] for the transcripts Ftl1, Fth1 and Alas2 around the 24-h daily cycle in the liver (upper) and kidney (lower). All three genes show high-amplitude translation in the liver. Means per timepoint are plotted; “error bars”/vertical lines connect the two biological replicates. Dashed lines represent rhythmic curve fittings to the data, as described in [6]. D As in panel C, but for the non-/less-rhythmically translated IRE-containing transcripts Slc40a1/Ferroportin, Aco2, Epas1/Hif2a. E For 3′ UTR IREs, the binding of IRPs inhibits access to endonucleases (depicted as red scissors) that would otherwise initiate transcript degradation. When IRPs dissociate due to the mechanisms described in panel B, the mRNA is destabilised and becomes less abundant. Tfrc mRNA is the best-known example of this kind and contains five IREs. F RPKM values of CDS-mapping ribosome protected fragment (RPF) data (blue) and RNA-seq data (orange) from the datasets of [6, 17] for the Tfrc transcript around the 24-h daily cycle in the liver (upper) and kidney (lower). Means per timepoint are plotted; “error bars”/vertical lines connect the two biological replicates. Dashed lines represent rhythmic curve fittings to the data, as described in [6]. G Expression plots (RPKM) showing around-the-clock data from [24] for Tfrc mRNA (exonic reads; upper panel) and pre-mRNA (intronic reads; lower panel) in control (blue) and miRNA-deficient (Dicer KO) livers (yellow). Means per timepoint are plotted; “error bars”/vertical lines connect the two biological replicates. The two time series are plotted together in the same graph (vertical lines connect the data points from the two series). Rhythms are seen for mRNA but not for pre-mRNA, indicating that oscillations are post-transcriptionally generated (RNA stability). Dashed lines represent rhythmic curve fittings to the data, as described in [24]. H Expression plots for around-the-clock RNA-seq data from [25] for Tfrc showing mRNA (top panel; exonic reads) and pre-mRNA (bottom panel; intronic reads) for Smg6 mutants (yellow) and controls (blue). RPKM values of individual mouse livers are shown as dots with solid lines connecting the means across time points. Dashed lines represent rhythmic curve fittings to the data, as described in [25]
Fig. 2
Fig. 2
Rhythmic regulation is consistent with diurnal IRP activity and low and high IRP2 abundance at ZT5 and ZT12. A Schematic representation of the model deduced from the gene expression data from Fig. 1C (rhythmic 5′ IREs for Ftl1, Fth1 and Alas2) and Fig. 1F-H (rhythmic 3′ IRE for Tfrc). The observed rhythms are consistent with minimal and maximal IRP activity at the light-phase (ZT5) and light–dark transition (ZT12) timepoints, respectively. B As in Fig. 1C, RPKM values of CDS-mapping ribosome protected fragment (RPF) data (blue) and RNA-seq data (orange) from the datasets of [6, 17] for the transcripts Aco1 (encoding IRP1) and Ireb2 (encoding IRP2) around the 24-h daily cycle in the liver (upper) and kidney (lower). Means per timepoint are plotted; “error bars”/vertical lines connect the two biological replicates. Dashed lines represent rhythmic curve fittings to the data, as described in [6]. C Expression plots (RPKM) showing around-the-clock data from [24] for the indicated transcripts, Aco1 and Ireb2, for mRNA (exonic reads; blue) and pre-mRNA (intronic reads; magenta) in control livers. The data from the miRNA-deficient (Dicer KO) livers were omitted from these analyses. Means per timepoint are plotted; “error bars”/vertical lines connect the two biological replicates. Dashed lines represent rhythmic curve fittings to the data, as described in [24]. D As in C, but for transcripts Arntl/Bmal1 and Dbp. E Western blot analysis of total liver proteins (pool of three mice per sample), for ACO1/IRP1 and VINCULIN (loading control), from control mice (blue; on left side) and Smg6 mutant mice (yellow; on right side). The same samples as in [25] were used. F Quantification of Western blot from E. ACO1/IRP1 intensities were normalised to control band intensities (VINCULIN). G Western blot analysis of total liver proteins as in E, for IREB2/IRP2 and VINCULIN (loading control). H Quantification of Western blot from G. IREB2/IRP2 intensities were normalised to control band intensities (VINCULIN). I Western blot analysis of total liver proteins from individual animals for IREB2/IRP2; the same extracts that constituted the pools ZT4 and ZT12 (control series) in panel G were used. J Quantification of Western blot from I. IREB2/IRP2 intensities were normalised to control band intensities (VINCULIN). Statistical significance evaluated via Student’s t-test. K Western blot analysis for FBXL5 and VINCULIN (loading control) in total liver proteins from the control series samples from [25]. Left side of blot: around-the-clock, pool of three mice per sample; right side: individiual mice, as in panel I. L Quantification of around-the-clock data from Western blot from K. FBXL5 intensities were normalised to control band intensities (VINCULIN). M Quantification of Western blot from individual livers at ZT4 and ZT12 from (K), right part of the blot. FBXL5 intensities were normalised to control band intensities (VINCULIN). Statistical significance evaluated via Student’s t-test
Fig. 3
Fig. 3
In vivo bioluminescence recoding shows that entrained circadian rhythms in the liver are unperturbed in mice that are deficient for Aco1 or Ireb2. A Cartoon depicting the in vivo recording setup (RT-Biolumicorder) used to measure diurnal bioluminescence rhythms in freely moving mice. The mouse is implanted with a luciferin-charged osmotic minipump and dorsally shaved to ensure the detectability of photons emitted from the liver. It is then placed in the arena of the RT-Biolumicorder that records photons via a photomultiplier tube (PMT), activity via infrared detection, and also offers the possibility to program food availability and illumination. B Schematic representation of the applied recording protocol in the RT-Biolumicorder setup. Mice expressing the Per2::Luc reporter and implanted with the minipump are placed in the RT-Biolumicorder where they are first subject to LD12:12 schedule and ad libitum feeding for 1–2 days, allowing for acclimation to the setup. Bioluminescence recording only occurs during the dark phase. Then, the illumination schedule is changed to a skeleton photoperiod, i.e. two 30-min light pulses applied at times corresponding to the beginning and to the end of the light phase in a 12-h-light–12-h-dark (LD12:12) cycle. Recording occurs throughout the day with the exception of the duration of the 30-min light pulses. The skeleton photoperiod is important as it keeps the SCN clock entrained to a defined 24-h T-cycle, allowing to specifically query potential changes in the entrained liver clock. C Bioluminescence rhythms and activity traces were recorded with the protocol shown in B from mice deficient for Aco1 (ochre, N = 2) and controls (grey, N = 2). Mean signal (solid trace) and SEM (shaded) over the whole course of the experiment are shown. D Compiled data of C, averaging all cycles from day 3. No change in PER2::LUC phase was detectable between genotypes. E Bioluminescence rhythms and activity traces were recorded with the protocol shown in B from mice deficient for Ireb2 (purple, N = 4) and controls (grey, N = 4). Mean signal (solid trace) and SEM (shaded) over the whole course of the experiment are shown. F Compiled data of E, averaging all cycles from day 3. For Ireb2−/− mice, PER2::LUC peak and trough phases were slightly delayed as compared to the control mice with the same genetic background. G Schematic of liver explant rhythm measurements from the two genotypes, Ireb2−/− and controls, using male mice from the same breedings. Mice carried the Per2::Luc reporter allele. H Liver explant bioluminescence recording from Ireb2−/− (purple) and control (grey) mice. Free-running circadian traces show mean signal and SEM for the two genotypes over a recording period of 96 h. N = 10 per genotype. I Period length quantification of experiments shown in H. No significant change in period length was detectable (Mann–Whitney test). Ireb2 knockout period lengths appeared more variable than controls
Fig. 4
Fig. 4
Time-resolved datasets allow analysis of IRP1- vs. IRP2-dependence of rhythmic regulation. A Schematic representation of the selection of timepoints for the ribo-seq experiment. Thus, high Ftl1, Fth1 and Alas2 translation efficiency and low Tfrc abundance, conceivably as a result of mRNA instability, occur in the light phase of the day, leading us to predict low IRP activity around ZT5. By contrast, low Ftl1, Fth1 and Alas2 translation efficiency and the rise in Tfrc abundance at the light–dark transition suggest high IRP activity at ZT12. B Schematic of the experiment carried out to assess timepoint- and genotype-specific ribosome profiling in the two IRP-deficient mouse strains and matched controls. Thus, 3 animals each were sacrificed at ZT5 and ZT12, for genotypes Aco1+/+ (dark grey), Aco1−/− (ochre), Ireb2+/+ (light grey), Ireb2−/− (purple). Livers were further processed for ribo-seq and RNA-seq. C Quantification of ribosome-protected fragments (RPF, top) and RNA abundance (middle) and relative translation efficiency (log2 ratio of RPF/RNA) for the Aco1 transcript in Aco1 knockout mice and their matched controls, for the two timepoints ZT5 and ZT12. Read count is normalised to library depth. Statistical significance was evaluated by unpaired t-test and indicated with asterisks (*** P < 0.001, ** P < 0.01, * P < 0.05). D As in C, for the Aco1 transcript in Ireb2 knockout mice and their matched controls. E Quantification of ribosome-protected fragments (RPF, top) and RNA abundance (middle) and relative translation efficiency (log2 ratio of RPF/RNA) for the Ireb2 transcript in Aco1 knockout mice and their matched controls, for the two timepoints ZT5 and ZT12. Read count is normalised to library depth. Statistical significance was evaluated by unpaired t-test and indicated with asterisks (** P < 0.001, ** P < 0.01, * P < 0.05). F As in E, for the Ireb2 transcript in Ireb2 knockout mice and their matched controls. G Western blot analysis of total protein extracts from the livers used for the gene expression profiling in panels C and D, i.e. the Aco1−/− and matched Aco1+/+ mice. VINCULIN was used as a loading control to normalise ACO1/IRP1 and IREB2/IRP2 signals. H Quantification of Western blot signals for ACO1/IRP1 (normalised for loading via VINCULIN) from panel G. No ACO1 is detectable in the Aco1−/− animals, as expected. ACO1 abundance is identical in the control animals at ZT5 and ZT12. I Quantification of Western blot signals for IREB2/IRP2 (normalised for loading via VINCULIN) from panel G. IREB2 is slightly upregulated in the Aco1−/− vs. Aco1+/+ animals (not significant). IREB2 levels are increased at ZT12 vs. ZT5 (** P < 0.01, one-way ANOVA with Šídák’s multiple comparisons test). J As in G, but for the Ireb2−/− and matched Ireb2+/+ animals whose livers were used for gene expression analysis in panels E and F. K Quantification of Western blot signals for ACO1/IRP1 (normalised for loading via VINCULIN) from panel J. Differences between timepoints or genotypes (Ireb2−/− vs. Ireb2+/+) were statistically not significant (one-way ANOVA with Šídák’s multiple comparisons test). L Quantification of Western blot signals for IREB2/IRP2 (normalised for loading via VINCULIN) from panel J. IREB2 is undetectable in Ireb2−/− mice as expected. The upregulation from ZT5 to ZT12 is statistically significant (* P < 0.05, Student’s t-test)
Fig. 5
Fig. 5
Timepoint- and transcript-dependence of derepression upon loss of ACO1/IRP1 vs. IREB2/IRP2. A Translation efficiency analysis for Ftl1 at ZT5 and ZT12 in the Aco1 line (Aco1−/− vs. Aco1+/+ in ochre and grey, respectively) in the left panel and for Ireb2 line (Ireb2−/− vs. Ireb2+/+ in purple and grey, respectively) in the right panel. Statistical significance was evaluated by unpaired t-test and indicated with asterisks (*** P < 0.001, ** P < 0.01, * P < 0.05). B As in A, for Fth1. C As in A, for Alas2. D RPF (upper) and RNA (lower) normalised reads for Tfrc at ZT5 and ZT12 in the Aco1 line (Aco1−/− vs. Aco1+/+ in ochre and grey, respectively) in the left panel and for Ireb2 line (Ireb2−/− vs. Ireb2+/+ in purple and grey, respectively) in the right panel. Statistical significance was evaluated by unpaired t-test and indicated with asterisks (*** P < 0.001, ** P < 0.01, * P < 0.05). E As in A, for Slc40a1. F As in A, for Epas1. G As in A, for Aco2. H As in D for Slc11a2/Dmt1. I K-means clustering analysis on z-score-transformed TE profiles across all eight conditions (2 timepoints, 4 genotypes; replicate means were used). The numbering of the 15 clusters and the gene count are given below the heatmap. Below the clusters, the known/validated IRE-containing transcripts are highlighted in red, with (Tfrc and Slc11a2 in parentheses, given that their IRE-regulation is not at the level of TE, but of RNA stability). Predicted IRE-like mRNAs from a list in [47] are highlighted in orange. Note that the two most rhythmically translated IRE-containing mRNAs, Ftl1 and Fth1 are found together in cluster 8. Several other IRE transcripts are enriched in cluster 13. J Hierarchical clustering according to the similarity in TE profiles for transcripts in cluster 8 from panel I. Ftl1 and Fth1 cluster together (marked in red). K Zoom into the part of cluster 8 that contains Ftl1 and Fth1 in the direct vicinity (marked in red). The unsupervised clustering thus confirms that these two transcripts indeed have a distinct mode of (rhythmic) regulation that sets them apart from other transcripts, even IRE-containing ones. L Hierarchical clustering according to the similarity in TE profiles for transcripts belonging to cluster 13 from panel I, which contains several validated (red) and predicted (orange) IRE-containing transcripts, possibly indicating common regulatory mechanisms and, in particular, similar “set-points”
Fig. 6
Fig. 6
Tfrc oscillations follow feeding/fasting rhythms rather than the circadian clock. A Plotting of liver Tfrc expression data from the study by Greco et al. [56], which included two feeding paradigms (ad libitum vs. night-restricted) and three genotypes (WT, full-body clock-deficient Arntl/Bmal1 KO, liver re-expression Arntl/Bmal1). The upper panel shows that night-restricted feeding exacerbates rhythmicity. The middle panel shows that night-restricted feeding restores rhythmicity in an otherwise circadian clock-deficient animal. A similar outcome is seen in the Bmal1 re-expression animals shown in the lower panel. B Analogous to A using the data from Atger et al. [7] that contains both mRNA and pre-mRNA reads. Thus, under night-restricted feeding, wild-type and clock-deficient Arntl/Bmal1 knockout animals show near-identical Tfrc oscillations (upper panel). These oscillations are post-transcriptionally generated, given that Tfrc pre-mRNA levels are not rhythmic (lower panel). C Analogous to A and B using the data from Greenwell et al. [57]. The upper panel compares ad libitum and night-restricted feeding effects on Tfrc, with the latter showing higher-amplitude rhythms. The lower panel shows the loss of Tfrc rhythms in wild-type animals (i.e. containing a functional clock) when feeding becomes gradually less rhythmic. D Analysis of the dataset from Manella et al. [58] which compares wild-type animals that are ad libitum-fed vs. exclusively day-fed. Day-feeding inverts the Tfrc rhythmicity. E Measurement of tissue iron levels at ZT5 and ZT12 across liver samples from the Aco1 KO/controls in ochre and the Ireb2 KO/controls in violet (same animals as in Fig. 4). Eight additional liver samples from independent, age-matched male mice (C57BL/6 background) were included, in black, to obtain more replicates in the controls. Still, the differences between ZT5 and ZT12 were not significant. Indicated comparisons between Aco1 KO vs. controls and Ireb2 KO vs. control were significant for Fe(III) and Fe(II + III), in line with iron storage phenotype. Two-tailed, unpaired, parametric t-test. F Proposed model for rhythmic regulation of IRP/IRE activity. Left side — during the light phase (ZT5, coinciding with fasting phase in ad libitum fed mice): IRP2 levels are relatively lower, but still able to exert some translational inhibition on their targets. This is why in Ireb2/Irp2-deficient animals, depression is seen. IRP1 is less active, likely due to Fe–S cluster assembly that precludes its IRE binding and this may be brought about by increased Fe(II) levels or other cues such as oxygen fluctuations. Right side — at beginning of dark phase (ZT12, feeding phase): IRP2 is abundant and actively repressing, but IRP1 is also active and can compensate for the loss of IRP2 in the corresponding Ireb2/Irp2-deficient animals

References

    1. Cox KH, Takahashi JS. Circadian clock genes and the transcriptional architecture of the clock mechanism. J Mol Endocrinol. 2019;63:R93–R102. - PMC - PubMed
    1. Partch CL, Green CB, Takahashi JS. Molecular architecture of the mammalian circadian clock. Trends Cell Biol. 2014;24:90–99. - PMC - PubMed
    1. Bolshette N, Ibrahim H, Reinke H, Asher G. Circadian regulation of liver function: from molecular mechanisms to disease pathophysiology. Nat Rev Gastroenterol Hepatol. 2023;20:695–707. - PubMed
    1. Crosby P, Partch CL. New insights into non-transcriptional regulation of mammalian core clock proteins. J Cell Sci. 2020;133:jcs241174. - PMC - PubMed
    1. Castelo-Szekely V, Gatfield D. Emerging Roles of Translational Control in Circadian Timekeeping. J Mol Biol. 2020;432:3483–3497. - PubMed

Publication types