. 2024 May 21;22(1):486.
doi: 10.1186/s12967-024-05123-9.

Integrated analysis of single-cell and bulk RNA sequencing data reveals a myeloid cell-related regulon predicting neoadjuvant immunotherapy response across cancers

Affiliations

Integrated analysis of single-cell and bulk RNA sequencing data reveals a myeloid cell-related regulon predicting neoadjuvant immunotherapy response across cancers

Hong Liu et al. J Transl Med. .

Abstract

Background: Immunotherapy has brought about a paradigm shift in the treatment of cancer. However, the majority of patients exhibit resistance or become refractory to immunotherapy, and the underlying mechanisms remain to be explored.

Methods: Sing-cell RNA sequencing (scRNA‑seq) datasets derived from 1 pretreatment and 1 posttreatment achieving pathological complete response (pCR) patient with lung adenocarcinoma (LUAD) who received neoadjuvant immunotherapy were collected, and pySCENIC was used to find the gene regulatory network (GRN) between cell types and immune checkpoint inhibitor (ICI) response. A regulon predicting ICI response was identified and validated using large‑scale pan-cancer data, including a colorectal cancer scRNA‑seq dataset, a breast cancer scRNA‑seq dataset, The Cancer Genome Atlas (TCGA) pan-cancer cohort, and 5 ICI transcriptomic cohorts. Symphony reference mapping was performed to construct the myeloid cell map.

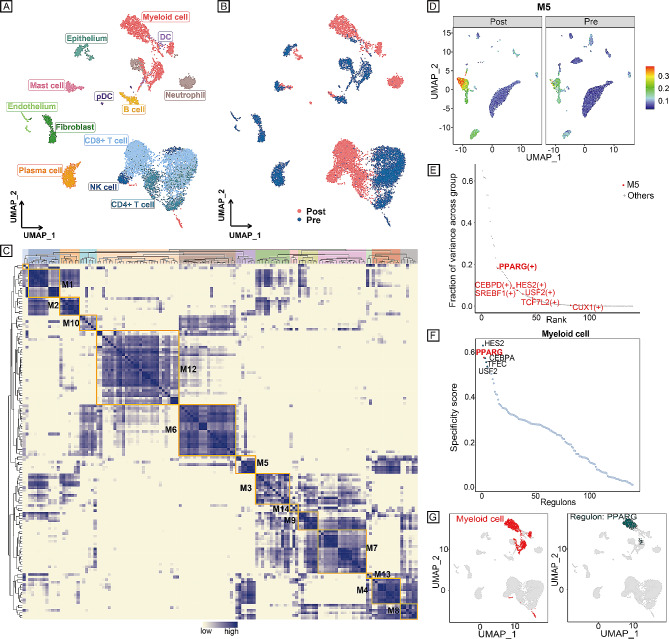
Results: Thirteen major cluster cell types were identified by comparing pretreatment and posttreatment patients, and the fraction of myeloid cells was higher in the posttreatment group (19.0% vs. 11.8%). A PPARG regulon (containing 23 target genes) was associated with ICI response, and its function was validated by a colorectal cancer scRNA‑seq dataset, a breast cancer scRNA‑seq dataset, TCGA pan-cancer cohort, and 5 ICI transcriptomic cohorts. Additionally, a myeloid cell map was developed, and cluster I, II, and III myeloid cells with high expression of PPARG were identified. Moreover, we constructed a website called PPARG ( https://pparg.online/PPARG/ or http://43.134.20.130:3838/PPARG/ ), which provides a powerful discovery tool and resource value for researchers.

Conclusions: The PPARG regulon is a predictor of ICI response. The myeloid cell map enables the identification of PPARG subclusters in public scRNA-seq datasets and provides a powerful discovery tool and resource value.

Keywords: Immunotherapy; Myeloid cells; Single cell; Transcription factor regulons.


Conflict of interest statement

The authors declare that they have no competing interests.

Figures

Fig. 1
Fig. 1
A flowchart showed the overall idea of this study
Fig. 2
Fig. 2
Identifying infiltrated cell types. A, B UMAP plot of single cells profiled in the present work coloured by cell type. A (pre), Single-cell data of patient 08 before treatment (immunotherapy plus chemotherapy); B (post), single-cell data of patient 06 achieving pCR after treatment (immunotherapy plus chemotherapy). C Relative fraction of cell types. The relative contribution of each population was weighed by the number of cells and scaled to 100%. UMAP, uniform manifold approximation and projection; pCR, pathology complete response.
Fig. 3
Fig. 3
Identification of combinatorial regulon modules. A UMAP for all single cells based on RAS; each cell is colour-coded based on cell-type assignment. B UMAP for all single cells based on RAS; each cell is colour-coded based on pre/posttreatment. C Identified regulon modules based on the regulon CSI matrix. D UMAP for all single cells in module M5 based on average RAS. E Regulons in module M5 (red dots). F Rank for regulons in myeloid cells based on the RSS. G (left) Myeloid cells are highlighted in the UMAP (red dots); (right) Binarized RAS for the top regulon PPARG on UMAP (green dots). UMAP, uniform manifold approximation and projection; RAS, regulon activity scores; CSI, connection specificity index; RSS, regulon specificity score.
Fig. 4
Fig. 4
Clinical function of the PPARG regulon. A AUCell of the PPARG regulon between LAUD pretreatment data (GSE207422 patient 08) and posttreatment data (GSE207422 patient 06). B AUCell of the PPARG regulon between LAUD pretreatment data (GSE207422 patient 05) and posttreatment data (GSE207422 patient 11). C AUCell of the PPARG regulon between LAUD MPR and NMPR data (GSE207422). D AUCell of the PPARG regulon between CRC pretreatment and posttreatment data (pCR, GSE205506). E AUCell of the PPARG regulon between the CRC pCR and nonpCR groups (GSE205506). F AUCell of the PPARG regulon between CRC tumour tissues and normal tissues (GSE205506). G GSVA scores of the PPARG regulon between LAUD MPR and NMPR data (GSE207422). H GSVA scores of the PPARG regulon between NSCLC response and nonresponse data (GSE126044). I GSVA scores of the PPARG regulon between melanoma response and nonresponse data (PRJEB23709). J Kaplan–Meier survival curve of the PPARG regulon (median GSVA score) in the GSE135222 cohort. Survival curves were compared by the log-rank test. K Kaplan–Meier survival curve of the PPARG regulon (median GSVA score) in the Orient-11 cohort. Survival curves were compared by the log-rank test. L Spearman correlation between the GSVA score of the PPARG regulon and immune score in the Orient-11 cohort. LAUD, lung adenocarcinoma; MPR, major pathology response; NMPR, non-major pathology response; CRC, colorectal cancer; pCR, pathology complete response; GSVA, gene set variation analysis; NSCLC, non-small-cell lung cancer.
Fig. 5
Fig. 5
Subgroups of PPARG + myeloid cells. A UMAP for PPARG + myeloid cells based on AUCell from GSE207422 (LUAD samples) and GSE205506 (CRC tumour samples). B Box plot of 14 subgroups of PPARG + myeloid cells based on AUCell. C Validation UMAP for PPARG + myeloid cells mapped with pretreatment data (GSE207422 patients 05 and 08). D Validation UMAP for PPARG + myeloid cells mapped with posttreatment data (GSE207422 patient 06 and 11). E Fraction of 14 PPARG + myeloid cell subgroups between LAUD pretreatment data (GSE207422 patients 05 and 08) and posttreatment data (GSE207422 patients 06 and 11). F Validation UMAP for PPARG + myeloid cells mapped with CRC pretreatment data (GSE205506). G Validation UMAP for PPARG + myeloid cells mapped with CRC response data after treatment (GSE205506). H Validation UMAP for PPARG + myeloid cells mapped with CRC nonresponse data after treatment (GSE205506). I Fraction of 14 PPARG + myeloid cell subgroups among CRC pretreatment, response and nonresponse data after treatment (GSE205506). J Validation UMAP for PPARG + myeloid cells mapped with BRCA response data after treatment. K Validation UMAP for PPARG + myeloid cells mapped with BRCA nonresponse data after treatment. L Fraction of 14 PPARG + myeloid cell subgroups between BRCA response and nonresponse data after treatment. M Example of UMAP after symphony reference mapping and pie chart of the fractions of clusters I, II, and III. UMAP, uniform manifold approximation and projection; LUAD, lung adenocarcinoma; CRC, colorectal cancer; BRCA, breast cancer.

References

    1. Ribas A, Wolchok JD. Cancer immunotherapy using checkpoint blockade. Science. 2018;359(6382):1350–5. doi: 10.1126/science.aar4060. - DOI - PMC - PubMed
    1. Yarchoan M, Hopkins A, Jaffee EM. Tumor mutational burden and response rate to PD-1 inhibition. N Engl J Med. 2017;377(25):2500–1. doi: 10.1056/NEJMc1713444. - DOI - PMC - PubMed
    1. Kruger S, Ilmer M, Kobold S, Cadilha BL, Endres S, Ormanns S, Schuebbe G, Renz BW, D’Haese JG, Schloesser H, Heinemann V, Subklewe M, Boeck S, Werner J. Von Bergwelt-Baildon M. advances in cancer immunotherapy 2019 - latest trends. J Exp Clin Cancer Res CR. 2019;38(1):268. doi: 10.1186/s13046-019-1266-0. - DOI - PMC - PubMed
    1. Mellman I, Coukos G, Dranoff G. Cancer immunotherapy comes of age. Nature. 2011;480(7378):480–9. doi: 10.1038/nature10673. - DOI - PMC - PubMed
    1. Wang Y, Wang M, Wu HX, Xu RH. Advancing to the era of cancer immunotherapy. Cancer Commun Lond Engl. 2021;41(9):803–29. doi: 10.1002/cac2.12178. - DOI - PMC - PubMed