. 2024 May 21;22(1):485.
doi: 10.1186/s12967-024-05208-5.

UBXN1 promotes liver tumorigenesis by regulating mitochondrial homeostasis

Affiliations

UBXN1 promotes liver tumorigenesis by regulating mitochondrial homeostasis

Kun Jiao et al. J Transl Med. .

Abstract

Background: The maintenance of mitochondrial homeostasis is critical for tumor initiation and malignant progression because it increases tumor cell survival and growth. The molecular events controlling mitochondrial integrity that facilitate the development of hepatocellular carcinoma (HCC) remain unclear. Here, we report that UBX domain-containing protein 1 (UBXN1) hyperactivation is essential for mitochondrial homeostasis and liver tumorigenesis.

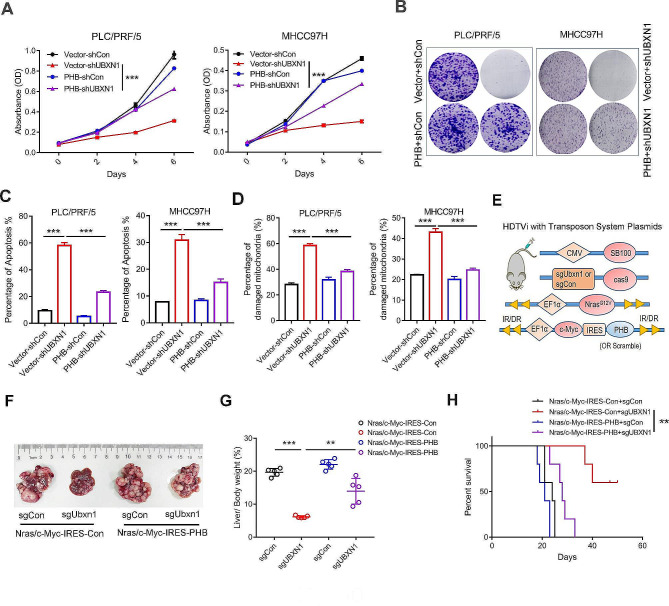
Methods: Oncogene-induced mouse liver tumor models were generated with the Sleeping Beauty (SB) transposon delivery system. Assessment of HCC cell growth in vivo and in vitro, including tumour formation, colony formation, TUNEL and FACS assays, was conducted to determine the effects of UBXN1 on HCC cells, as well as the involvement of the UBXN1-prohibitin (PHB) interaction in mitochondrial function. Coimmunoprecipitation (Co-IP) was used to assess the interaction between UBXN1 and PHB. Liver hepatocellular carcinoma (LIHC) datasets and HCC patient samples were used to assess the expression of UBXN1.

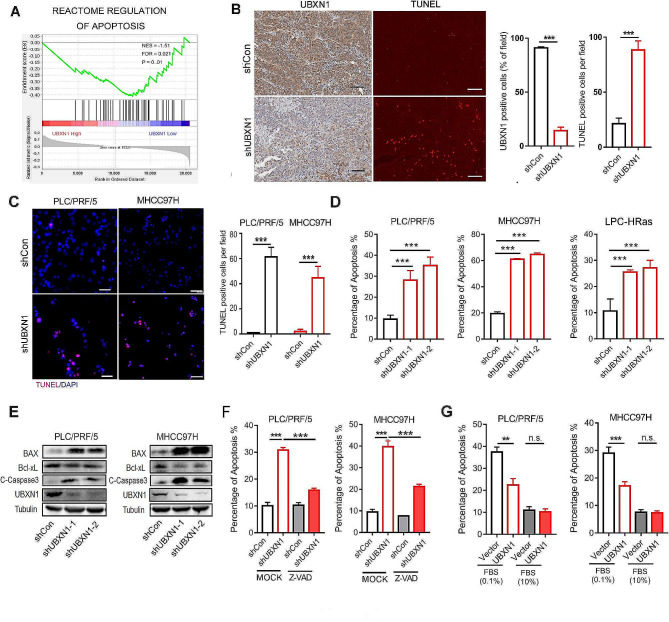
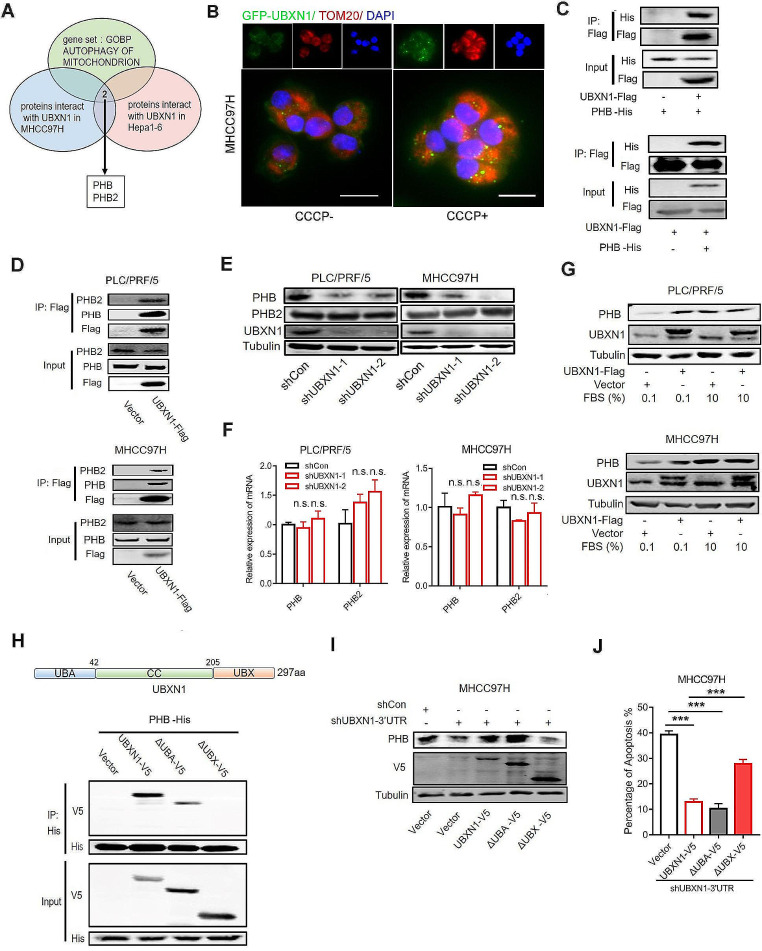
Results: UBXN1 expression is commonly upregulated in human HCCs and mouse liver tumors and is associated with poor overall survival in HCC patients. UBXN1 facilitates the growth of human HCC cells and promotes mouse liver tumorigenesis driven by the NRas/c-Myc or c-Myc/shp53 combination. UBXN1 interacts with the inner mitochondrial membrane protein PHB and sustains PHB expression. UBXN1 inhibition triggers mitochondrial damage and liver tumor cell apoptosis.

Conclusions: UBXN1 interacts with PHB and promotes mitochondrial homeostasis during liver tumorigenesis.

Keywords: Apoptosis; Hepatocellular carcinoma; Mitochondrial homeostasis; PHB; UBXN1.


Conflict of interest statement

We declare that we have no potential financial conflict of interest related to this manuscript. None of the material in this paper has been published or is under consideration for publication elsewhere.

Figures

Fig. 1
Fig. 1
UBXN1 expression is upregulated in HCC and correlated with poor clinical prognosis. (A) The expression level of UBXN1 (FPKM) in HCC (T) and nontumor (NT) tissues from TCGA-LIHC (NT = 50, T = 374), ICGC-LIHC (NT = 202, T = 243) or GSE14520 (NT = 241, T = 247) databases. (B) Kaplan–Meier survival curves showing overall survival of HCC patients stratified by UBXN1 mRNA expression level (TCGA-LIHC (n = 364), ICGC-LIHC (n = 243) or GSE14520 (n = 242). (C) Western blotting analysis of UBXN1 in 21 paired clinical HCC tissues (T) and adjacent normal tissues (NT). The quantitative measurement was conducted to analyze grayscale value (right, UBXN1/Tubulin, paired Mann Whitney test). (D) qRT-PCR analysis of UBXN1 in 21 paired clinical HCC tissues (T) and adjacent normal tissues (NT). (E) Representative IHC images (left) and IHC score (right) of UBXN1 expression in paired clinical HCC tissues (T) and adjacent normal tissues (NT), n = 80. Scale bar: 100 μm. (F-G) The C57BL/6 mice were hydrodynamically injected with indicated plasmids (n = 5 or 6). IHC images (F, left) and IHC score (F, right) of mouse livers at 4 or 7 weeks post hydrodynamic injection. Scale bar: 100 μm. Western blotting analysis of UBXN1 expression in liver tissues (G). The data are presented as mean ± SD. **, p < 0.01; ***, p < 0.001; by two-tailed Student t test
Fig. 2
Fig. 2
UBXN1 promotes HCC cell proliferation and tumorigenicity. (AD) The C57BL/6 mice were hydrodynamic co-injected transposon-based vectors expressing NRas G12V, c-Myc, along with vector expressing Cas9 and a CRISPR guide RNA targeting UBXN1 or scramble RNA (n = 6). Schematic representation of the HDTVi (A), morphology of livers (B), ratio of liver/body weight (C) or Kaplan-Meier overall survival curves (D) were shown. (EH) The indicated vectors were hydrodynamic injected into C57BL/6 mice (n = 5). Schematic of vectors (E), morphology (F), ratio of liver/body weight (G) or Kaplan-Meier overall survival curves (H) were shown. (IK) BALB/C nude mice were subcutaneously implanted with 7 × 106 UBXN1-knockdown or control MHCC97H cells (n = 6). Tumors were harvested at day 28 post implantation. Representative pictures (I), tumor volumes (J) and tumor mass (K) were shown. (LN) BALB/C nude mice were subcutaneously implanted with 5 × 106 UBXN1-ovexpressed and control MHCC97H cells (n = 5). Tumors were harvested at day 35 post implantation. Representative pictures (L), tumor volumes (M) and tumor mass (N) were shown. (O) The indicated cells were cultured with medium containing 0.1% FBS with starvation for one day or two, and then switched to complete medium for the following days. The growth capacity was tested by MTT assay. (P) MTT assay was used for determine the growth capacity of indicated cells. The data are presented as mean ± SD. **, p < 0.01; ***, p < 0.001 by two-tailed Student t test
Fig. 3
Fig. 3
Inhibition of UBXN1 induces HCC cell apoptosis. (A) GSEA of TCGA-LIHC dataset with UBXN1 transcript levels and REACTOME _REGULATION_OF_APOPTOSIS signature. (B) UBXN1 staining (left) and TUNEL staining (right) of indicated samples derived from MHCC97H xenograft tumor. Scale bar: 100 μm. (C) IF staining of TUNEL in indicated PLC/PRF/5 and MHCC97H cells. Scale bar: 100 μm. (D) Flow cytometry analysis of apoptotic ratio in PLC/PRF/5, MHCC97H and LPC-HRas cells. (E) Western blotting analysis of indicated proteins in UBXN1-knockdown PLC/PRF/5 and MHCC97H cells. (F) Flow cytometry analysis of apoptosis ratio in indicated cells treated with or without Z-VAD-FMK (20µM) for 48 h. (G) Flow cytometry analysis of apoptosis ratio in indicated PLC/PRF/5 and MHCC97H cells coculturing with or without medium containing 0.1%FBS for 48 h serum starvation. The data are presented as mean ± SD. ***, p < 0.001 by two-tailed Student t test
Fig. 4
Fig. 4
Inhibiting UBXN1 promotes mitochondrial damage in HCC cells. (A) KEGG enrichment analysis of UBXN1-upregulated genes in MHCC97H cells using compilation C5 (MSigDB). Upregulated genes were determined with the criteria: p<0.05 and log2 (fold change) ≥ 1. (B) GSEA of TCGA-LIHC dataset with UBXN1 transcript levels and REACTOME_MITOPHAGY signature. (C) Representative pictures of mitochondrial morphology stained with MitoTracker Green in indicated PLC/PRF/5 and MHCC97H cells. Scale bar: 100 μm. (D) The indicated cells were stained with MitoTracker Deep Red (50 nM) for 15 min. The percentage of damaged mitochondria in HCC cells was measured by FACS. (E) mtDNA copy numbers in PLC/PRF/5 and MHCC97H cells were analyzed by qPCR. (F) The indicated cells were stained with JC-1 (5µM) for 15 min. The analysis of mitochondrial membrane potential loss was measured by FACS. (G) The indicated cells were treated with CCCP (20µM) for 12–24 h and stained with MitoTracker Deep Red (50 nM) for 15 min. The percentage of damaged mitochondria in HCC cells was measured by FACS. (H) mtDNA copy numbers analyzed by qPCR with tRNA-Leu to GAPDH in PLC/PRF/5 and MHCC97H cells with or without UBXN1 overexpression, CCCP (20µM) for 12–24 h. The data are presented as mean ± SD. *, p < 0.05; **, p < 0.01; ***, p < 0.001 by two-tailed Student t test
Fig. 5
Fig. 5
UBXN1 interacts with PHB and maintains its expression. (A) Venn diagram illustrated UBXN1 interactors (overlap based on IP-MS of MHCC97H and Hepa1-6, unique peptides > 2) with mitophagy regulator (GOBP AUTOPHAGY OF MITOCHONDRION). (B) GFP-UBXN1-expressed MHCC97H cells were treated with or without CCCP for 2 h MHCC97H cells. Representative pictures of IF staining of indicated cells was shown. (C) HEK293T cells were transient transfected with PHB-His together with UBXN1-Flag or control plasmid. Total lysates were immunoprecipitated with Flag M2 affinity gel after 48 h and the indicated proteins were detected by western blotting. (D) Total lysates from indicated PLC/PRF5 and MHCC97H cells were immunoprecipitated with Flag M2 affinity gel and then indicated proteins were detected by western blotting. (E) Western blotting analysis of indicted proteins in MHCC97H and PLC/PRF5 cells transduced with lentivirus UBXN1 shRNA or shRNA-control plasmid. (F) qRT-PCR analysis of PHB and PHB2 in MHCC97H and PLC/PRF5 cells transduced with lentivirus UBXN1 shRNA or shRNA-control plasmid. (G) Indicated PLC/PRF/5 and MHCC97H cells coculturing with or without medium containing 0.1% FBS for 24 h serum starvation. The expression of indicated proteins was measured by western blotting. (H) HEK293T cells were transient transfected with PHB-His together with UBXN1-V5, UBXN1-ΔUBA-V5, UBXN1-ΔUBX-V5 or control plasmid. Total lysates were immunoprecipitated with His affinity gel after 48 h and the indicated proteins were detected by western blotting. (I) Endogenous UBXN1 was knocked down by transfecting lentiviral shRNA targeting the 3′UTR of UBXN1 in UBXN1-, UBXN1-ΔUBA- and UBXN1-ΔUBX-overexpressed MHCC97H cells. The indicated proteins were detected by western blotting. (J) Flow cytometry analysis of apoptotic ratio in indicated MHCC97H cells. The data are presented as mean ± SD. **, p < 0.01; ***, p < 0.001 by two-tailed Student t test
Fig. 6
Fig. 6
PHB counteracts UBXN1-knockdown-mediated HCC cell apoptosis and mitochondrial damage. (AB) MTT assay (A) and colony formation assay (B) were used for measured proliferation of indicated cells. (CD) Percentage of apoptotic cells (C) and damaged mitochondria (D) were measured by FACS. (EH) The indicated vectors were hydrodynamic injected into C57BL/6 mice (n = 5). Schematic of vectors (E), morphology (F), ratio of liver/body weight (G) or Kaplan-Meier overall survival curves (H) were shown. Student’s t-test, ***p < 0.001

References

    1. Llovet JM, Kelley RK, Villanueva A, Singal AG, Pikarsky E, Roayaie S, et al. Hepatocellular carcinoma. Nat Reviews Disease Primers. 2021;7(1):6. doi: 10.1038/s41572-020-00240-3. - DOI - PubMed
    1. Vogel A, Meyer T, Sapisochin G, Salem R, Saborowski A. Hepatocellular carcinoma. Lancet (London England) 2022;400(10360):1345–62. doi: 10.1016/S0140-6736(22)01200-4. - DOI - PubMed
    1. Chan DC. Mitochondrial dynamics and its involvement in Disease. Annu Rev Pathol. 2020;15:235–59. doi: 10.1146/annurev-pathmechdis-012419-032711. - DOI - PubMed
    1. Zong WX, Rabinowitz JD, White E. Mitochondria and Cancer. Mol Cell. 2016;61(5):667–76. doi: 10.1016/j.molcel.2016.02.011. - DOI - PMC - PubMed
    1. Chen Y, Chen HN, Wang K, Zhang L, Huang Z, Liu J, et al. Ketoconazole exacerbates mitophagy to induce apoptosis by downregulating cyclooxygenase-2 in hepatocellular carcinoma. J Hepatol. 2019;70(1):66–77. doi: 10.1016/j.jhep.2018.09.022. - DOI - PubMed

Publication types

MeSH terms