. 2024 May 21;16(1):116.
doi: 10.1186/s13195-024-01471-2.

Experimental colitis in young Tg2576 mice accelerates the onset of an Alzheimer's-like clinical phenotype

Affiliations

Experimental colitis in young Tg2576 mice accelerates the onset of an Alzheimer's-like clinical phenotype

Luca Lorenzini et al. Alzheimers Res Ther. .

Abstract

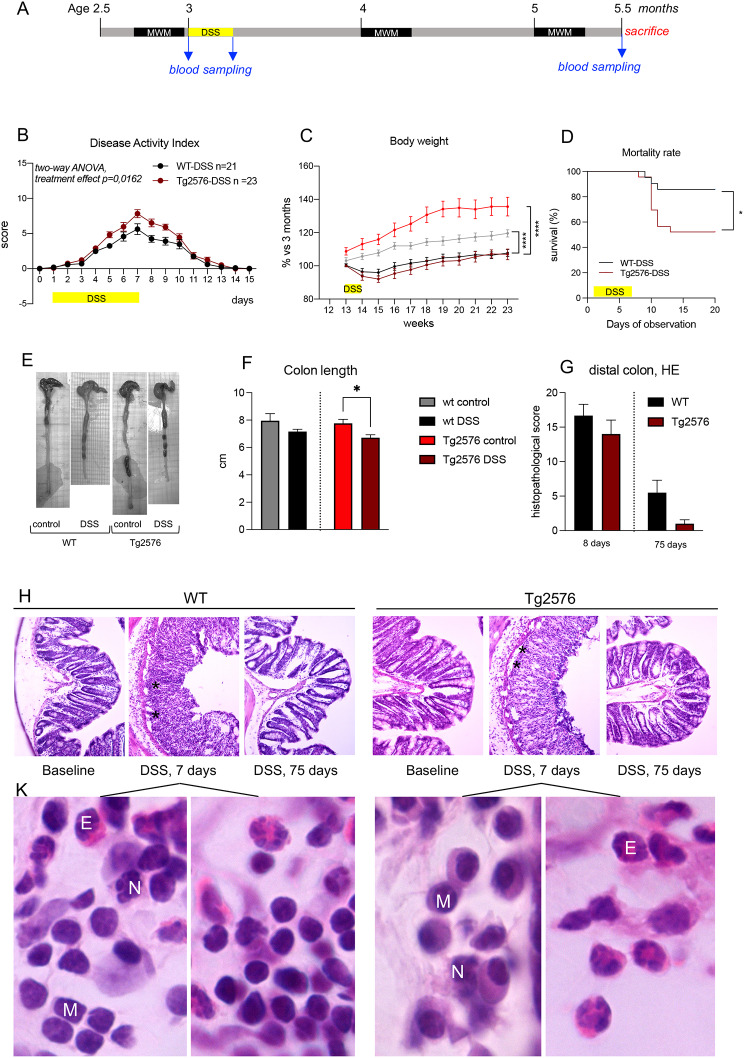
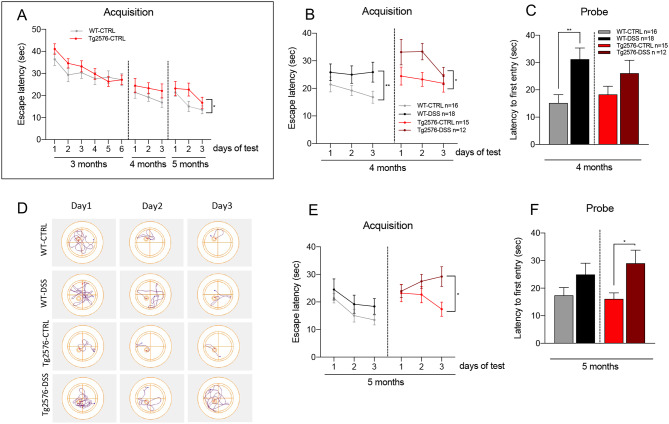
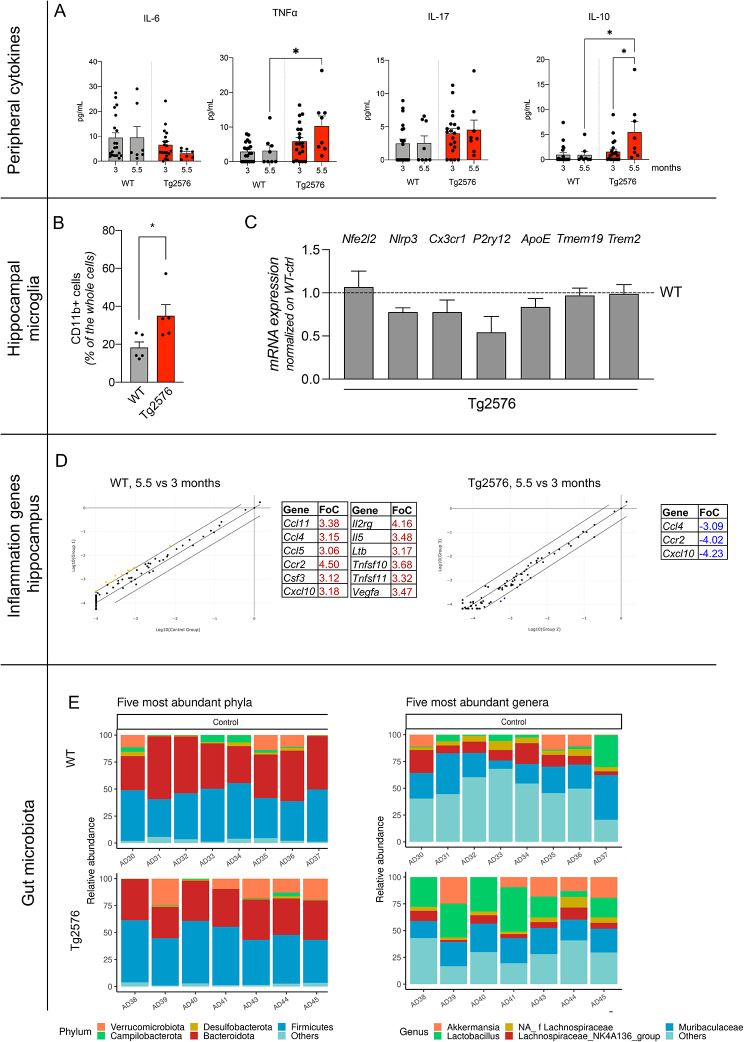
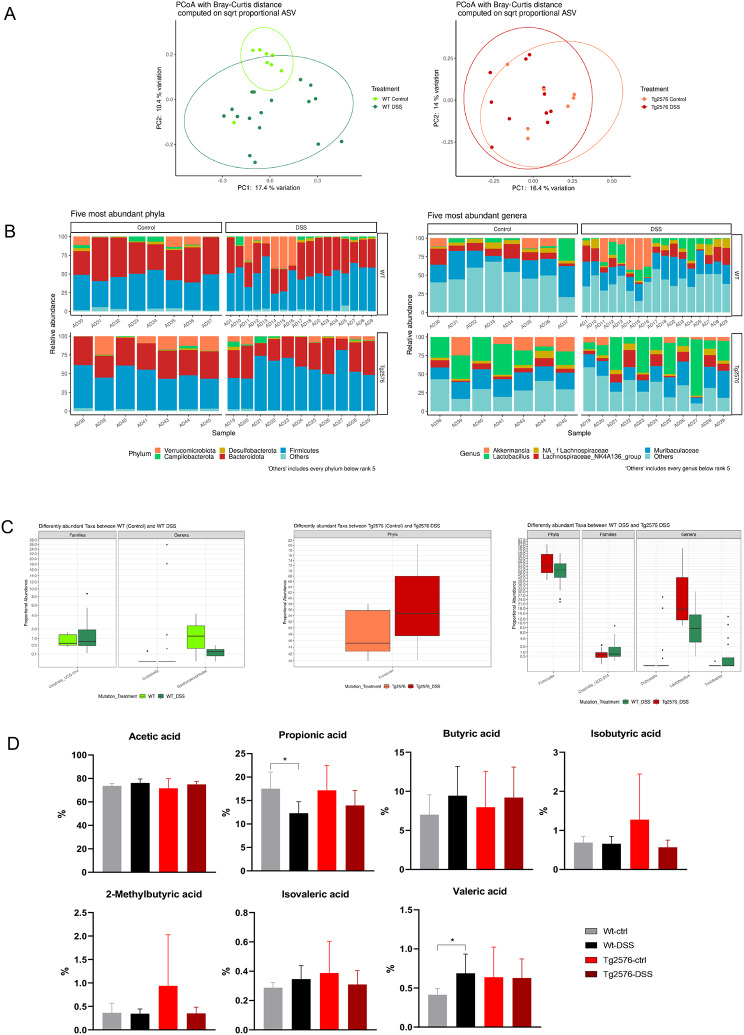
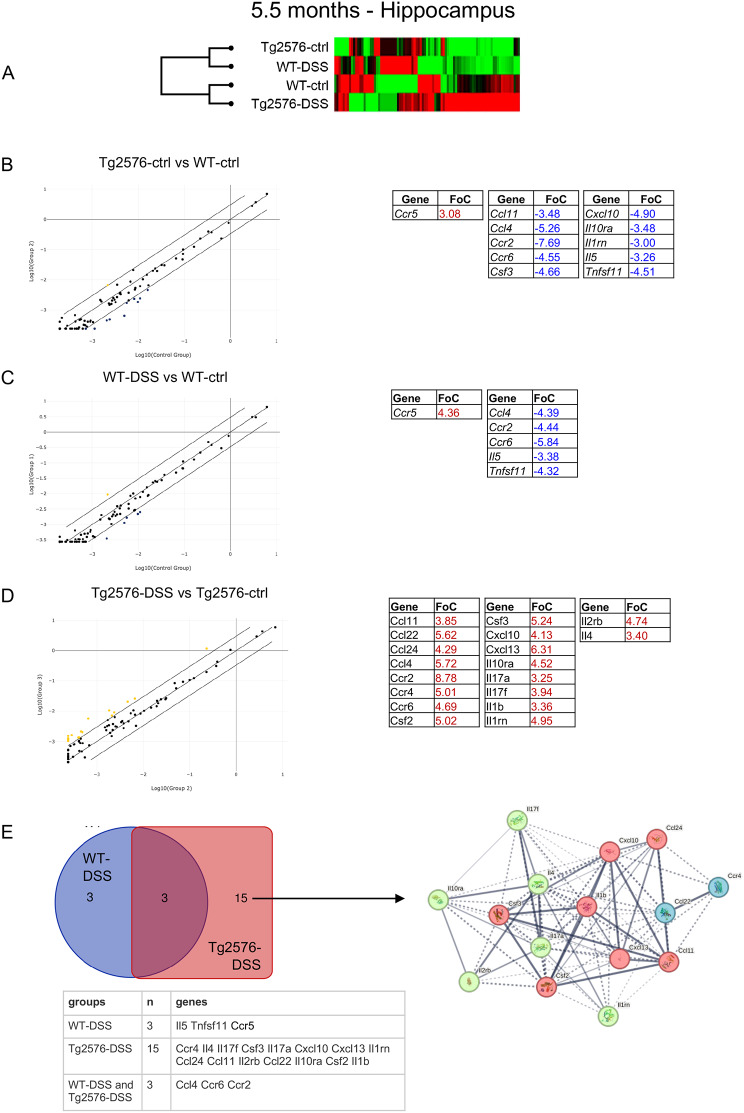
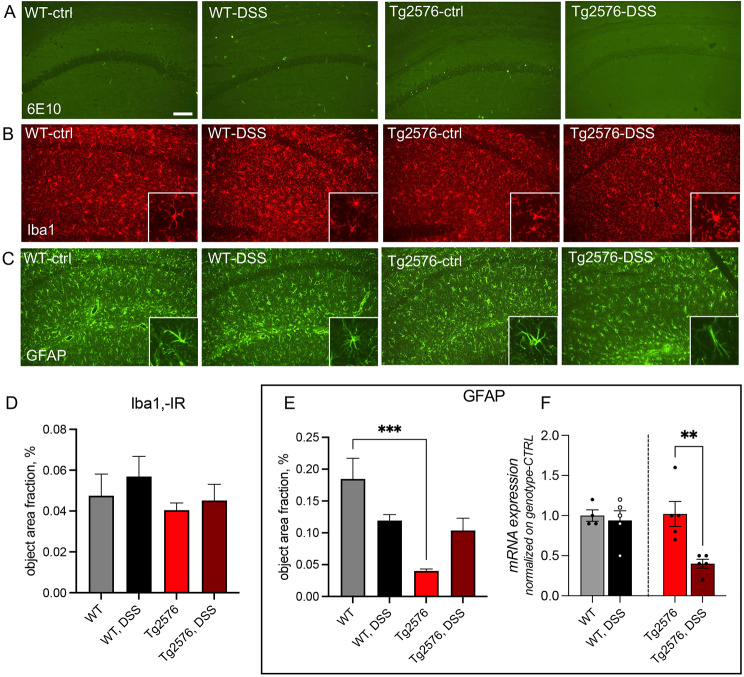
Systemic inflammation and neuroinflammation affect the natural course of the sporadic form of Alzheimer's disease (AD), as supported by epidemiological and preclinical data, and several epidemiological studies indicate a higher prevalence of AD in patients with inflammatory bowel disease. In this study, we explored whether colitis induced by dextran sulfate sodium (DSS) in young, presymptomatic/preplaque mice worsens and/or anticipates age-dependent cognitive impairment in Tg2576, a widely used mouse model of AD. We demonstrated that DSS colitis induced in young Tg2576 mice anticipates the onset age of learning and memory deficit in the Morris water maze test. To explore potential mechanisms behind the acceleration of cognitive decline in Tg2576 mice by DSS colitis, we focused on gut microbiota, systemic inflammation and neuroinflammation markers. We observed a Firmicutes/Bacteroidetes ratio change in Tg2576 DSS animals comparable to that of elderly Tg2576 mice, suggesting accelerated microbiota aging in Tg2576 DSS mice, a change not observed in C57BL6 DSS mice. We also observed substantial differences between Tg2576 and WT mice in several inflammation and neuroinflammation-related parameters as early as 3 months of age, well before plaque deposition, a picture which evolved rapidly (between 3 and 5.5 months of age) in contrast to Tg2576 and WT littermates not treated with DSS. In detail, following induction of DSS colitis, WT and Tg2576 mice exhibited contrasting features in the expression level of inflammation-evoked astrocyte-associated genes in the hippocampus. No changes in microglial features occurred in the hippocampus between the experimental groups, whereas a reduced glial fibrillary acidic protein immunoreactivity was observed in Tg2576 vs. WT mice. This finding may reflect an atrophic, "loss-of-function" profile, further exacerbated by DSS where a decreased of GFAP mRNA expression level was detected. In conclusion, we suggest that as-yet unidentified peripheral mediators evoked by DSS colitis and involving the gut-brain axis emphasize an astrocyte "loss-of-function" profile present in young Tg2576 mice, leading to impaired synaptic morphological and functional integrity as a very early sign of AD.

Keywords: Astrocytes; Cytokines/chemokines; Gut microbiota/microbiome; Neuroinflammation; Preclinical Alzheimer’s disease; Systemic inflammation; Tg2576 mice.


Conflict of interest statement

The authors declare no competing interests.

Figures

Fig. 1
Fig. 1
Experimental design and DSS colitis monitoring in WT and Tg2576 mice. (A). Experimental design of the study. Timeline of DSS treatment, blood samplings, behavioral tests, and sacrifice are shown according to the age of the mice. (B). Disease Activity Index (DAI); (C). Body weight; (D). Survival curve of DSS and vehicle (CTRL) mice in WT and Tg2576 strains. (E). Representative photos of colon at sacrifice in the experimental groups; (F). Colon length at sacrifice (N = 8–11); (G). Histopathology score of distal colon at sacrifice in the experimental groups (N = 4). (H). Representative micrographs of H&E sections of the colon of WT and Tg2576 mice at different time points, corresponding to baseline, clinical colitis (7 days) and sacrifice. (K). Representative, higher power micrographs of H&E sections of the colon of WT and Tg2576 mice clinical colitis (7 days). Data are expressed as mean ± SEM. Statistical analysis: B,C, two-way ANOVA, * P < 0.05; D, Gehan-Breslow-Wilcoxon test, p = 0.0150; Log-rank (Mantel-Cox) test,  p = 0.0142; F, G. Student’s t-test, * p < 0.05
Fig. 2
Fig. 2
Effect of DSS treatment on MWM performance at different age-points. (A). Acquisition phase at 3, 4 and 5 months on control groups, expressed as latency to reach the submerged platform. (B). Acquisition phase at 4 months in WT, WT DSS, Tg2576 and Tg2576 DSS groups, expressed as latency to reach the submerged platform. (C). Probe trial in 4-month-old mice, on all groups, expressed as latency to the first entry into the platform area. (D). Representative track plots of acquisition trial of mice at 5 months of age in different groups. (E). Acquisition phase at 5 months in WT control, WT DSS, Tg2576 control and Tg2576 DSS groups, expressed as latency to reach the submerged platform. (F). Probe trial in 5-month-old mice, on all groups, expressed as latency to the first entry into the platform area. Data are expressed as mean ± SEM. The number of mice included in each group is shown in the legend. Statistical analysis: two-way ANOVA (B, E) and Student’s t-test (C, F), (* p < 0.05; ** p < 0.01)
Fig. 3
Fig. 3
Inflammation and neuroinflammation markers in young, preplaque Tg2576 mice. (A). Cytokine plasma levels in 3 and 5.5-month-old WT and Tg2576, vehicle and DSS-treated mice. (B). Number of CD11 + microglial cells in the hippocampus in 3-month-old mice. (C). Expression level of disease-associated microglial genes in the hippocampus of young Tg2576 mice, expressed as a percentage variation compared to age-matching Tg2576 mice. (D). Scatter plots derived from 84 inputs obtained from qPCR array plates for inflammation-related genes, showing age-regulated genes (5.5 vs. 3-month-old mice) in WT and Tg2576 mice. Significance was set at a fold change of 3 (FoC). Regulated genes are listed in the table as up-regulated (red) and down-regulated (blue). (E). Relative abundances of the five most represented phyla and genera observed in Tg2576 and WT mice. Statistical analysis: A, C: two-way ANOVA and post-hoc Tukey’s test, * p < 0.05; B: Student’s t-test, * p < 0.05
Fig. 4
Fig. 4
Gut dysbiosis by DSS colitis differs in Tg2576 and WT mice. (A). PCoAs, according to the Bray-Curtis beta diversity metric, of stool samples of WT and WT DSS mice and Tg2576 and Tg2576 DSS mice. (B). Relative abundances of the five most represented phyla and genera observed in WT and WT DSS mice and in Tg2576 and Tg2576 DSS mice. (C). Box plots showing significant differentially abundant taxa between groups. All data have a p adj.<0.05. (D). Bar plots showing fecal SCFAs abundances between groups. Analyses were assessed using the Kruskal-Wallis test and p adj. values less than 0.05 were considered statistically significant. * p < 0.05, ** p < 0.01, *** p < 0.001
Fig. 5
Fig. 5
Neuroinflammation molecular signature by DSS colitis in the hippocampus of Tg2576 and WT mice. (A). Cluster gram analysis of the 84 inputs obtained from qPCR array plates for inflammation-related genes in the hippocampus. (B). Scatter plot representation of the gene expression fold change in Tg2576 control vs. WT control in 5.5 month-old mice, using a fold change of three as the significance cutoff value for gene expression variation. Regulated genes are listed in the table as up-regulated (red) and down-regulated (blue). (C). Scatter plot representation of the gene expression fold change in WT DSS vs. WT control mice, using a fold change of three as the significance cutoff value for gene expression variation. Regulated genes are listed in the table as up-regulated (red) and down-regulated (blue). (D). Scatter plot representation of the gene expression fold change in Tg2576 DSS vs. Tg2576 control mice, using a fold change of three as the significance cutoff value for gene expression variation. Regulated genes are listed in the table as up-regulated (red) and down-regulated (blue). (E). Venn diagram of the diversely regulated genes in WT (blue circle) and Tg2576 (red square) control mice. A fold change of two as the significance cutoff value for gene expression variation was used for this analysis. The table shows the genes listed in each interaction. The STRING interaction network of the protein encoded by genes showing a fold of change higher than two is also shown. The left net refers to genes regulated by DSS in both WT and Tg2576 mice, while the right net refers to genes regulated in Tg2576 mice only
Fig. 6
Fig. 6
Amyloid histopathology, microglia and astroglial cells in the CA1/2 hippocampal fields of Tg2576 and WT, control, and DSS-treated mice. Amyloid plaque deposition was analyzed by 6E10-IR (A), microglia by Iba1 (B), and astrocytes by GFAP (C). GFAP- (D) and Iba1-IR (E) were quantified as % area fraction. GFAP mRNA expression level in the hippocampus was normalized vs. the WT control group (F). Data are expressed as mean + SEM. Statistical analysis: one-way ANOVA and post-hoc Tukey’s test, ***  p < 0.001 (D, E); Student’s t-test, ** p < 0.01 (F). Bar: 100 μm

Similar articles

Cited by

References

    1. Serrano-Pozo A, Frosch MP, Masliah E, Hyman BT. Neuropathological alterations in Alzheimer Disease. Cold Spring Harb Perspect Med. 2011;1:a006189–006189. doi: 10.1101/cshperspect.a006189. - DOI - PMC - PubMed
    1. Hardy JA, Higgins GA. Alzheimer’s disease: the amyloid cascade hypothesis. Sci (80-) 1992;256:184–5. doi: 10.1126/science.1566067. - DOI - PubMed
    1. Long JM, Holtzman DM. Alzheimer Disease: an update on pathobiology and treatment strategies. Cell. 2019;179:312–39. doi: 10.1016/j.cell.2019.09.001. - DOI - PMC - PubMed
    1. Uddin MS, Hasana S, Hossain MF, Islam MS, Behl T, Perveen A, Hafeez A, Ashraf GM. Molecular Genetics of early- and late-onset Alzheimer’s Disease. Curr Gene Ther. 2020;21:43–52. doi: 10.2174/1566523220666201123112822. - DOI - PubMed
    1. Aisen PS, Cummings J, Jack CR, Morris JC, Sperling R, Frölich L, Jones RW, Dowsett SA, Matthews BR, Raskin J, Scheltens P, Dubois B. On the path to 2025: understanding the Alzheimer’s disease continuum. Alzheimers Res Ther. 2017;9:60. doi: 10.1186/s13195-017-0283-5. - DOI - PMC - PubMed

Publication types