. 2024 May;96(5):e29684.
doi: 10.1002/jmv.29684.

Unveiling the role of KSHV-infected human mesenchymal stem cells in Kaposi's sarcoma initiation

Affiliations

Unveiling the role of KSHV-infected human mesenchymal stem cells in Kaposi's sarcoma initiation

Ezequiel Lacunza et al. J Med Virol. 2024 May.

Abstract

Kaposi's sarcoma (KS) may derive from Kaposi's sarcoma herpesvirus (KSHV)-infected human mesenchymal stem cells (hMSCs) that migrate to sites characterized by inflammation and angiogenesis, promoting the initiation of KS. By analyzing the RNA sequences of KSHV-infected primary hMSCs, we have identified specific cell subpopulations, mechanisms, and conditions involved in the initial stages of KSHV-induced transformation and reprogramming of hMSCs into KS progenitor cells. Under proangiogenic environmental conditions, KSHV can reprogram hMSCs to exhibit gene expression profiles more similar to KS tumors, activating cell cycle progression, cytokine signaling pathways, endothelial differentiation, and upregulating KSHV oncogenes indicating the involvement of KSHV infection in inducing the mesenchymal-to-endothelial (MEndT) transition of hMSCs. This finding underscores the significance of this condition in facilitating KSHV-induced proliferation and reprogramming of hMSCs towards MEndT and closer to KS gene expression profiles, providing further evidence of these cell subpopulations as precursors of KS cells that thrive in a proangiogenic environment.

Keywords: KSHV; Kaposi's sarcoma; mesenchymal‐to‐endothelial transition.


Conflict of interest statement

CONFLICT OF INTEREST STATEMENT

The authors declare no conflict of interest.

Figures
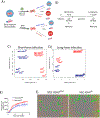
FIGURE 1
FIGURE 1
RNA-sequencing analysis of de novo infected bone marrow-derived hMSC in different environments. (A) Schematic representation of the experimental design and samples group assignment. (B) Sequenced samples and times after infection: 72 h after infection (short-term infection) or 1 month after infection and selection (long-term infection). (C) Multidimensional scaling plot of the host RNA at short-term infection showing the distance of each sample from each other determined by their leading log fold change. (D) Multidimensional scaling plot of the host RNA at long-term infection and selection for infected cells showing the distance of each sample from each other determined by their leading log fold change. (E) hMSCs were infected with KSHV in MSC or KS-like media and incubated in an Incucyte Zoom (Essen Bioscience), acquiring green fluorescence images. The amount of latently infected cells (GFP-positive) is plotted over time. The graph shows the mean ± standard error from three replicates for each condition. (F) Fluorescence microscopy images were acquired from the Incucyte Zoom, using the GFP reporter driven by the constitutive promoter of cellular EF-1 and the RFP reporter driven by the early lytic gene PAN promoter at 72 h postinfection. GFP, green fluorescent protein; hMSC, human mesenchymal stem cells; KSHV, Kaposi’s sarcoma herpesvirus; PAN, polyadenylated nuclear RNA; RFP, red fluorescent protein.
FIGURE 2
FIGURE 2
Differential gene expression analysis and functional enrichment of transcriptomic data. Dot plots of gene set enrichment analysis obtained from the comparisons between control and infected cells in both environmental conditions at short- and long-term infection. (A) Dot plot of significantly activated and suppressed Gene Ontology pathways in infected cells after 72 h of infection in both MEM and KS environment. (B) Dot plot of significantly activated and suppressed Hallmarks of Cancer in infected cells after 72hs of infection in both MEM and KS environment. (C) Dot plot of significantly activated and suppressed Gene Ontology pathways in infected cells after long-term infection and selection in both MEM and KS environments. (D) Dot plot of significantly activated and suppressed Hallmarks of Cancer in infected cells after long-term infection and selection in both MEM and KS environments. Each dot represents a specific biological term, with the size of the dot indicating the number of genes associated with that term. The color of the dots corresponds to the adjusted p value, highlighting the significance of enrichment. KS, Kaposi’s sarcoma; MEM, minimum essential medium.
FIGURE 3
FIGURE 3
Cytokine and angiogenesis arrays to validate the RNA-sequencing findings. (A) Cytokine Array Kit was used to quantify levels of 105 cytokines in MSC-KSHVMEM and MSC-KSHVKS at short-term infection and long-term infection and selection for infected cells pointing to major activation spots corresponding to the statistically upregulated cytokines. (B) Angiogenesis Array Kit was used to quantify levels of 55 angiogenesis-related proteins in MSC-KSHVMEM and MSC-KSHVKS at short-term infection or long-term infection and selection for infected cells pointing to major activation spots corresponding to the statistically upregulated proteins. (C) PDGFRA (mesenchymal marker), CD31/PECAM-1 (endothelial marker), phospho-AKT, AKT, and Cyclin D1 protein levels in hMSC after 72 h of KSHV infection. Actin was used as the loading control. hMSC, human mesenchymal stem cells; KS, Kaposi’s sarcoma; KSHV, Kaposi’s sarcoma herpesvirus; MEM, minimum essential medium; MSC, mesenchymal stem cell.
FIGURE 4
FIGURE 4
Gene set enrichment analysis (GSEA) of differentially expressed genes (DEG) in the comparison between MSC-KSHVMEM and MSC-KSHVKS cells at short-term and long-term infection. (A)–(C) Dot plots of significantly activated and suppressed Gene Ontology (GO) pathways (A), Hallmark (B), and Cell Marker (C) in MSC-KSHVKS cells after 72 h of infection. (D)–(F) Significantly enriched activated and suppressed GO (D), Cell Marker (E), and Hallmark (F) between the two infected cell types at long-term infection. Each dot represents a specific biological term, with the size of the dot indicating the number of genes associated with that term. The color of the dots corresponds to the adjusted p value, highlighting the significance of enrichment. KS, Kaposi’s sarcoma; KSHV, Kaposi’s sarcoma herpesvirus; MEM, minimum essential medium; MSC, mesenchymal stem cell.
FIGURE 5
FIGURE 5
Endothelial differentiation cell cycle progression and chemokine signaling of hMSC in the KS environment is driven by KSHV infection. (A) and (B) Schematic representation of the comparisons and DEGs found short-term infection or long-term infection and selection for infected cells. (C) and (D) Network analysis of the genes that are directly dependent on KSHV infection in KS-like proangiogenic conditions for each time point. DEGs, differentially expressed genes; hMSC, human mesenchymal stem cell; KS, Kaposi’s sarcoma; KSHV, Kaposi’s sarcoma herpesvirus.
FIGURE 6
FIGURE 6
Genome-wide analysis of KSHV transcriptome. (A) Multidimensional scaling plot of the viral RNA at short-term infection and long-term infection and selection for infected cells showing the distance of each sample from each other determined by their leading log fold change. (B) Volcano plot showing KSHV differentially expressed genes (DEGs) analyzed by RNA-sequencing between MSC-KSHVMEM and MSC-KSHVKS at short-term infection. (C) Volcano plot showing KSHV DEGs analyzed by RNA-sequencing between MSC-KSHVMEM and MSC-KSHVKS at long-term infection and selection for infected cells. (D) Heatmap of the differently expressed KSHV genes between MSC-KSHVMEM and MSC-KSHVKS at long-term infection and selection for infected cells. KS, Kaposi’s sarcoma; KSHV, Kaposi’s sarcoma herpesvirus; MEM, minimum essential medium; MSC, mesenchymal stem cell.
FIGURE 7
FIGURE 7
KSHV infection in KS proangiogenic environmental conditions reprograms human MSCs in KS-like gene expression profile. (A) Unsupervised clustering–resulting from the gene expression profile of a KS signature of 3589 significantly DEGs between KS lesions and control samples–on the samples from our study, together with 24 samples of KS lesions, 24 contralateral/ipsilateral controls, and three normal skin derived from the Lidenge study21. Cluster I and Cluster II are shown. (B) Unsupervised clustering–resulting from the KSHV gene expression profile–on the samples from our study and 24 samples of KS lesions from the Lidenge study21. Two main clusters of samples (red and blue) and genes (yellow and green) are identified. KSHV Gene Cluster 1 enriched in KSHV genes related to lytic replication, structural proteins, and viral replication; and KSHV Gene Cluster 2 enriched in KSHV genes related to Latency and Immunomodulation. The different samples are color-coded to improve interpretation. DEGs, differentially expressed genes; KS, Kaposi’s sarcoma; KSHV, Kaposi’s sarcoma herpesvirus; MSC, mesenchymal stem cell.

References

    1. Chang Y, Cesarman E, Pessin MS, et al. Identification of herpesvirus-like DNA sequences in AIDS-associated Kaposi’s sarcoma. Science. 1994;266:1865–1869. - PubMed
    1. Ensoli B Kaposi’s sarcoma: a result of the interplay among inflammatory cytokines, angiogenic factors and viral agents. Cytokine Growth Factor Rev. 1998;9:63–83. - PubMed
    1. Ramos JC, Sin SH, Staudt MR, et al. Nuclear factor kappa B pathway associated biomarkers in AIDS defining malignancies. Int J Cancer. 2012;130:2728–2733. doi:10.1002/ijc.26302 - DOI - PMC - PubMed
    1. Stürzl M, Brandstetter H, Zietz C, et al. Identification of interleukin-1 and platelet-derived growth factor-B as major mitogens for the spindle cells of Kaposi’s sarcoma: a combined in vitro and in vivo analysis. Oncogene. 1995;10:2007–2016. - PubMed
    1. Mesri EA, Cesarman E, Boshoff C. Kaposi’s sarcoma and its associated herpesvirus. Nat Rev Cancer. 2010;10:707–719. doi:10.1038/nrc2888 - DOI - PMC - PubMed

Publication types