. 2024 Apr 15;14(7):2656-2674.
doi: 10.7150/thno.91456. eCollection 2024.

AXL-specific single domain antibodies show diagnostic potential and anti-tumor activity in Acute Myeloid Leukemia

Affiliations

AXL-specific single domain antibodies show diagnostic potential and anti-tumor activity in Acute Myeloid Leukemia

Niels Vandewalle et al. Theranostics. .

Abstract

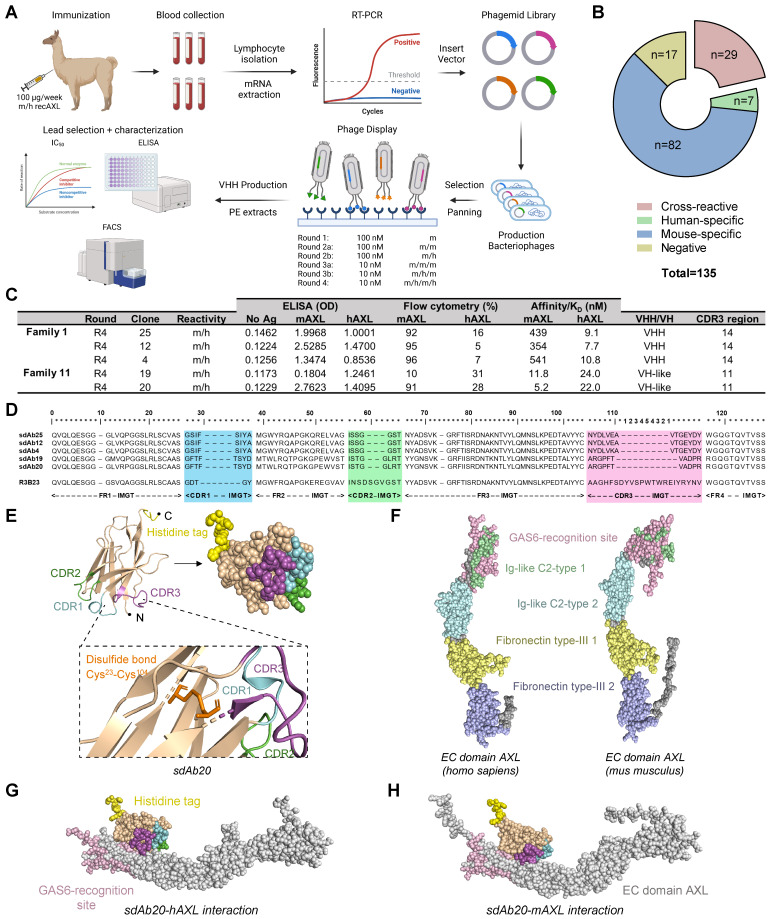
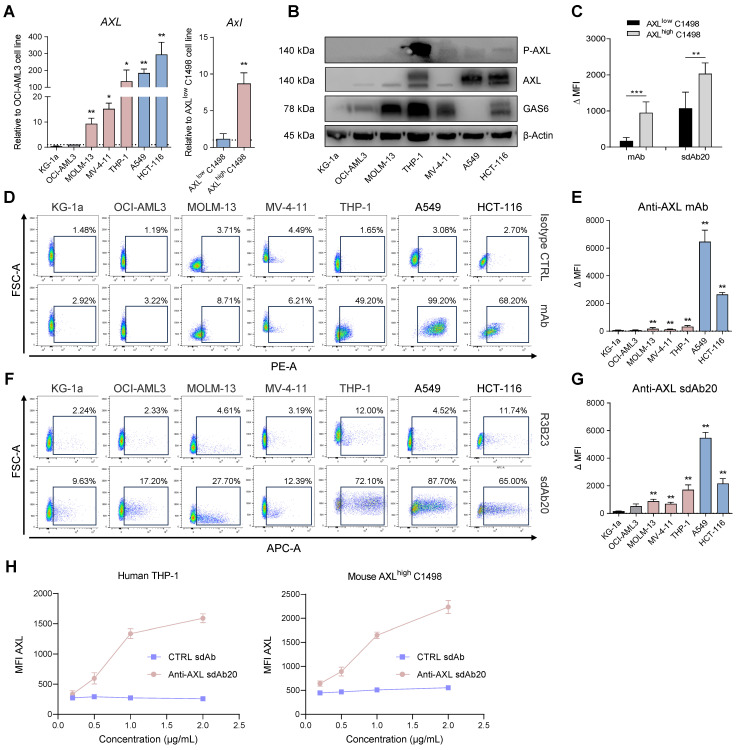
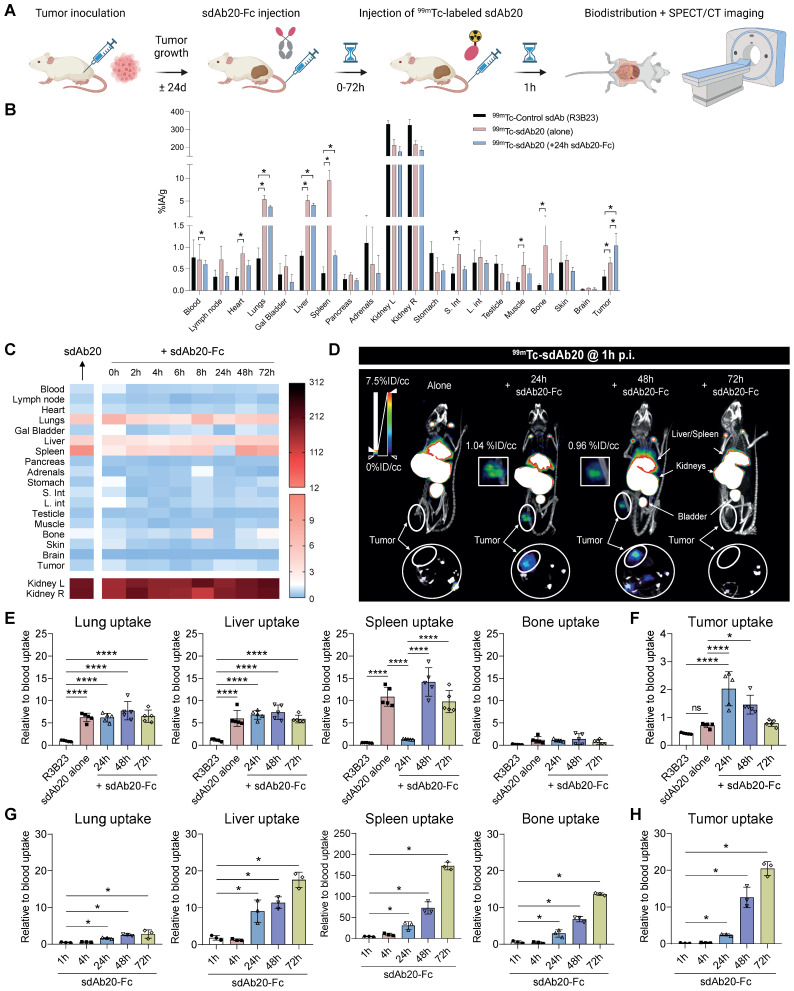
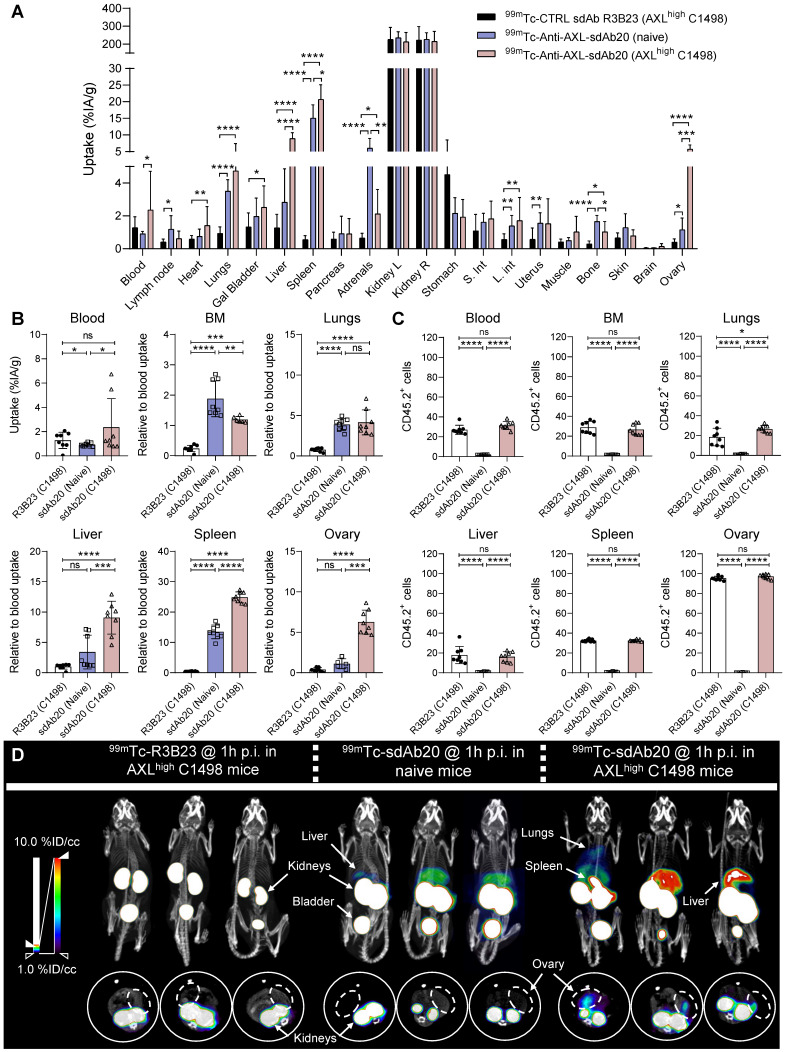
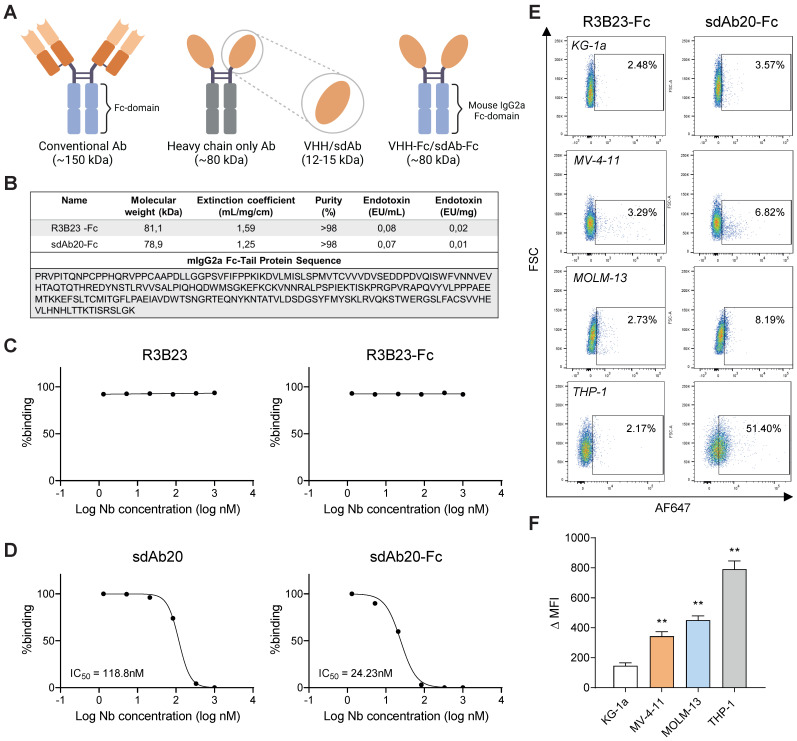
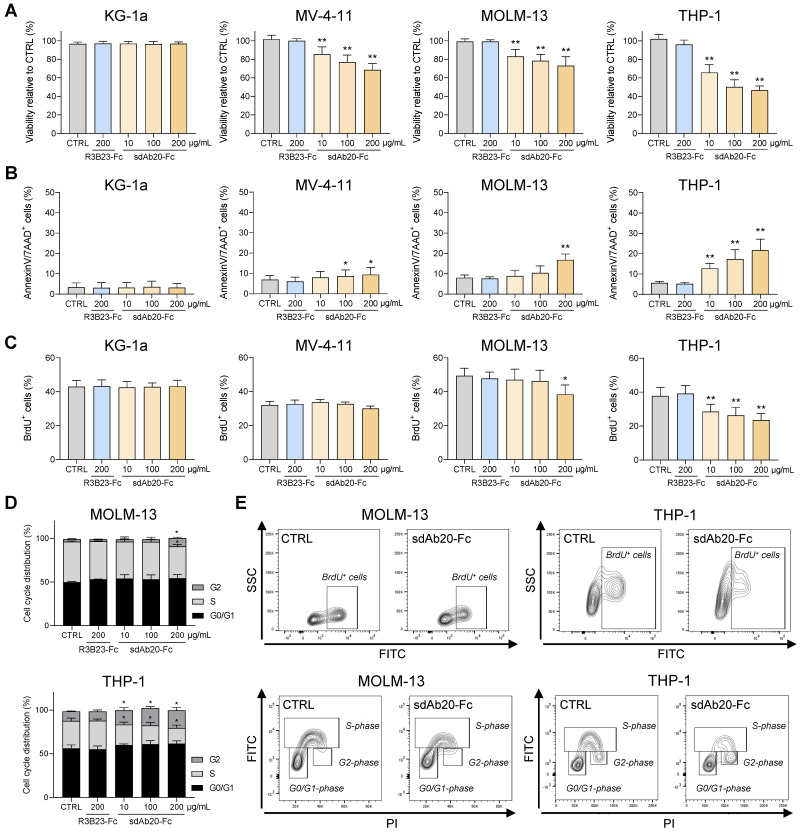
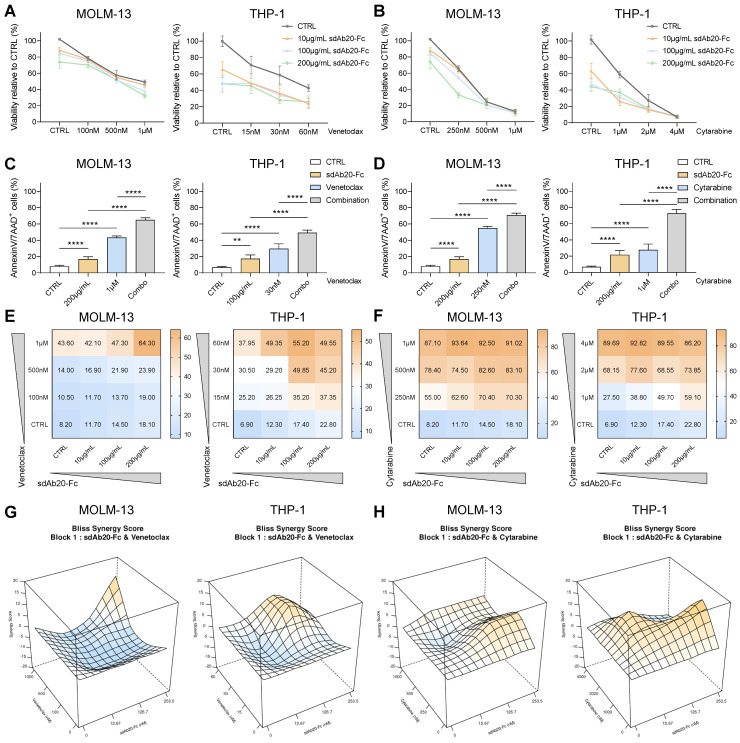
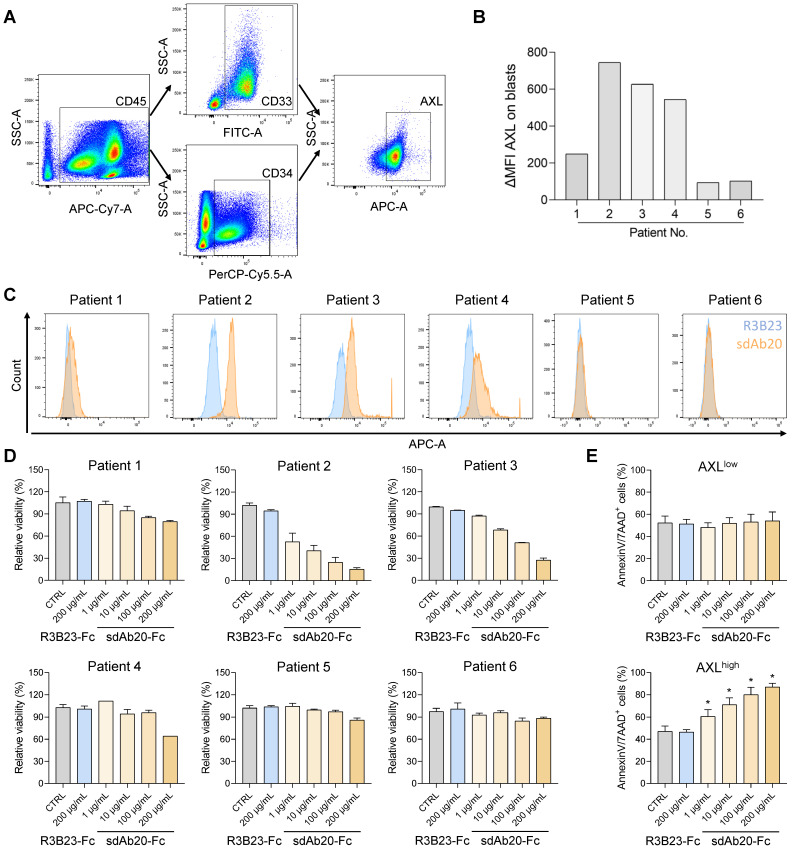
Rationale: AXL expression has been identified as a prognostic factor in acute myeloid leukemia (AML) and is detectable in approximately 50% of AML patients. In this study, we developed AXL-specific single domain antibodies (sdAbs), cross-reactive for both mouse and human AXL protein, to non-invasively image and treat AXL-expressing cancer cells. Methods: AXL-specific sdAbs were induced by immunizing an alpaca with mouse and human AXL proteins. SdAbs were characterized using ELISA, flow cytometry, surface plasmon resonance and the AlphaFold2 software. A lead compound was selected and labeled with 99mTc for evaluation as a diagnostic tool in mouse models of human (THP-1 cells) or mouse (C1498 cells) AML using SPECT/CT imaging. For therapeutic purposes, the lead compound was fused to a mouse IgG2a-Fc tail and in vitro functionality tests were performed including viability, apoptosis and proliferation assays in human AML cell lines and primary patient samples. Using these in vitro models, its anti-tumor effect was evaluated as a single agent, and in combination with standard of care agents venetoclax or cytarabine. Results: Based on its cell binding potential, cross-reactivity, nanomolar affinity and GAS6/AXL blocking capacity, we selected sdAb20 for further evaluation. Using SPECT/CT imaging, we observed tumor uptake of 99mTc-sdAb20 in mice with AXL-positive THP-1 or C1498 tumors. In THP-1 xenografts, an optimized protocol using pre-injection of cold sdAb20-Fc was required to maximize the tumor-to-background signal. Besides its diagnostic value, we observed a significant reduction in tumor cell proliferation and viability using sdAb20-Fc in vitro. Moreover, combining sdAb20-Fc and cytarabine synergistically induced apoptosis in human AML cell lines, while these effects were less clear when combined with venetoclax. Conclusions: Because of their diagnostic potential, sdAbs could be used to screen patients eligible for AXL-targeted therapy and to follow-up AXL expression during treatment and disease progression. When fused to an Fc-domain, sdAbs acquire additional therapeutic properties that can lead to a multidrug approach for the treatment of AXL-positive cancer patients.

Keywords: AXL; acute myeloid leukemia; nuclear imaging; single domain antibodies; therapy.


Conflict of interest statement

Competing Interests: N.D. is co-founder and scientific consultant at Precirix NV and ABSCINT NV. All other authors declare no conflict of interest.

Figures

Figure 1
Figure 1
Generation and initial characterization of AXL-specific single domain antibodies. (A) Schematic illustration of alpaca immunization strategy, sdAb library construction and phage display selection of AXL-specific sdAbs. mRNA from blood lymphocytes served as a template for sdAb-specific PCR reactions, and resultant purified fragments were cloned into phagemids. Subsequently, antigen-specific phages were identified from this phagemid library using ELISA, flow cytometry and surface plasmon resonance. Figure created with BioRender.com. (B) Initial screening of 135 selected clones allowed for further classification into negative, mouse-specific, human-specific and cross-reactive. (C) Based on their characteristics, five cross-reactive sdAbs were selected for further investigation. The table shows a summary of their most important features. (D) Amino acid sequences of the selected anti-AXL sdAbs (numbering accor-ding to IMGT) . The CDR1, CDR2 and CDR3 regions are highlighted in cyan, green and magenta, respectively. (E-F) Structural analy-sis of the selected sdAb20 and the extracellular domain of both murine and human AXL using Alphafold2 and Pymol software. (G-H) Alpha-Fold2 prediction of the interaction between sdAb20 and AXL. CDR = complementarity-determining regions; EC = extracellular; FR = frame-work region.
Figure 2
Figure 2
sdAb20 can specifically distinguish AXLhigh and AXLlow cancer cell lines. (A) Human (AXL) and murine (Axl) gene expression levels of Axl were measured using qRT-PCR after RNA extraction from human AML (KG-1a, OCI-AML3, MOLM-13, MV-4-11 and THP-1), human non-small cell lung carcinoma (A549), human colorectal carcinoma (HCT-116) and murine AML (AXLlow C1498 and AXLhigh C1498) cell lines. Human expression levels relative to OCI-AML3 cell line (n=5, ± SD). Murine expression levels relative to AXLlow C1498 cell line (n=5, ± SD). (B) Western blot analysis for protein expression of AXL, phosphorylated AXL (P-AXL) and GAS6 in extracts from several cancer cell lines (n=4). (C) Binding of sdAb20 to murine AML cell lines was assessed by flow cytometry and compared to an APC-coupled anti-AXL mAb. The anti-AXL mAb was compared to an isotype control and sdAb20 was compared to an irrelevant control sdAb (R3B23) (n=5, ± SD). (D-E) Flow cytometric assessment of AXL expression in several human cancer cell lines using an anti-AXL mAb and a corresponding isotype control (n=5, ± SD). (F-G) Flow cytometric analysis of the binding potential of sdAb20 to human cancer cell lines with a varying AXL expression. The irrelevant sdAb R3B23 served as a negative control (n=5, ± SD). (H) The specificity of the binding potential of sdAb20 to human (THP-1) and murine (C1498) AML cell lines was investigated by administering sdAb20 with increasing doses to two AML cell lines with a high AXL-expression (n=3, ± SD). p ≤ 0.05 (*), p ≤ 0.01 (**) and p ≤ 0.001 (***) were considered statistically significant. FSC = forward scatter, mAb = monoclonal antibody, MFI = median fluorescence intensity, ΔMFI = MFI (anti-AXL mAb) - MFI (isotype CTRL) or MFI (sdAb20) - MFI (CTRL sdAb).
Figure 3
Figure 3
sdAb20 can specifically recognize AXL-expressing cells in the human THP-1 AML xenograft mouse model. (A) Schematic overview of an optimized protocol to investigate the biodistribution profile of sdAb20. 21-24 days post tumor-inoculation, mice will first receive a pre-determined dose of unlabeled, cold sdAb20-Fc, after which they are injected with radiolabeled (99mTc) sdAb20 after 0-72 h. One hour later, mice will undergo SPECT/CT imaging and ex vivo biodistribution through organ collection. Figure created with BioRender.com. (B) The ex vivo biodistribution profile of 99mTc-R3B23, 99mTc-sdAb20 alone and 99mTc-sdAb20 after pre-treatment with sdAb20-Fc for 24 h. Results are presented as mean %IA/g ± SD. (C) Heatmap of accumulation patterns of 99mTc-sdAb20 in various organs at different timepoints upon pre-treatment with sdAb20-Fc. The colour key represents the mean value of tracer accumulation in organs (%IA/g, n=3 for each group, n=5 for 24 h group). (D) Reconstructed SPECT/CT images of THP-1 xenograft mice showing maximum intensity projection and transversal planes. One reconstructed image representing three individual mice. White dashed circles indicate THP-1 tumors. (E) Differences in lung, liver, spleen, bone and (F) tumor, relative to blood uptake. (G) Uptake of 111In-labeled sdAb20-Fc in lung, liver, spleen, bone and (H) tumor at different timepoints. Data were represented as organ-to-blood ratio. p ≤ 0.05 (*) and p ≤ 0.0001 (****) were considered statistically significant. IA = injected activity, ID/cc = injected dose per cubic centimeter.
Figure 4
Figure 4
99mTc-sdAb20 can specifically target and visualize AXL-expressing cells in the syngeneic murine C1498 AML mouse model. (A) Ex vivo γ-counting of isolated organs from naive and AXLhigh C1498 mice. Organs were isolated 90 min post-injection of radiolabeled (99mTc) sdAb20 or R3B23 control tracer (n=5). (B) Uptake of radiolabeled sdAb20 in various hematological organs of naive and AXLhigh C1498 tumor-bearing immunocompetent mice. Data were represented as organ-to-blood ratio. (C) Flow cytometric analysis of end-stage tumorload (CD45.2+ tumor cells) of different organs (n=8, ± SD). (D) Reconstructed SPECT/CT images of naive and AXLhigh C1498 mice, one hour post-injection of 99mTc-labeled anti-AXL sdAb20 and R3B23 control sdAb (n=8). Images show maximum intensity projections and transversal planes; and are reconstructed with OsiriX software. Representative intensities (%IA/g) are shown next to the images. Dashed circles represent ovaries. %ID/cc = injected dose per cubic centimeter. p ≤ 0.05 (*), p ≤ 0.01 (**), p ≤ 0.001 (***) and p ≤ 0.0001 (****) were considered statistically significant.
Figure 5
Figure 5
sdAb20-Fc generation and characterization. (A) Graphical representation of size difference between a conventional Ab, a heavy-chain only Ab, a sdAb and a sdAb-Fc construct. Figure created with BioRender.com. (B) Summarizing table of the most important characteristics of R3B23-Fc and sdAb20-Fc, including the mIgG2a-sequence that was used to generate these constructs. (C-D) Comparison of IC50 values, for blocking of hAXL and hGAS6, of sdAb20 and sdAb20-Fc as determined via a competition assay using surface plasmon resonance. (E-F) Flow cytometric analysis of the binding potential of sdAb20-Fc to human cancer cell lines with a varying AXL expression. The irrelevant sdAb R3B23-Fc served as a negative control (n=4, ± SD). p ≤ 0.01 (**) was considered statistically significant. MFI = median fluorescence intensity.
Figure 6
Figure 6
sdAb20-Fc has promising anti-AML effects as a single agent. (A-B) AML cell lines KG-1a, MV-4-11, MOLM-13 and THP-1 were treated with indicated concentrations of R3B23-Fc (200 μg/mL) or sdAb20-Fc (10, 100 and 200 μg/mL) for 72 h. The effect on cell viability (A) and apoptosis (B) was assessed via CellTiter-Glo assay and Annexin V/7-AAD staining, respectively (KG-1a: n=6; MV-4-11: n=6; MOLM-13: n=5; THP-1: n=6, ± SD). (C) MOLM-13 and THP-1 cells were treated with either R3B23-Fc or increasing concentrations of the sdAb20-Fc construct for 48 h. The number of proliferating cells was assessed using BrdU staining (THP-1: n=5; MOLM-13: n=3, ± SD). (D) Cell cycle analysis was performed on THP-1 and MOLM-13 cells using propidium iodide (PI) staining (THP-1: n=4; MOLM-13: n=3, ± SD). (E) Gating strategy used to determine the number of proliferating cells and to distinguish between the different cell cycle phases (G0/G1-phase, S-phase, G2-phase). p ≤ 0.05 (*) and p ≤ 0.01 (**) were considered statistically significant. CTRL = control.
Figure 7
Figure 7
sdAb20-Fc has synergistic and additive effects when combined with standard-of-care agents cytarabine and venetoclax. (A-D) THP-1 and MOLM-13 cells were treated with increasing concentrations of sdAb20-Fc in combination with increasing concentrations of cytarabine or venetoclax for 72 h. The effect on cell viability (A-B) and induced apoptosis (C-D) was assessed by CellTiter-Glo viability assay and AnnexinV/7-AAD staining, respectively (MOLM-13: n=5, THP-1: n=6, ± SD). (E-F) Heatmaps display the percentage of apoptotic cells for combination treatment of sdAb20-Fc with venetoclax (E) and cytarabine (F). (G-H) Synergy of drug interactions was calculated using the BLISS synergy method. Output is generated in 3D format using the SynergyFinder Plus webtool. Data are represented as mean of five samples. p ≤ 0.01 (**) and p ≤ 0.0001 (****) were considered statistically significant. CTRL = control.
Figure 8
Figure 8
sdAb20-Fc can specifically alter the viability and apoptosis of primary patient samples. (A) Gating strategy to determine the number of blasts (based on SSC-A/CD45-A), the percentage of CD33/CD34-positivity and the percentage of AXL-expression in various AML patients. (B-C) Flow cytometric assessment of AXL expression in CD33/CD34-positive cells of various primary samples using sdAb20 and the control sdAb R3B23. ΔMFI = MFI (sdAb20) - MFI (CTRL sdAb). (D-E) BMMCs of AML patients were treated with R3B23-Fc or increasing concentrations of sdAb20-Fc (10, 100 and 200 µg/mL). The effect on cell viability (D) was assessed using CellTiter-Glo assay (n=2/sample). Apoptosis (E) was measured using AnnexinV/7-AAD staining with flow cytometry. Patients were subdivided into AXLlow and AXLhigh, based on their AXL expression (n=3/group, ± SD). p ≤ 0.05 (*) was considered statistically significant. CTRL = control, BMMCs = bone marrow mononuclear cells.

References

    1. De Kouchkovsky I, Abdul-Hay M. 'Acute myeloid leukemia: a comprehensive review and 2016 update'. Blood Cancer J. 2016;6(7):e441. - PMC - PubMed
    1. Jaramillo S, Schlenk RF. Update on current treatments for adult acute myeloid leukemia: to treat acute myeloid leukemia intensively or non-intensively?. That is the question. Haematologica. 2023;108(2):342–52. - PMC - PubMed
    1. Bhansali RS, Pratz KW, Lai C. Recent advances in targeted therapies in acute myeloid leukemia. J Hematol Oncol. 2023;16(1):29. - PMC - PubMed
    1. Cancer.Net. Leukemia - Acute Myeloid - AML: Statistics. American Society of Clinical Oncology (ASCO) 2023.
    1. Yu J, Jiang PYZ, Sun H, Zhang X, Jiang Z, Li Y. et al. Advances in targeted therapy for acute myeloid leukemia. Biomark Res. 2020;8:17. - PMC - PubMed

Publication types

MeSH terms