. 2024 Apr 22;14(7):2719-2735.
doi: 10.7150/thno.92350. eCollection 2024.

Bifidobacterium breve-derived indole-3-lactic acid ameliorates colitis-associated tumorigenesis by directing the differentiation of immature colonic macrophages

Affiliations

Bifidobacterium breve-derived indole-3-lactic acid ameliorates colitis-associated tumorigenesis by directing the differentiation of immature colonic macrophages

Yuke Li et al. Theranostics. .

Abstract

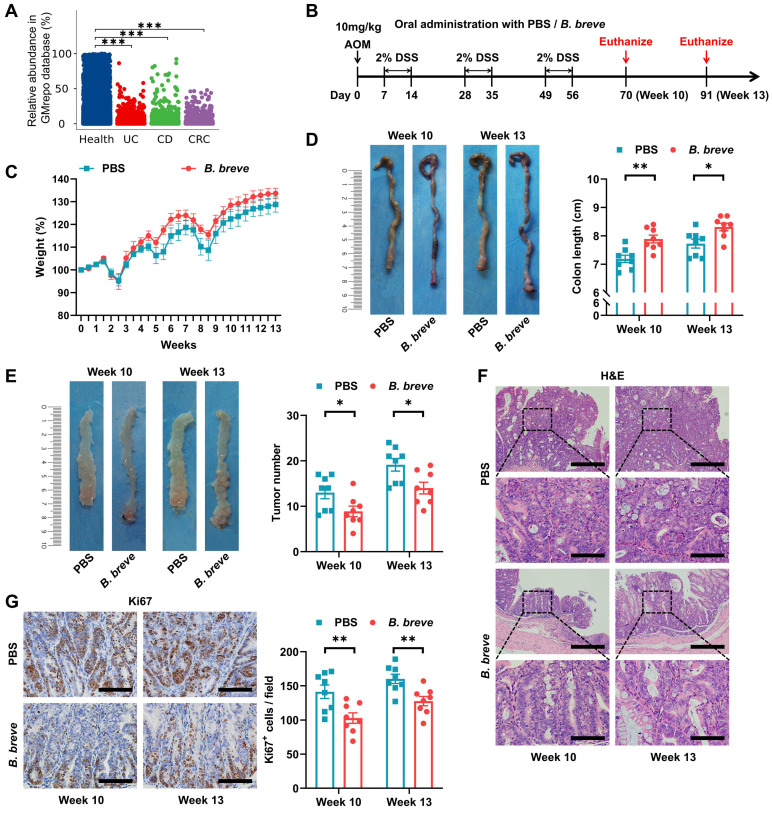
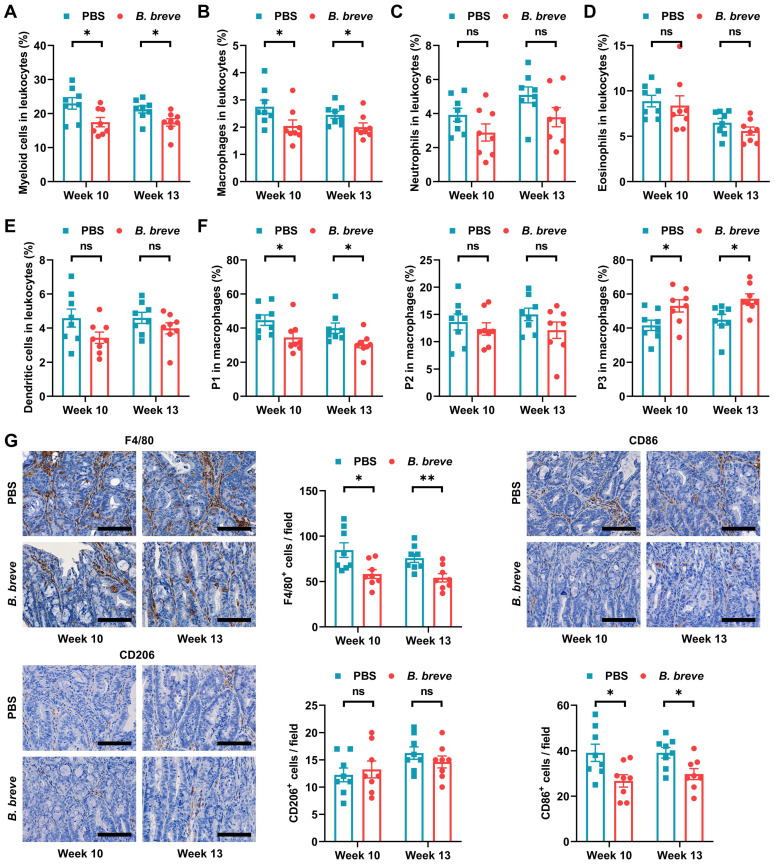
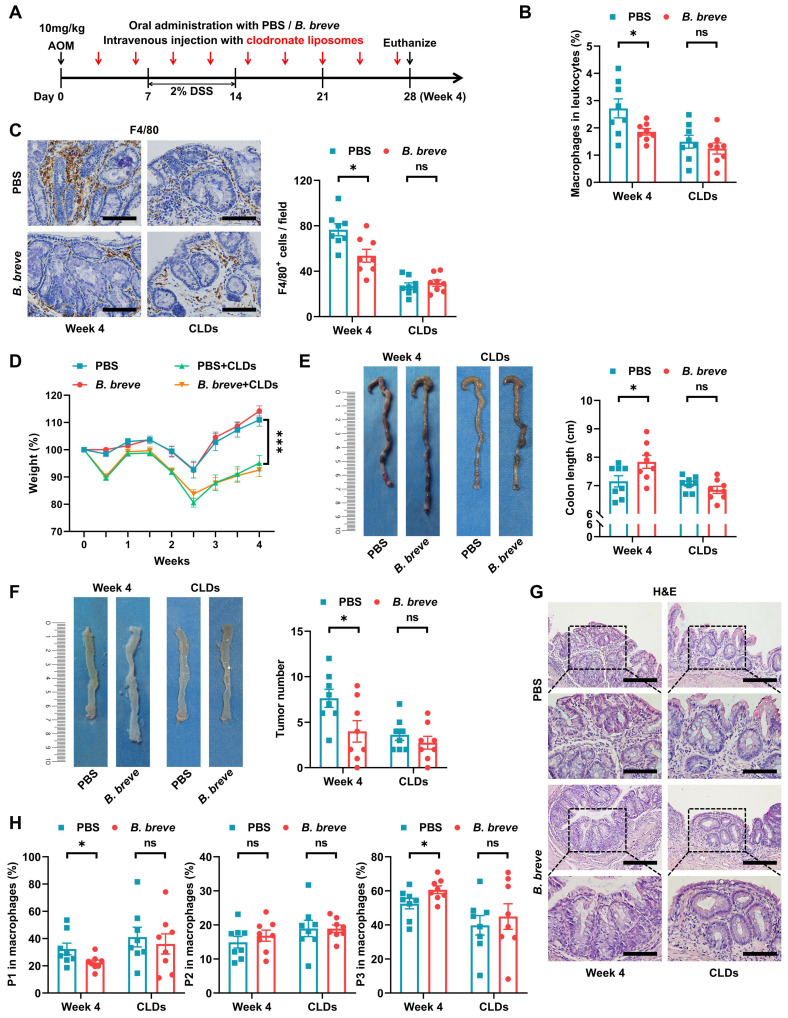
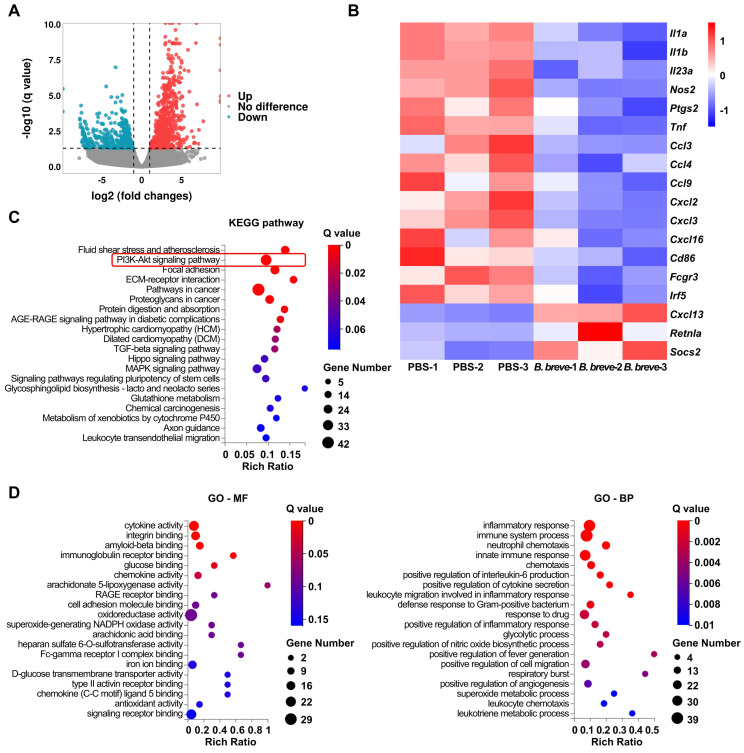
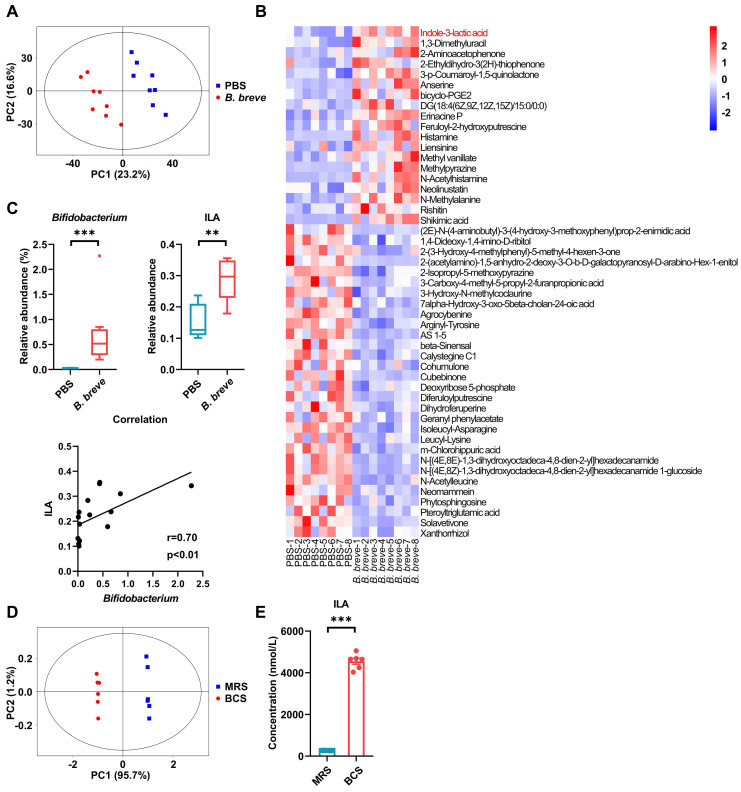
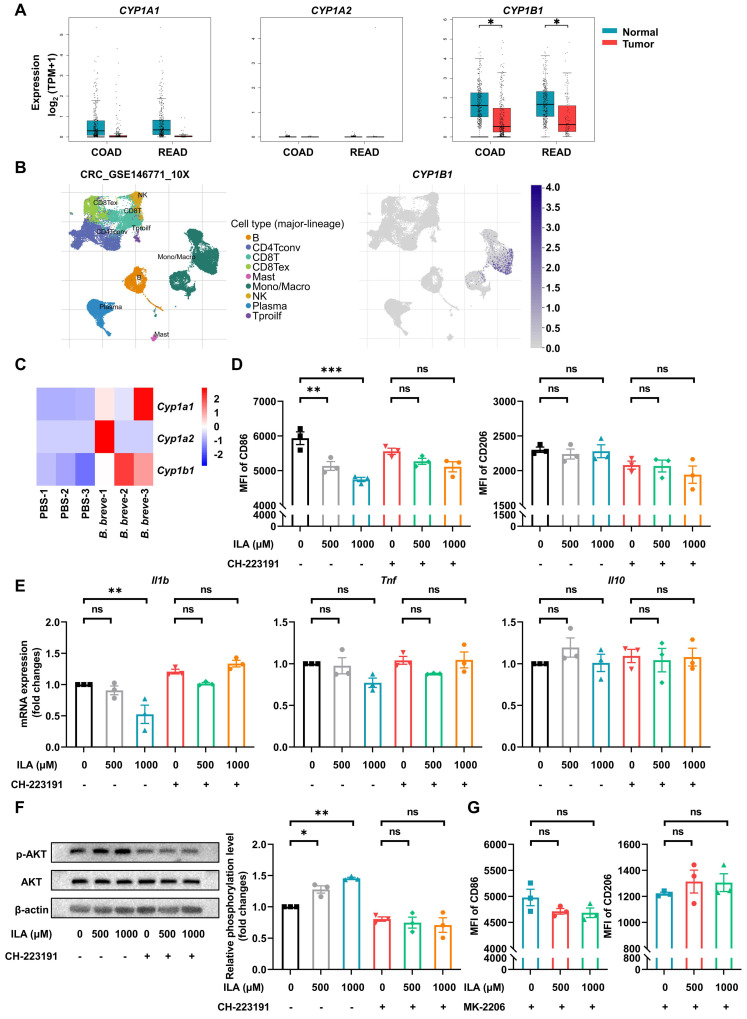
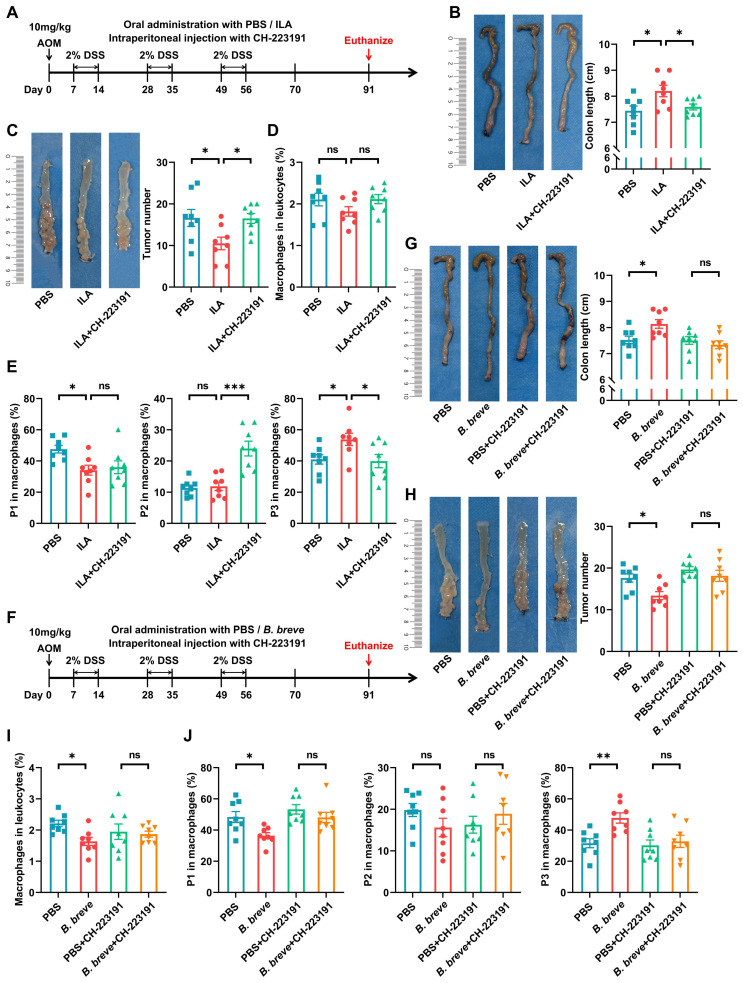
Aim: To elucidate dynamics and functions in colonic macrophage subsets, and their regulation by Bifidobacterium breve (B. breve) and its associated metabolites in the initiation of colitis-associated colorectal cancer (CAC). Methods: Azoxymethane (AOM) and dextran sodium sulfate (DSS) were used to create a CAC model. The tumor-suppressive effect of B. breve and variations of macrophage subsets were evaluated. Intestinal macrophages were ablated to determine their role in the protective effects of B. breve. Efficacious molecules produced by B. breve were identified by non-targeted and targeted liquid chromatography-tandem mass spectrometry (LC-MS/MS) analysis. The molecular mechanism was further verified in murine bone marrow-derived macrophages (BMDMs), macrophages derived from human peripheral blood mononuclear cells (hPBMCs), and demonstrated in CAC mice. Results: B. breve alleviated colitis symptoms, delayed colonic tumorigenesis, and promoted phenotypic differentiation of immature inflammatory macrophages into mature homeostatic macrophages. On the contrary, the ablation of intestinal macrophages largely annulled the protective effects of B. breve. Microbial analysis of colonic contents revealed the enrichment of probiotics and the depletion of potential pathogens following B. breve supplementation. Moreover, indole-3-lactic acid (ILA) was positively correlated with B. breve in CAC mice and highly enriched in the culture supernatant of B. breve. Also, the addition of ILA directly promoted AKT phosphorylation and restricted the pro-inflammatory response of murine BMDMs and macrophages derived from hPBMCs in vitro. The effects of ILA in murine BMDMs and macrophages derived from hPBMCs were abolished by the aryl hydrocarbon receptor (AhR) antagonist CH-223191 or the AKT inhibitor MK-2206. Furthermore, ILA could protect against tumorigenesis by regulating macrophage differentiation in CAC mice; the AhR antagonist largely abrogated the effects of B. breve and ILA in relieving colitis and tumorigenesis. Conclusion: B. breve-mediated tryptophan metabolism ameliorates the precancerous inflammatory intestinal milieu to inhibit tumorigenesis by directing the differentiation of immature colonic macrophages.

Keywords: Bifidobacterium breve; aryl hydrocarbon receptor; colitis-associated tumorigenesis; indole-3-lactic acid; macrophage differentiation.


Conflict of interest statement

Competing Interests: The authors have declared that no competing interest exists.

Figures

Figure 1
Figure 1
B. breve lw01 protects against colonic tumorigenesis in AOM/DSS-induced CRC mice. (A) Fecal abundance of Bifidobacterium in healthy individuals, UC, CD, and CRC patients in the GMrepo database. (B) Schematic diagram for establishing CAC models induced by AOM/DSS in two groups (PBS or B. breve lw01 was administered daily during CAC development). n=8 per group. (C) Weight changes relative to the initial weight during CAC development. (D) Representative colonic images and statistical histogram of colon length. (E) Representative colonic images and statistical histogram of tumor number. (F) Representative H&E staining for the distal colon of each group. Scale bars, 400 µm (upper), 100 µm (lower). (G) Representative IHC staining and quantitation of Ki67 in the distal colon. Scale bars, 100 µm. Data are represented as mean ± SEM. *P < 0.05, **P < 0.01, ***P < 0.001, ns: not significant. AOM: azoxymethane; B. breve: Bifidobacterium breve; CAC: colitis-associated colorectal cancer; CD: Crohn's disease; CRC: colorectal cancer; DSS: dextran sodium sulfate; UC: ulcerative colitis.
Figure 2
Figure 2
B. breve lw01 promotes differentiation from immature inflammatory macrophages to a homeostatic macrophage phenotype. (A-F) Proportion of (A) myeloid cells, (B) macrophages, (C) neutrophils, (D) eosinophils, (E) dendritic cells, and (F) macrophage subsets in the colonic LP assessed by flow cytometry in CAC mice. (G) Representative IHC staining and quantitation of F4/80, CD86, and CD206 in the distal colon. Scale bars, 100 µm. Data are represented as mean ± SEM. *P < 0.05, **P < 0.01, ***P < 0.001, ns: not significant. B. breve: Bifidobacterium breve; CAC: colitis-associated colorectal cancer; LP: lamina propria; P1: immature colonic macrophage; P3: mature colonic macrophage.
Figure 3
Figure 3
Decreased tumorigenesis by B. breve lw01 depends on macrophage participation. (A) Schematic diagram for establishing macrophage-depleted models in four groups (PBS or B. breve lw01 was administered daily, and CLDs were intravenously injected every three days during CAC development). n=8 per group. (B) Proportion of macrophages in the colonic LP assessed by flow cytometry in CAC mice. (C) Representative IHC staining and quantitation of F4/80 in the distal colon. Scale bars, 100 µm. (D) Weight changes relative to the initial weight during CAC development. (E) Representative colonic images and statistical histogram of colon length. (F) Representative colonic images and statistical histogram of tumor number. (G) Representative H&E staining for the distal colon of each group. Scale bars, 200 µm (upper), 100 µm (lower). (H) Proportion of macrophage subsets in the colonic LP assessed by flow cytometry in CAC mice. Data are represented as mean ± SEM. *P < 0.05, **P < 0.01, ***P < 0.001, ns: not significant. AOM: azoxymethane; B. breve: Bifidobacterium breve; CAC: colitis-associated colorectal cancer; CLD: clodronate liposome; DSS: dextran sodium sulfate; LP: lamina propria; P1: immature colonic macrophage; P3: mature colonic macrophage.
Figure 4
Figure 4
B. breve lw01 alters the transcriptional signature and the inflammatory response of colonic macrophages. (A) Scatter plot showing DEGs of the total colonic LP macrophages in the B. breve group vs PBS group in CAC mice (Red dots represent upregulated DEGs, and cyan dots represent downregulated DEGs). (B) Heatmap showing DEGs related to inflammatory response, chemotaxis, and differentiation of colonic macrophages. (C) KEGG pathway enrichment analysis of upregulated DEGs (Dot size represents the number of DEGs, and dot color represents the corresponding Q value). (D) GO pathway enrichment analysis (molecular function and biological process) of downregulated DEGs (Dot size represents the number of DEGs, and dot color represents the corresponding Q value). B. breve: Bifidobacterium breve; CAC: colitis-associated colorectal cancer; DEG: differentially expressed gene; GO-BP: biological process of Gene Ontology; GO-MF: molecular function of Gene Ontology; KEGG: Kyoto Encyclopedia of Genes and Genomes; LP: lamina propria.
Figure 5
Figure 5
B. breve lw01 catabolizes L-tryptophan to release ILA. (A) PCA plot of β-diversity to measure the composition of colonic microbial metabolites in the B. breve group vs PBS group in CAC mice. (B) Heatmap of differential colonic metabolites detected by LC-MS/MS. (C) Correlation analysis between Bifidobacterium and ILA in CAC mice. (D) PCA plot of β-diversity to measure L-tryptophan and its downstream metabolites between B. breve lw01 and MRS supernatant. (E) Concentration for ILA production of B. breve lw01 metabolizing L-tryptophan in vitro. Data are represented as mean ± SEM. *P < 0.05, **P < 0.01, ***P < 0.001, ns: not significant. B. breve: Bifidobacterium breve; BCS: the culture supernatant of B. breve; CAC: colitis-associated colorectal cancer; ILA: indole-3-lactic acid; LC-MS/MS: liquid chromatography-tandem mass spectrometry; MRS: de Man, Rogosa and Sharpe medium; PCA: principal component analysis.
Figure 6
Figure 6
ILA alleviates LPS-induced pro-inflammatory response of murine BMDMs via the PI3K/AKT signaling pathway. (A) Gene expression of CYP1A1, CYP1A2, and CYP1B1 in healthy individuals and CRC patients in the GEPIA database. (B) Gene expression of CYP1B1 in different cell subsets of CRC patients in the TISCH database. (C) Gene expression of Cyp1a1, Cyp1a2, and Cyp1b1 in total colonic LP macrophages of CAC mice between the two groups. (D) Effect of ILA with or without CH-223191 on the proportion of CD86 or CD206 in murine BMDMs, as tested by flow cytometry. (E) Gene expression of Il1b, Tnf, and Il10 in murine BMDMs. (F) Representative Western blot images and statistical histogram of AKT phosphorylation levels in murine BMDMs. (G) Effect of ILA with or without MK-2206 on the proportion of CD86 or CD206 in murine BMDMs, as tested by flow cytometry. Data are represented as mean ± SEM. *P < 0.05, **P < 0.01, ***P < 0.001, ns: not significant. B. breve: Bifidobacterium breve; BMDM: bone marrow-derived macrophage; CAC: colitis-associated colorectal cancer; COAD: colon adenocarcinoma; CRC: colorectal cancer; ILA: indole-3-lactic acid; LP: lamina propria; LPS: lipopolysaccharide; MFI: mean fluorescence intensity; READ: rectum adenocarcinoma.
Figure 7
Figure 7
B. breve lw01 releases ILA to protect against tumorigenesis by AhR-regulated macrophage differentiation. (A) Schematic diagram for establishing CAC models induced by AOM/DSS in three groups (PBS or ILA was administered daily, and CH-223191 was intraperitoneally injected every two days during CAC development). n=8 per group. (B) Representative colonic images and statistical histogram of colon length. (C) Representative colonic images and statistical histogram of tumor number. (D, E) Proportion of (D) macrophages and (E) macrophage subsets in the colonic LP assessed by flow cytometry in CAC mice. (F) Schematic diagram for establishing CAC models induced by AOM/DSS in four groups (PBS or B. breve lw01 was administered daily, and CH-223191 was intraperitoneally injected every two days during CAC development). n=8 per group. (G) Representative colonic images and statistical histogram of colon length. (H) Representative colonic images and statistical histogram of tumor number. (I, J) Proportion of (I) macrophages and (J) macrophage subsets in the colonic LP assessed by flow cytometry in CAC mice. Data are represented as mean ± SEM. *P < 0.05, **P < 0.01, ***P < 0.001, ns: not significant. AhR: aryl hydrocarbon receptor; AOM: azoxymethane; B. breve: Bifidobacterium breve; CAC: colitis-associated colorectal cancer; DSS: dextran sodium sulfate; ILA: indole-3-lactic acid; LP: lamina propria; P1: immature colonic macrophage; P3: mature colonic macrophage.

Similar articles

Cited by

References

    1. Shah SC, Itzkowitz SH. Colorectal Cancer in Inflammatory Bowel Disease: Mechanisms and Management. Gastroenterology. 2022;162:715–30.e3. - PMC - PubMed
    1. Baars JE, Looman CW, Steyerberg EW, Beukers R, Tan AC, Weusten BL. et al. The risk of inflammatory bowel disease-related colorectal carcinoma is limited: results from a nationwide nested case-control study. Am J Gastroenterol. 2011;106:319–28. - PubMed
    1. Lu MJ, Qiu XY, Mao XQ, Li XT, Zhang HJ. Systematic review with meta-analysis: thiopurines decrease the risk of colorectal neoplasia in patients with inflammatory bowel disease. Aliment Pharmacol Ther. 2018;47:318–31. - PubMed
    1. Delfini M, Stakenborg N, Viola MF, Boeckxstaens G. Macrophages in the gut: Masters in multitasking. Immunity. 2022;55:1530–48. - PubMed
    1. Na YR, Stakenborg M, Seok SH, Matteoli G. Macrophages in intestinal inflammation and resolution: a potential therapeutic target in IBD. Nat Rev Gastroenterol Hepatol. 2019;16:531–43. - PubMed

Publication types

MeSH terms

Substances