. 2024 Apr 29;14(7):2835-2855.
doi: 10.7150/thno.92703. eCollection 2024.

CRISPR-Cas9 library screening combined with an exosome-targeted delivery system addresses tumorigenesis/TMZ resistance in the mesenchymal subtype of glioblastoma

Affiliations

CRISPR-Cas9 library screening combined with an exosome-targeted delivery system addresses tumorigenesis/TMZ resistance in the mesenchymal subtype of glioblastoma

Jixing Zhao et al. Theranostics. .

Abstract

Rationale: The large-scale genomic analysis classifies glioblastoma (GBM) into three major subtypes, including classical (CL), proneural (PN), and mesenchymal (MES) subtypes. Each of these subtypes exhibits a varying degree of sensitivity to the temozolomide (TMZ) treatment, while the prognosis corresponds to the molecular and genetic characteristics of the tumor cell type. Tumors with MES features are predominantly characterized by the NF1 deletion/alteration, leading to sustained activation of the RAS and PI3K-AKT signaling pathways in GBM and tend to acquire drug resistance, resulting in the worst prognosis compared to other subtypes (PN and CL). Here, we used the CRISPR/Cas9 library screening technique to detect TMZ-related gene targets that might play roles in acquiring drug resistance, using overexpressed KRAS-G12C mutant GBM cell lines. The study identified a key therapeutic strategy to address the chemoresistance against the MES subtype of GBM. Methods: The CRISPR-Cas9 library screening was used to discover genes associated with TMZ resistance in the U87-KRAS (U87-MG which is overexpressed KRAS-G12C mutant) cells. The patient-derived GBM primary cell line TBD0220 was used for experimental validations in vivo and in vitro. Chromatin isolation by RNA purification (ChIRP) and chromatin immunoprecipitation (ChIP) assays were used to elucidate the silencing mechanism of tumor suppressor genes in the MES-GBM subtype. The small-molecule inhibitor EPIC-0412 was obtained through high-throughput screening. Transmission electron microscopy (TEM) was used to characterize the exosomes (Exos) secreted by GBM cells after TMZ treatment. Blood-derived Exos-based targeted delivery of siRNA, TMZ, and EPIC-0412 was optimized to tailor personalized therapy in vivo. Results: Using the genome-wide CRISPR-Cas9 library screening, we found that the ERBIN gene could be epigenetically regulated in the U87-KRAS cells. ERBIN overexpression inhibited the RAS signaling and downstream proliferation and invasion effects of GBM tumor cells. EPIC-0412 treatment inhibited tumor proliferation and EMT progression by upregulating the ERBIN expression both in vitro and in vivo. Genome-wide CRISPR-Cas9 screening also identified RASGRP1(Ras guanine nucleotide-releasing protein 1) and VPS28(Vacuolar protein sorting-associated protein 28) genes as synthetically lethal in response to TMZ treatment in the U87-KRAS cells. We found that RASGRP1 activated the RAS-mediated DDR pathway by promoting the RAS-GTP transformation. VPS28 promoted the Exos secretion and decreased intracellular TMZ concentration in GBM cells. The targeted Exos delivery system encapsulating drugs and siRNAs together showed a powerful therapeutic effect against GBM in vivo. Conclusions: We demonstrate a new mechanism by which ERBIN is epigenetically silenced by the RAS signaling in the MES subtype of GBM. Restoration of the ERBIN expression with EPIC-0412 significantly inhibits the RAS signaling downstream. RASGRP1 and VPS28 genes are associated with the promotion of TMZ resistance through RAS-GDP to RAS-GTP transformation and TMZ efflux, as well. A quadruple combination therapy based on a targeted Exos delivery system demonstrated significantly reduced tumor burden in vivo. Therefore, our study provides new insights and therapeutic approaches for regulating tumor progression and TMZ resistance in the MES-GBM subtype.

Keywords: CRISPR/Cas9; ERBIN; RASGRP1; VPS28; glioblastoma.


Conflict of interest statement

Competing Interests: The authors have declared that no competing interest exists.

Figures
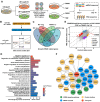
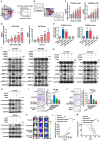
Figure 1
Figure 1
Genome-wide CRISPR-Cas9 library screening identifies ERBIN in the U87-KRAS cells. (A) Schematic representation of the CRISPR-Cas9 library screening and RNA-seq. (B) Analysis of CRISPR screening data. Group 1 represents downstream pathway genes potentially associated with KRAS overexpression. Group 2 represents TMZ treatment-related genes whose deletion leads to TMZ resistance. Group 3 represents KRAS-G12C overexpression-related regulatory genes. Group 4 represents potential TMZ synthetic lethal genes. (C)The Venn diagram of KRAS-related genes. The “cc” represents differential genes obtained by normalization using the “cell cycle” gene set. The “neg” represents differential genes obtained by normalization using the “negative control” gene set. (D) The GO enrichment shows the enrichment of biological process-associated 194 hit genes. (E) The scatter plot of genes obtained by MAGeCKFlute. (F) The Protein-protein interaction (PPI) network diagram of ERBIN.
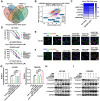
Figure 2
Figure 2
ERBIN is epigenetically silenced in the MES-GBM cells. (A) The Venn diagram of genes from CRISPR screening and mRNA-seq. (B) The heatmap of intersecting genes. (C) ERBIIN mRNA levels in the OE-KRAS, siNF1, and Ctrl GBM cells. (D) ERBIIN protein levels in OE-KRAS, siNF1, and Ctrl GBM cells. (E) The signal peak is located at the promoter region of ERBIN in the H3K27me3 ChIP-seq of GBM cells. (F-G) HOTAIR RNA levels in the OE-KRAS, siNF1, and Ctrl GBM cells. (H) Western blot (WB) analysis of AKT, p-AKT, p65, and p-p65 in the OE-KRAS, siNF1, and Ctrl GBM cells. (I) p65 ChIP at the promoter region of HOTAIR in the OE-KRAS, siNF1, and Ctrl GBM cells. (J) HOTAIR ChIRP at the promoter region of ERBIN in the OE-KRAS, siNF1, and Ctrl GBM cells. To eliminate non-specific signals, two different pools of probes complementary to the HOTAIR were used (even and odd probe sets). Purified DNA was analyzed by PCR using primers specific to ERBIN and GAPDH (negative control) genes. (K) ChIRP-WB showed the EZH2 level bound to HOTAIR in the OE-KRAS, siNF1, and Ctrl GBM cells. To eliminate non-specific signals, two different pools of probes complementary to the HOTAIR were used (even and odd probe sets). (L) Diagram of the relationship between the ERBIN and RAS signaling in the MES-GBM subtype. Data are represented as mean ± standard deviation (s.d.); n = 3 independent experiments. (***P < 0.001, **P < 0.01, *P < 0.05).
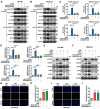
Figure 3
Figure 3
The ERBIN overexpression (OE) inhibited the RAS signaling and downstream proliferation and invasion effects. (A) WB of RAS cascade in the OE-KRAS or siNF1 GBM cells with or without ERBIN OE. (B) WB analysis of p-Rb, CDK4, CDK6, and CyclinD1 in the OE-KRAS or siNF1 GBM cells with or without ERBIN OE. (C) WB analysis of EMT markers in the OE-KRAS or siNF1 GBM cells with or without ERBIN OE. (D) Colony formation assay using the OE-KRAS or siNF1 GBM cells with or without ERBIN OE. (E-F) Transwell assay using the OE-KRAS or siNF1 GBM cells with or without ERBIN OE. Scale bar, 100 µm. Data are represented as mean ± standard deviation (s.d.); n = 3 independent experiments. (***P < 0.001, **P < 0.01, *P < 0.05).
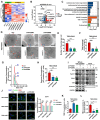
Figure 4
Figure 4
Compound EPIC-0412 inhibits tumor proliferation and EMT progression by upregulating the ERBIN expression both in vitro and in vivo. (A) Drug screening strategy of EPIC-0412. (B) Molecular formula of EPIC-0412 and its interaction with HOTAIR-EZH2. (C-D) Relative ERBIN mRNA levels in the TBD0220-siNF1 and U87-KRAS cells treated with indicated concentrations of EPIC-0412 for 48 h or 20 µM of EPIC-0412 for indicated time points. (E) ChIP at the ERBIN promoter region in the OE-KRAS or siNF1 GBM cells treated with 20 µM of EPIC-0412 for 48 h using an anti-H3K27me3 antibody. WB analysis of (F) ERBIN and RAS cascades, (G) p-Rb, CDK4, CDK6, and CyclinD1, (H) EMT markers in the OE-KRAS or siNF1 GBM cells with or without ERBIN OE and EPIC treatment. (I-J) Transwell assay in the OE-KRAS or siNF1 GBM cells with or without ERBIN OE and EPIC treatment. Scale bar, 100 µm. In F-J, cells were treated with 20 µM of EPIC-0412 for 48 h. (K) Bioluminescence images from the TBD0220-WT, TBD0220-KRAS, TBD0220-OE-KRAS+OE-ERBIN, and TBD0220-OE-KRAS+EPIC groups (15 mg/kg by oral gavage) (n = 6 mice). (L) Quantification of the bioluminescence intensity from all groups. P, two-way ANOVA. (M) Kaplan-Meier survival curve of nude mice. P, Log-rank test. Data are represented as mean ± standard deviation (s.d.); n = 3 independent experiments. (***P < 0.001, **P < 0.01, *P < 0.05).
Figure 5
Figure 5
Genome-wide CRISPR-Cas9 library screening identifies RASGRP1 and VPS28 genes as synthetically lethal in the U87-KRAS cells treated with TMZ. (A) The Venn diagram of synthetically lethal genes. (B) The scatter plot of genes obtained by MAGeCKFlute shows the top synthetically lethal genes of 238 hits. (C) IC50 assay for 48 h treatment of TMZ with downregulation of the top five genes in the OE-KRAS or siNF1 GBM cells, data representing a mean of 3 independent experiments. (D) Cell viability assay for 48 h treatment of TMZ in the OE-KRAS or siNF1 GBM cells with or without RASGRP1/VPS28 KD. (E-G) IF images of γ-H2AX foci in U87 or TBD0220 cells. Scale bar, 30 µm. (H-I) WB analysis of pro- and cleaved-Caspase-3/7. In E-F and H-I, cells were treated with 200 μM of TMZ for 48 h. Data are represented as mean ± standard deviation (s.d.); n = 3 independent experiments. (***P < 0.001, **P < 0.01, *P < 0.05).
Figure 6
Figure 6
RASGRP1 activates the RAS-mediated DNA damage repair (DDR) by promoting the RAS-GTP transformation. (A-B) The RAS signaling activity and RAS-GTP levels were examined by WB in the U87-KRAS and TBD0220-siNF1 cells treated with siRASGRP1 or siControl. (C) ChIP at the promoter regions of DDR genes in TBD0220-siNF1 cells treated with siRASGRP1 or siControl using anti-MYC antibodies. (D) The mRNA levels of DDR genes in TBD0220-siNF1 or siControl cells treated with siRASGRP1 or siControl. (E-F) WB of γ-H2AX and other DDR proteins after treating OE-KRAS or siNF1 GBM cells with siRASGRP1 with 200 μM of TMZ for 48 h. (G-J) TUNEL analysis of RASGRP1 KD or WT cells with or without TMZ treatment (200 μM, 48 h). Scale bar, 100 µm. Data are represented as mean ± standard deviation (s.d.); n = 3 independent experiments. (****P < 0.0001, ***P < 0.001, **P < 0.01, *P < 0.05).
Figure 7
Figure 7
VPS28 promotes the Exos secretion and decreases intracellular TMZ concentration. (A) Heatmap of differentially expressed proteins in the TBD0220-siControl or TBD0220-siVPS28 cells. (B) Volcano plots showing proteins detected by DIA quantitative proteomics in the TBD0220-siControl or TBD0220-siVPS28 cells. (C) Enrichment analysis of differentially expressed proteins. (D-E) Analysis of TEM images and a number of caveolae in the TBD0220-KRAS cells, n = 10. The red arrows indicate caveolae. Scale bars, 5 µm. (F) Total protein levels of Exos secreted by an equal number of TBD0220-KRAS cells with siVPS28 or siControl. (G-H) Quantification and traces of Nanosight analysis for Exos derived from an equal number of TBD0220-KRAS cells with siVPS28 or siControl. (I) WB analysis of Exos markers in the whole cell lysates and Exos from an equal number of TBD0220-KRAS cells. (J) IF images of EEA1 in the U87-KRAS or TBD0220 cells with OE-KRAS or siNF1. Scale bar, 40 µm. (K) Quantification of concentrations of TMZ in the TMZ (200 µM,48 h) treated TBD0220-KRAS cells with siVPS28 or siControl and in Exos from equally treated cells with siVPS28 or siControl. Data are represented as mean ± standard deviation (s.d.); n = 3 independent experiments. (***P < 0.001, **P < 0.01, *P < 0.05).
Figure 8
Figure 8
Construction of the targeted Exos delivery system encapsulating drugs and siRNAs. (A) Preparation process of the Exos-based delivery system. (B) Representative TEM images and size distributions of Exos and Exos-Drug/siRNA. Scale bars, 50 nm. (C) WB analysis of CD63, CD81, Tsg101, and TfR expressions in Exos and Exos-Drug/siRNA groups. (D-E) Real-time fluorescence tracking and quantitation of Cy5.5-Exos in the brain regions of TBD0220-Luc-bearing mice (n = 6). (F) Representative ex vivo bioluminescence and fluorescence images of brains collected at 4- or 24-h post-injection. (G) Representative confocal images of the brain tissues (T denotes tumor and N denotes normal tissue). Scale bars, 100 μm. (H) Representative confocal images of the GBM tissues. Scale bars, 100 μm. (I) EPIC-0412 concentrations in the major organs of GBM-bearing mice after intravenous injection of free drug or Exos-drug/siRNA at 12 h post-injection. Data are represented as mean ± standard deviation (s.d.); n = 3 independent experiments. (**P < 0.01).
Figure 9
Figure 9
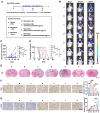
The targeted delivery system shows a powerful GBM therapeutic effect in vivo. (A) The timeline and details of the experimental and control animal groups (n = 6). Tumor-bearing nude mice were treated with vehicle, TMZ (5 mg/kg), or Exos-drug/siRNA. (B) Bioluminescence images from representative mice of all the groups. (C) Quantification of bioluminescence intensity from all the groups. P, two-way ANOVA. (D) Kaplan-Meier survival curve of nude mice. P, Log-rank test. (E) Representative images of H&E staining from all the groups of mice. Scale bars, 2 mm. (F-G) IHC images of tumor tissues showing Ki-67 and γ-H2AX expressions. Scale bars, 100 µm. Data are represented as the mean ± s.d.; n = 6 mice. (***P < 0.001, **P < 0.01, *P < 0.05, ns = not significant).
Figure 10
Figure 10
Mechanism of action of quadruple combination therapy based on the targeted Exos delivery system.

References

    1. Tan AC, Ashley DM, López GY, Malinzak M, Friedman HS, Khasraw M. Management of glioblastoma: State of the art and future directions. CA Cancer J Clin. 2020;70:299–312. - PubMed
    1. Verdugo E, Puerto I, Medina MÁ. An update on the molecular biology of glioblastoma, with clinical implications and progress in its treatment. Cancer Commun (Lond) 2022;42:1083–111. - PMC - PubMed
    1. Schaff LR, Mellinghoff IK. Glioblastoma and Other Primary Brain Malignancies in Adults: A Review. JAMA. 2023;329:574–87. - PMC - PubMed
    1. Shergalis A, Bankhead A, Luesakul U, Muangsin N, Neamati N. Current Challenges and Opportunities in Treating Glioblastoma. Pharmacol Rev. 2018;70:412–45. - PMC - PubMed
    1. Behnan J, Finocchiaro G, Hanna G. The landscape of the mesenchymal signature in brain tumours. Brain. 2019;142:847–66. - PMC - PubMed

Publication types

MeSH terms