. 2024 Apr 28;14(7):2794-2815.
doi: 10.7150/thno.94482. eCollection 2024.

Nicotinamide phosphoribosyltransferase prompts bleomycin-induced pulmonary fibrosis by driving macrophage M2 polarization in mice

Affiliations

Nicotinamide phosphoribosyltransferase prompts bleomycin-induced pulmonary fibrosis by driving macrophage M2 polarization in mice

Yaling Chen et al. Theranostics. .

Abstract

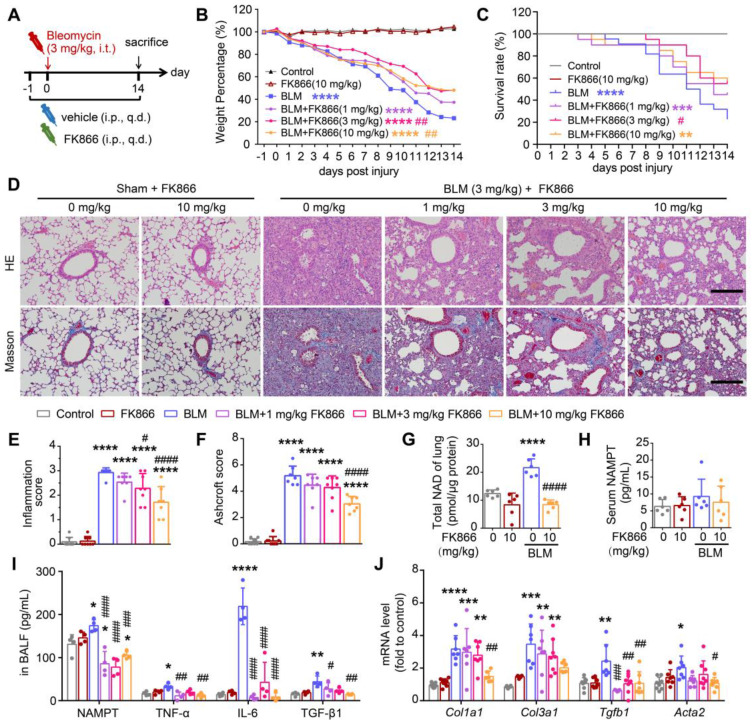
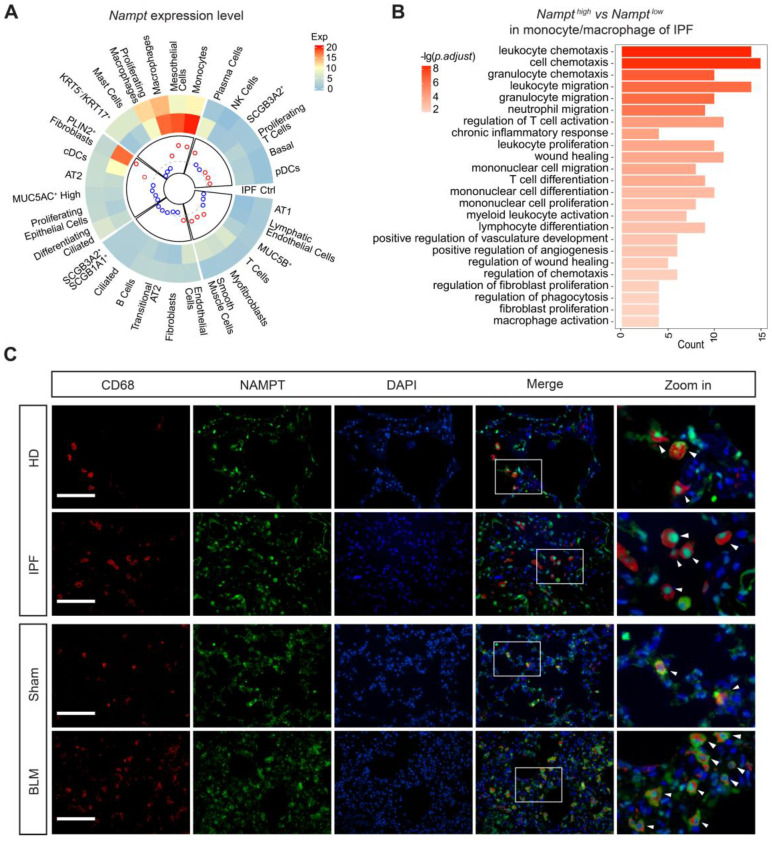
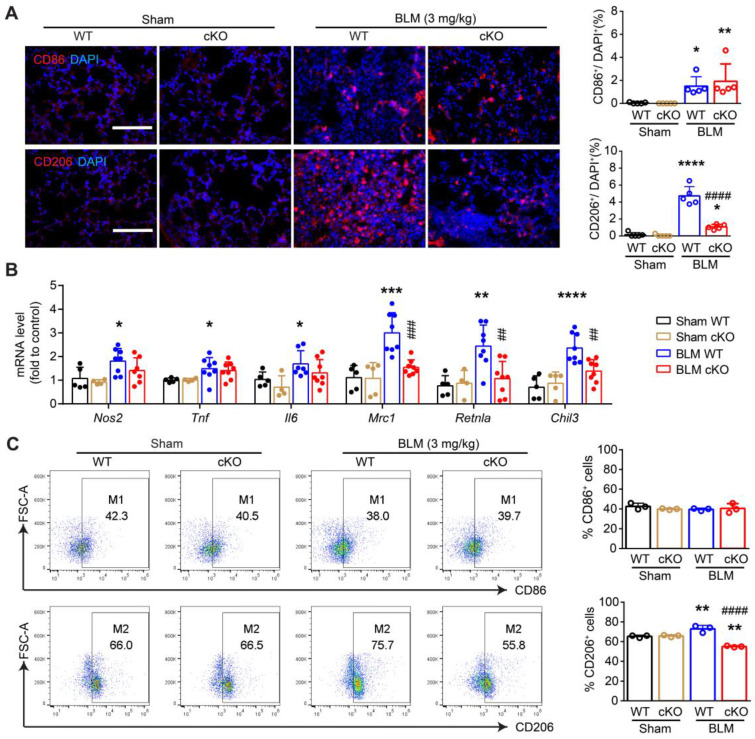
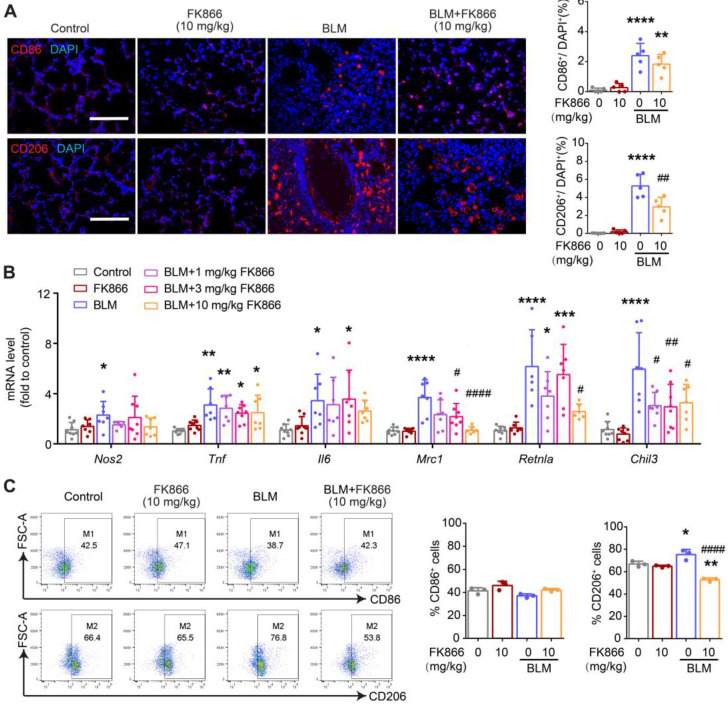
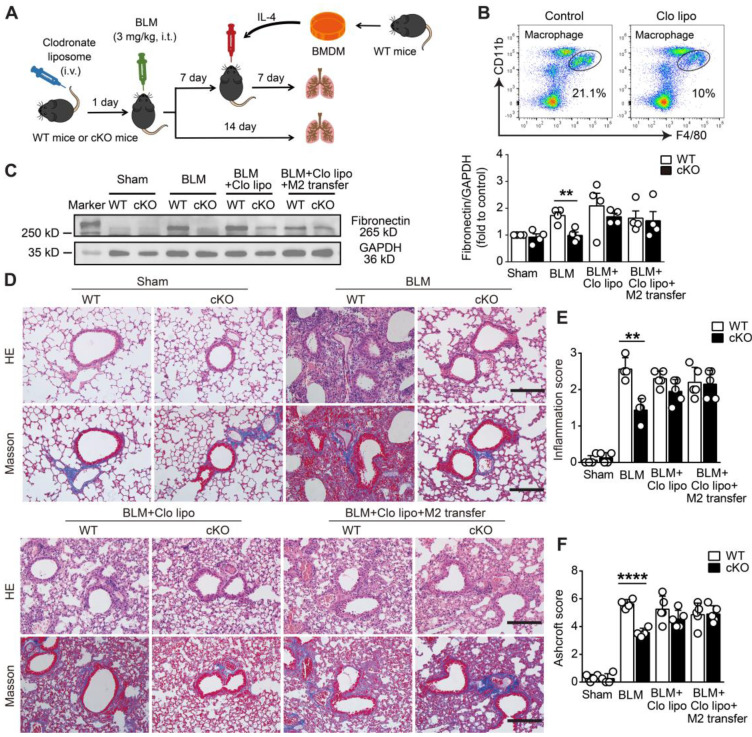
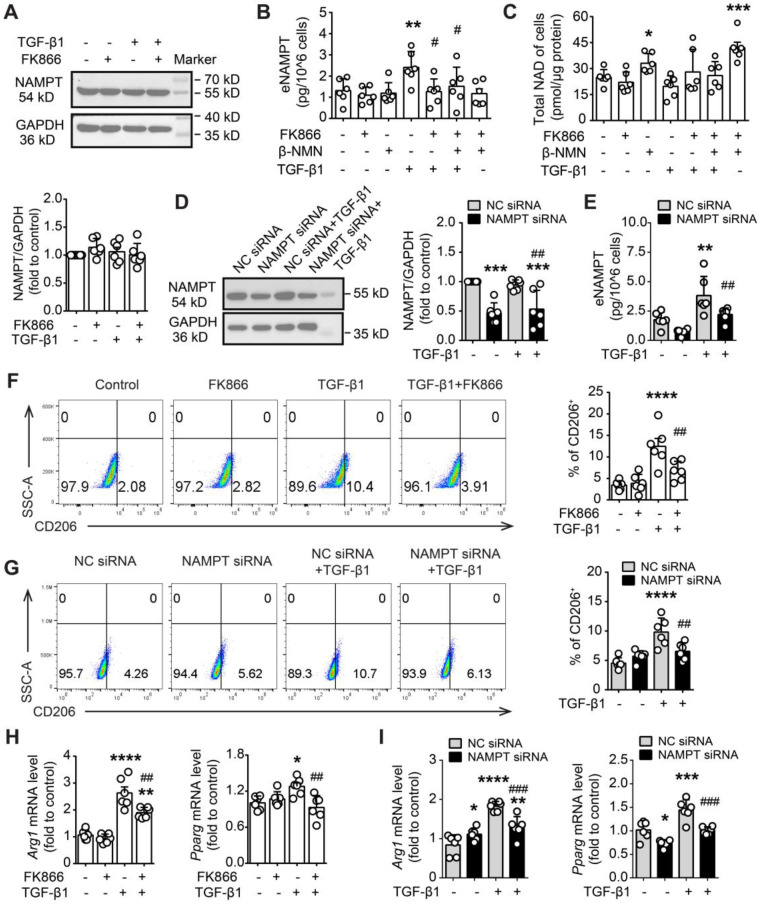
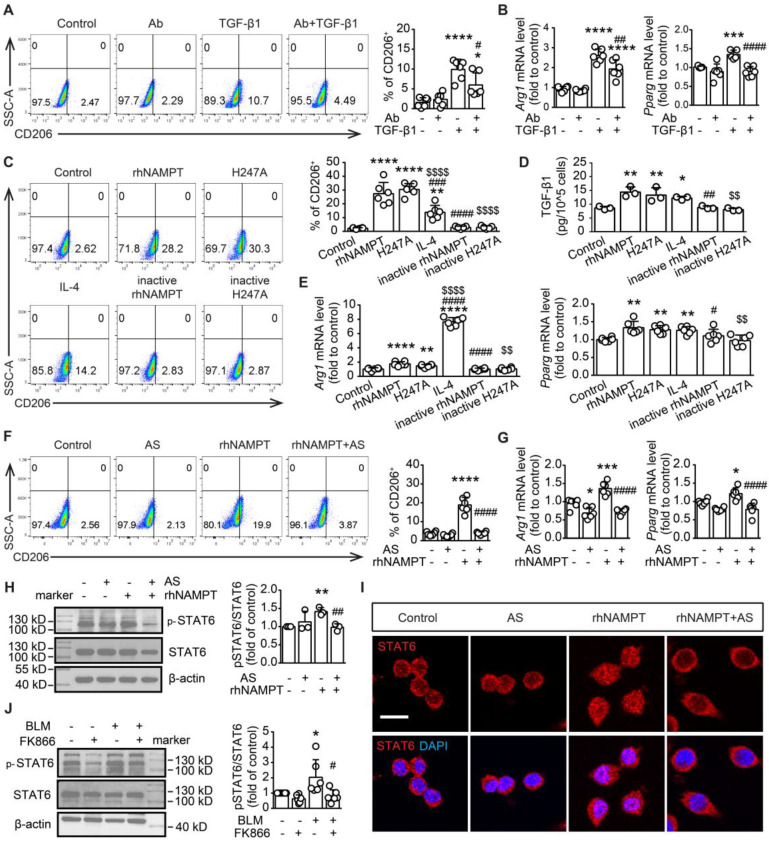
Rationale: Idiopathic pulmonary fibrosis (IPF) is an irreversible, fatal interstitial lung disease lacking specific therapeutics. Nicotinamide phosphoribosyltransferase (NAMPT), the rate-limiting enzyme of the nicotinamide adenine dinucleotide (NAD) salvage biosynthesis pathway and a cytokine, has been previously reported as a biomarker for lung diseases; however, the role of NAMPT in pulmonary fibrosis has not been elucidated. Methods: We identified the NAMPT level changes in pulmonary fibrosis by analyzing public RNA-Seq databases, verified in collected clinical samples and mice pulmonary fibrosis model by Western blotting, qRT-PCR, ELISA and Immunohistochemical staining. We investigated the role and mechanism of NAMPT in lung fibrosis by using pharmacological inhibition on NAMPT and Nampt transgenic mice. In vivo macrophage depletion by clodronate liposomes and reinfusion of IL-4-induced M2 bone marrow-derived macrophages (BMDMs) from wild-type mice, combined with in vitro cell experiments, were performed to further validate the mechanism underlying NAMPT involving lung fibrosis. Results: We found that NAMPT increased in the lungs of patients with IPF and mice with bleomycin (BLM)-induced pulmonary fibrosis. NAMPT inhibitor FK866 alleviated BLM-induced pulmonary fibrosis in mice and significantly reduced NAMPT levels in bronchoalveolar lavage fluid (BALF). The lung single-cell RNA sequencing showed that NAMPT expression in monocytes/macrophages of IPF patients was much higher than in other lung cells. Knocking out NAMPT in mouse monocytes/macrophages (Namptfl/fl;Cx3cr1CreER) significantly alleviated BLM-induced pulmonary fibrosis in mice, decreased NAMPT levels in BALF, reduced the infiltration of M2 macrophages in the lungs and improved mice survival. Depleting monocytes/macrophages in Namptfl/fl;Cx3cr1CreER mice by clodronate liposomes and subsequent pulmonary reinfusion of IL-4-induced M2 BMDMs from wild-type mice, reversed the protective effect of monocyte/macrophage NAMPT-deletion on lung fibrosis. In vitro experiments confirmed that the mechanism of NAMPT engaged in pulmonary fibrosis is related to the released NAMPT by macrophages promoting M2 polarization in a non-enzyme-dependent manner by activating the STAT6 signal pathway. Conclusions: NAMPT prompts bleomycin-induced pulmonary fibrosis by driving macrophage M2 polarization in mice. Targeting the NAMPT of monocytes/macrophages is a promising strategy for treating pulmonary fibrosis.

Keywords: M2 polarization; STAT6; macrophage; nicotinamide phosphoribosyltransferase; pulmonary fibrosis.


Conflict of interest statement

Competing Interests: The authors have declared that no competing interest exists.

Figures

Figure 1
Figure 1
NAMPT is upregulated in human and mouse fibrotic lungs. (A) Volcanic map of differentially expressed genes (DEGs) in the lung of idiopathic pulmonary fibrosis (IPF) patients compared to that of healthy donors (HD). Transcriptomic data sources: GSE110147, GSE72073, GSE53845. (B-C) Western blotting analysis (B) and quantification (C) for the expression of NAMPT in the lungs of HD and IPF patients (n = 6-7). (D) Relative mRNA expression of NAMPT in the lungs of HD and IPF patients. (n = 6-7). (E) Immunohistochemical staining of NAMPT in the human lung sections. Bar = 100 μm (n = 3). (F-I) The mouse lung tissue was sampled at 14 days after bleomycin (BLM, 3 mg/kg) intratracheal administration. Western blotting analysis (F) and quantification (G) for the expression of NAMPT (n = 6). (H) Relative mRNA expression of NAMPT of the mouse lungs (n = 6). (I) Immunohistochemical staining of NAMPT. Bar = 100 μm (n = 3). Mean ± SD, *P < 0.05, **P < 0.01, unpaired t-test.
Figure 2
Figure 2
NAMPT inhibitor FK866 mitigates bleomycin-induced lung fibrotic injury in mice. (A) Schematic draw of the experimental design. Bleomycin (BLM, 3 mg/kg) and FK866 (1, 3, 10 mg/kg) were administrated via intratracheal and intraperitoneal injection, respectively. (B) The mouse body weight was recorded at the indicated time and shown as percentage of the baseline body weight. (C) Kaplan-Meier curves for survival rate of the mice. Control group, n = 12; FK866 alone group, n = 12; BLM administrated group, n = 20-22. (D) Representative graphs of HE and Masson's trichrome staining of mouse lungs. Bar = 200 μm. (E, F) The development of lung lesions revealed by HE and Masson's trichrome staining was scored according to the double-blind principle (n = 7-8). (G-H) The NAD levels in the lung tissue (G) and the extracellular NAMPT levels in the serum (H) were determined using ELISA (n = 6). (I) ELISA analysis of extracellular NAMPT, TNF-α, IL-6, and TGF-β1 in BALF (n = 4). (J) Relative mRNA expression of the collagen factors (Col1a1, Col3a1, Tgfb1 and Acta2) (n = 7-8). Mean ± SD, *P < 0.05, **P < 0.01, ***P < 0.001, ****P < 0.0001, compared with Control. #P < 0.05, ##P < 0.01, ###P < 0.001, ####P < 0.0001, compared with BLM, one-way ANOVA.
Figure 3
Figure 3
NAMPT is highly expressed on monocytes/macrophages in fibrotic lungs, which is closely associated with pulmonary fibrosis. (A) Single-cell transcriptomes of lung cells from 12 IPF and 10 control (Ctrl) were jointly analyzed using the original data from the Banovich/Kropski's dataset (Habermann et al., 2020). The data was annotated according to cell type and diagnosis, and then a circular heatmap was utilized to display NAMPT mRNA expression in each cell type, stratified by disease state. The outer rings represent the log expression level, and the inner rings represent the log fold change (IPF vs control) in absolute expression level. The dotted line denotes a fold change of 1 (log 10 FC = 0). The red circles indicate the log 10 FC > 0 and the blue represent the log 10 FC < 0. (B) GO enrichment analysis of differentially expressed genes (Nampthigh vs Namptlow) in monocyte/macrophage of IPF. The vertical axis represents the cell signaling pathway category, and the horizontal axis represents the enriched gene count. The color key represents the negative of log 10 (p-adjust value). (C) Representative images for co-immunostaining of the macrophage marker CD68 (red) and NAMPT (green) in the lung. Bar = 100 μm (n = 3).
Figure 4
Figure 4
NAMPT deficiency in monocyte/macrophage ameliorates BLM-induced pulmonary fibrosis in mice. (A) Schematic draw of the Nampt gene conditioning knockout in the monocyte/macrophage of the mouse and the experimental design. (B, C) The bone marrow (BM) cells were purified preliminarily by lysing and removing erythrocytes, and then Western blotting analysis was performed to determine the NAMPT expression in the bone marrow cells. Mean ± SD (n = 4), *P < 0.05, compared with WT, unpaired t-test. (D) Total NAD level of bone marrow cells. Mean ± SD (n = 6), *P < 0.05, unpaired t-test. (E) Mouse body weight was recorded at the indicated days post lung injury and is shown as percentage of the baseline body weight. (F) Kaplan-Meier curves for survival rate of the mice. Sham, n = 12; BLM, n = 20-21. (G) Representative HE and Masson's trichrome staining graphs. Bar = 200 μm. (H, I) The lung lesions revealed by HE and Masson's trichrome staining were scored double-blindly (n = 8). (J) ELISA analysis of eNAMPT, TNF-α, IL-6, and TGF-β1 in BALF (n = 4). (K) Relative mRNA expression of collagen factors (Col1a1, Col3a1, Tgfb1 and Acta2) (n = 5-8). Mean ± SD, *P < 0.05, **P < 0.01, ***P < 0.001, ****P < 0.0001, compared with Sham-WT. #P < 0.05, ##P < 0.01, ###P < 0.001, ####P < 0.0001, compared with BLM-WT, one-way ANOVA.
Figure 5
Figure 5
Deletion of NAMPT in monocytes/macrophages decreases BLM-induced macrophage M2 polarization in mouse lungs. The mouse with Nampt gene conditioning knockout in the monocyte/macrophage, was treated with BLM (3 mg/kg) to induce fibrotic lung injury. Fourteen days after BLM treatment, mice were sampled for lung tissues. (A) Immunofluorescence staining of CD86 (M1 marker) or CD206 (M2 marker) in the mouse lungs. Bar = 100 μm (n = 5). (B) Relative mRNA expression of M1 markers (Nos2, Tnf, Il6) and M2 markers (Mrc1, Retnla, Chil3) (n = 5-8). (C) Flow cytometry analysis of the proportion of CD86+ (M1) and CD206+ (M2) macrophages (CD45+F4/80+CD11b+) (n = 3). Mean ± SD. *P < 0.05, **P < 0.01, ***P < 0.001, ****P < 0.0001, compared with Sham-WT. ##P < 0.01, ###P < 0.001, ####P < 0.0001, compared with BLM-WT, one-way ANOVA.
Figure 6
Figure 6
FK866 decreases bleomycin-induced macrophage M2 polarization in the mouse lung. Mouse lung fibrosis was induced with one dose of 3 mg/kg bleomycin via intrabronchial injection. FK866 was administrated intraperitoneal injection once per day for 16 consecutive days, starting one day before bleomycin treatment. (A) Immunofluorescence staining and analysis of the M1 marker CD86 and the M2 marker CD206 (n = 5). Bar = 100 μm. (B) Relative mRNA expression of M1 markers (Nos2, Tnf, Il6) and M2 markers (Mrc1, Retnla, Chil3) (n = 7-8). (C) Flow cytometry analysis for the proportion of CD86+ (M1) and CD206+ (M2) among lung macrophages (CD45+F4/80+CD11b+) (n = 3). Mean ± SD. *P < 0.05, **P < 0.01, ***P < 0.001, ****P < 0.0001, compared with Control. #P < 0.05, ##P < 0.01, ####P < 0.0001, compared with bleomycin treatment (BLM), one-way ANOVA.
Figure 7
Figure 7
Deletion of NAMPT in monocytes/macrophages protects mice against BLM-induced pulmonary fibrosis by reducing M2 programming. (A) Schematic representation of the macrophage adoptive transfer experiment design. Bone marrow-derived macrophages (BMDMs) from WT mice were induced to M2 polarization using IL-4 (20 ng/mL). The IL-4-induced WT M2 BMDMs were adoptively transferred into clodronate liposome-treated or control liposome-treated WT and NAMPT cKO mice (specific deletion of NAMPT in monocyte/macrophage) through intratracheal injection seven days after BLM administration. (B) Flow cytometry analysis for the proportion of macrophages 24 h after the tail vein injection of clodronate liposome (n = 3). (C) Western blot analysis of Fibronectin protein level in the mouse lungs (n = 4). (D) Representative graphs of HE and Masson's trichrome staining. Bar = 200 μm. (E, F) Lung inflammation and fibrosis score (n = 4-5). Mean ± SD, **P < 0.01, ****P < 0.0001, unpaired t-test.
Figure 8
Figure 8
FK866 and NAMPT siRNA inhibit TGF-β1-induced NAMPT releasing and M2 polarization in RAW264.7 macrophages. (A-C, F, H) RAW264.7 cells were treated with FK866 (1 nM) and β-NMN (100 μΜ) 30 min before the addition of TGF-β1 (20 ng/mL). (D-E, G, I) RAW264.7 cells were transfected with negative control (NC) siRNA or NAMPT siRNA, and then treated with TGF-β1 (20 ng/mL) for 24 h. (A, D) Western blot analysis of NAMPT expression. (B, E) ELISA assay of NAMPT releasing in the culture supernatant. (C) Quantification of the intracellular NAD level using a commercial kit. (F, G) Flow cytometry analysis of CD206-positive cells (M2 polarization). (H, I) qRT-PCR analysis of M2 polarization markers (Arg1 and Pparg). Mean ± SD (n = 6). *P < 0.05, **P < 0.01, ***P < 0.001, ****P < 0.0001, compared with Control or NC siRNA, #P < 0.05, ##P < 0.01, ###P < 0.001, compared with TGF-β1 or NC siRNA+ TGF-β1, one-way ANOVA.
Figure 9
Figure 9
Extracellular NAMPT induces M2 polarization in an enzyme-independent manner by activating the STAT6 pathway. (A-B) RAW264.7 were exposed to TGF-β1 (20 ng/mL) for 24 h, with or without pre-treatment with NAMPT antibody (Ab, 0.55 ng/mL) to neutralize the released eNAMPT, and then subjected to flow cytometry analysis of M2 programming (CD206 as a marker) (A), and mRNA level detection of M2 polarization markers (Arg1, Pparg) (B). (C-E) RAW264.7 were treated with PBS (vehicle), rhNAMPT (300 nM), NAMPTH247A (H247A, 300 nM), IL-4 (30 ng/mL), heat-inactive NAMPT protein (300 nM) or heat-inactive NAMPTH247A (300 nM) for 24 h, and fed to analysis of M2 polarization (C, E) and TGF-β1 releasing (D). (F-I) RAW264.7 cells were treated with a STAT6 inhibitor AS1517499 (AS, 10 nM) for 1 h, followed by rhNAMPT (300 nM) stimulation for 24 h, and then subjected to flow cytometry analysis (F), mRNA level detection (G), quantification of pSTAT6/STAT6 ratio (H), immunofluorescence of STAT6 (red) and DAPI (blue) to show STAT6 nuclear translocation (I). Bar = 20 μm. (J) Mouse lung fibrosis was induced with one dose of 3 mg/kg bleomycin via intrabronchial injection. FK866 (10 mg/kg) was administrated by intraperitoneal injection once per day for 16 consecutive days starting one day before bleomycin treatment. The protein level of STAT6 and phosphor-STAT6 were determined using Western blotting. Mean ± SD (n = 3-6). *P < 0.05, **P < 0.01, ***P < 0.001, ****P < 0.0001, compared with Control. #P < 0.05, ##P < 0.01, ####P < 0.0001, compared with TGF-β1 or rhNAMPT or BLM, one-way ANOVA (A-B, F-J). *P < 0.05, **P < 0.01, ****P < 0.0001, compared with Control. #P < 0.05, ##P < 0.01, ###P < 0.001, ####P < 0.0001, compared with rhNAMPT. $P < 0.05, $$P < 0.01, $$$$P < 0.0001, compared with H247A, one-way ANOVA (C-E).

Similar articles

Cited by

References

    1. Lederer DJ, Martinez FJ. Idiopathic Pulmonary Fibrosis. N Engl J Med. 2018;378:1811–23. - PubMed
    1. Richeldi L, Collard HR, Jones MG. Idiopathic pulmonary fibrosis. Lancet. 2017;389:1941–52. - PubMed
    1. Cho SJ, Stout-Delgado HW. Aging and Lung Disease. Annu Rev Physiol. 2020;82:433–59. - PMC - PubMed
    1. Jia Q, Li Q, Wang Y, Zhao J, Jiang Q, Wang H. et al. Lung microbiome and transcriptome reveal mechanisms underlying PM2.5 induced pulmonary fibrosis. Sci Total Environ. 2022;831:154974. - PubMed
    1. Podolanczuk AJ, Thomson CC, Remy-Jardin M, Richeldi L, Martinez FJ, Kolb M. et al. Idiopathic pulmonary fibrosis: state of the art for 2023. Eur Respir J. 2023;61:2200957. - PubMed

Publication types

Substances