. 2024 Apr 16;6(2):217-232.
doi: 10.1016/j.jaccao.2024.02.005. eCollection 2024 Apr.

Anthracycline Cardiotoxicity Induces Progressive Changes in Myocardial Metabolism and Mitochondrial Quality Control: Novel Therapeutic Target

Affiliations

Anthracycline Cardiotoxicity Induces Progressive Changes in Myocardial Metabolism and Mitochondrial Quality Control: Novel Therapeutic Target

Anabel Díaz-Guerra et al. JACC CardioOncol. .

Abstract

Background: Anthracycline-induced cardiotoxicity (AIC) debilitates quality of life in cancer survivors. Serial characterizations are lacking of the molecular processes occurring with AIC.

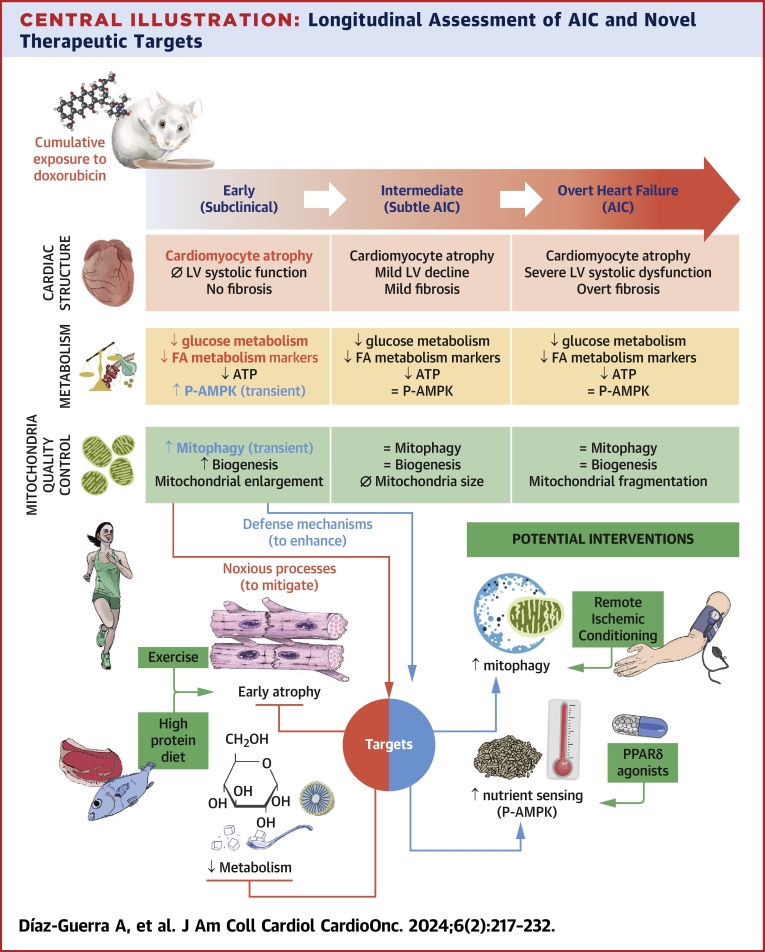
Objectives: The aim of this study was to characterize AIC progression in a mouse model from early (subclinical) to advanced heart failure stages, with an emphasis on cardiac metabolism and mitochondrial structure and function.

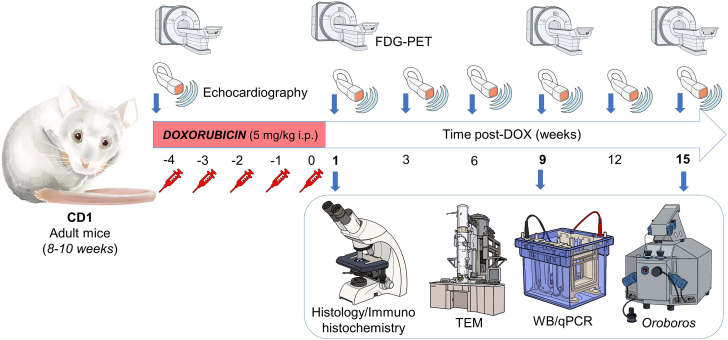
Methods: CD1 mice received 5 weekly intraperitoneal doxorubicin injections (5 mg/kg) and were followed by serial echocardiography for 15 weeks. At 1, 9, and 15 weeks after the doxorubicin injections, mice underwent fluorodeoxyglucose positron emission tomography, and hearts were extracted for microscopy and molecular analysis.

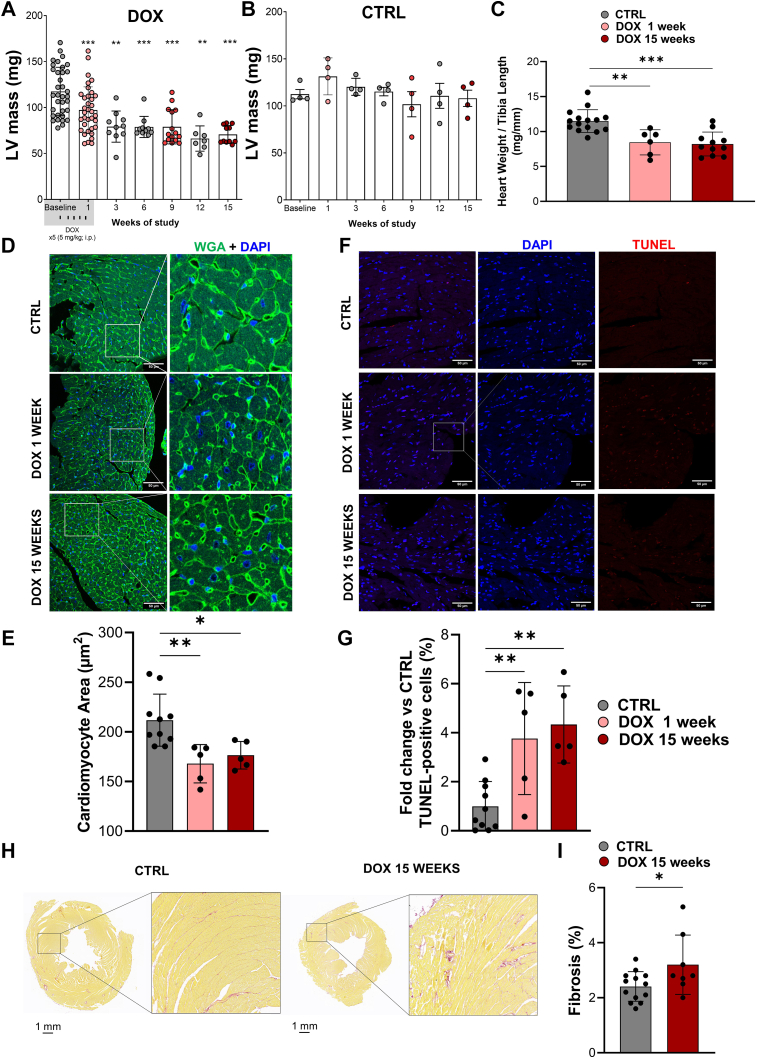
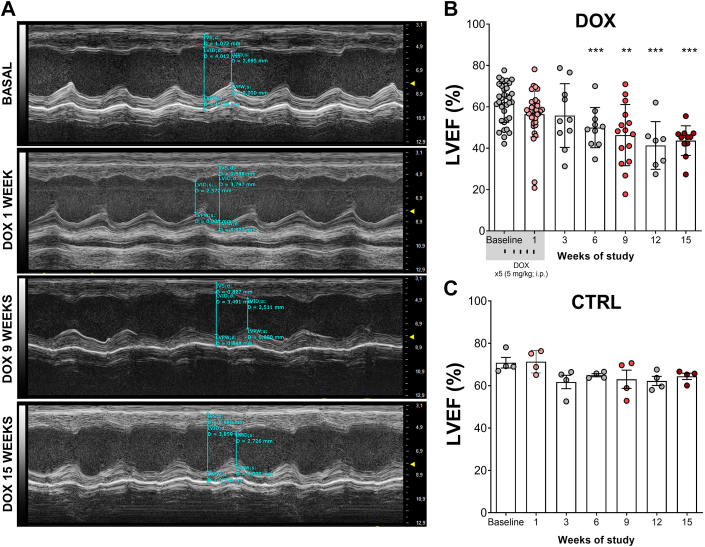
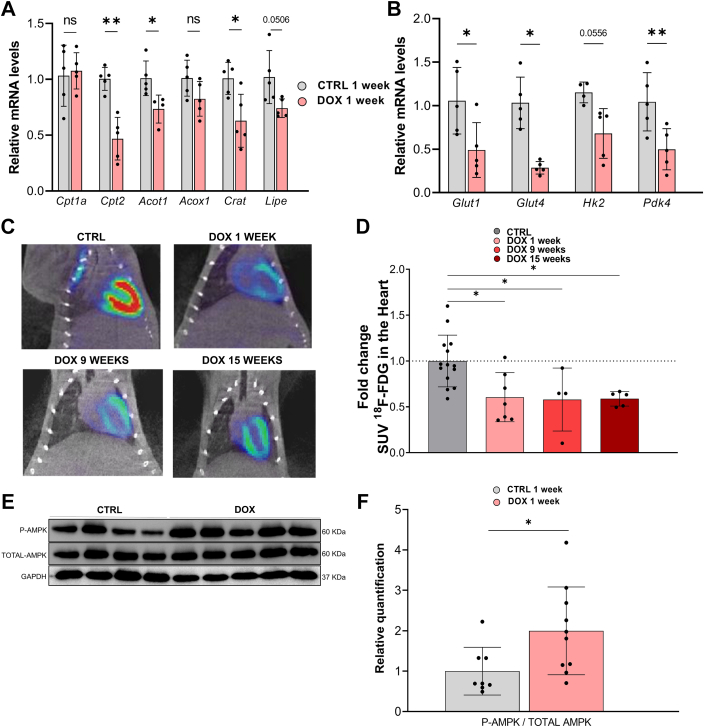
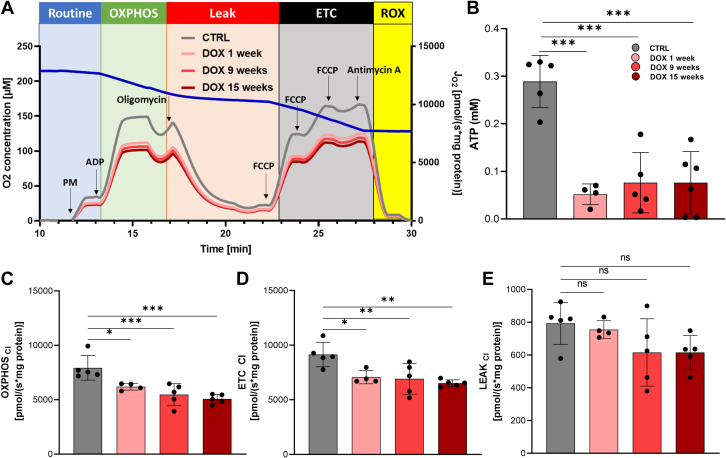
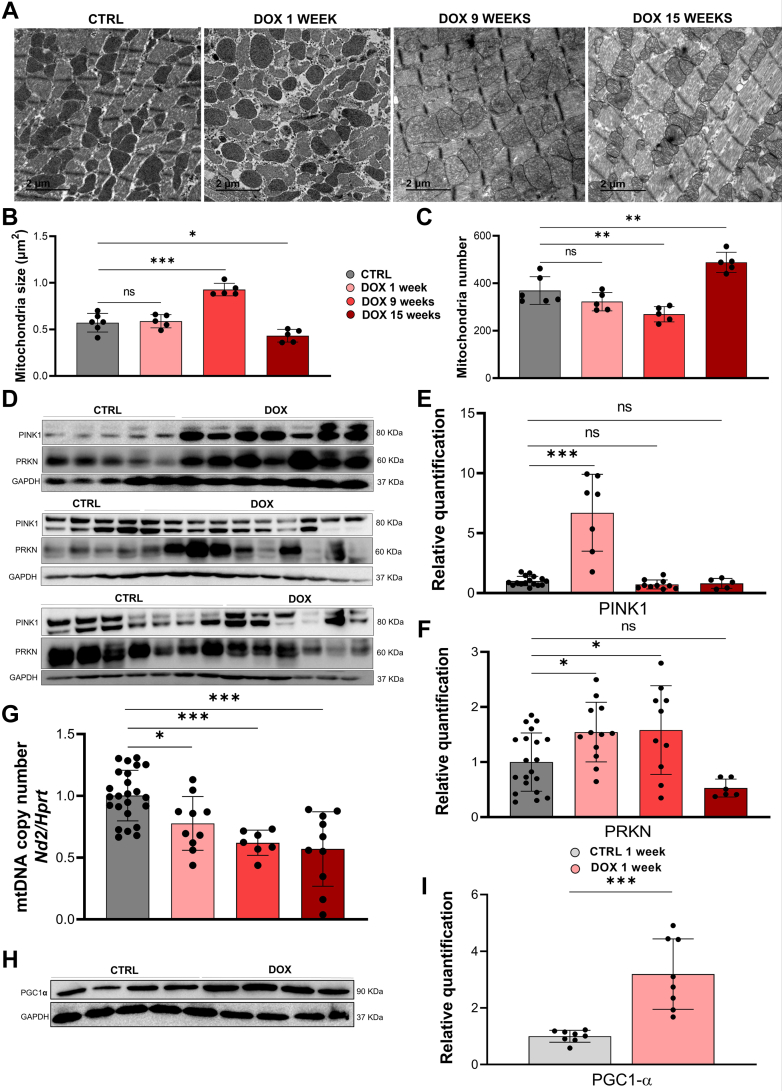
Results: Cardiac atrophy was evident at 1 week post-doxorubicin (left ventricular [LV] mass 117 ± 26 mg vs 97 ± 25 mg at baseline and 1 week, respectively; P < 0.001). Cardiac mass nadir was observed at week 3 post-doxorubicin (79 ± 16 mg; P = 0.002 vs baseline), remaining unchanged thereafter. Histology confirmed significantly reduced cardiomyocyte area (167 ± 19 μm2 in doxorubicin-treated mice vs 211 ± 26 μm2 in controls; P = 0.004). LV ejection fraction declined from week 6 post-doxorubicin (49% ± 9% vs 61% ± 9% at baseline; P < 0.001) until the end of follow-up at 15 weeks (43% ± 8%; P < 0.001 vs baseline). At 1 week post-doxorubicin, when LV ejection fraction remained normal, reduced cardiac metabolism was evident from down-regulated markers of fatty acid oxidation and glycolysis. Metabolic impairment continued to the end of follow-up in parallel with reduced mitochondrial adenosine triphosphate production. A transient early up-regulation of nutrient-sensing and mitophagy markers were observed, which was associated with mitochondrial enlargement. Later stages, when mitophagy was exhausted, were characterized by overt mitochondrial fragmentation.

Conclusions: Cardiac atrophy, global hypometabolism, early transient-enhanced mitophagy, biogenesis, and nutrient sensing constitute candidate targets for AIC prevention.

Keywords: anthracyclines; cancer; cardio-oncology; cardiotoxicity; doxorubicin; mitochondria.


Conflict of interest statement

Dr Ibáñez is supported by the European Commission (grants ERC-CoG 819775 and H2020-HEALTH 945118), the Spanish Ministry of Science, Innovation and Universities (grant PID2022-140176OB-I00), and Comunidad de Madrid through the Red Madrileña de Nanomedicina en Imagen Molecular (grant P2022/BMD-7403 RENIM-CM). Dr Díaz-Guerra’s PhD fellowship is funded by the Spanish Association Against Cancer. Dr Oliver is a Ramón y Cajal fellow (grant RYC2020-028884-I) funded by MCIN/AEI/10.13039/501100011033 and by “ESF Investing in Your Future.” Centro Nacional de Investigaciones Cardiovasculares is supported by Instituto de Salud Carlos III, Ministerio de Ciencia e Innovación, and the Pro CNIC Foundation and is a Severo Ochoa Center of Excellence (grant CEX2020-001041-S funded by MICIN/AEI/10.13039/501100011033). The authors have reported that they have no relationships relevant to the contents of this paper to disclose.

Figures

None
Graphical abstract
Figure 1
Figure 1
Study Design Male CD1 mice (8-10 weeks old) were randomly assigned to receive once weekly intraperitoneal injections of 5 mg/kg doxorubicin (DOX) for 5 weeks or no treatment (control). Echocardiographic examinations were performed at baseline (before the first injection) and 1, 3, 6, 9, 12, and 15 weeks after the end of the DOX treatment. Positron emission tomographic (PET)/computed tomographic scans were performed at baseline and 1, 9, and 15 weeks after DOX treatment. At 1, 9, and 15 weeks after DOX treatment, selected animals were sacrificed, and hearts were collected for further analysis by histology and immunohistochemistry, transmission electron microscopy (TEM), western blotting (WB), reverse transcriptase quantitative polymerase chain reaction (qPCR), and high-resolution mitochondrial respirometry (Oroboros Instruments). Syringe symbols indicate DOX injections. Arrows indicate defined time points. FDG = fluorodeoxyglucose.
Figure 2
Figure 2
Survival and Metabolic Activity (A) Life span of mice after the first doxorubicin (DOX) injection. (B) Median survival (n = 30-45). The study was performed from the first DOX injection to 140 days (15 weeks post-DOX). (C) Body weight in mice (n = 9-50). (D) Food intake in mice 1, 9, and 15 weeks after DOX treatment and in time-paired controls (CTRL) (n = 3-8), presented as grams per day per body weight (g). (E) Physical activity analyzed in the same mouse groups as in (D) (n = 3-8). (F) Energy expenditure (EE) during light hours, analyzed in the same mouse groups as in (D), presented as kilocalories expended per day per body weight (g) (n = 3-8). (G) EE during dark hours, analyzed in the same mouse groups as in (D), presented as kilocalories expended per day per body weight (g) (n = 3-7). Data are presented as mean ± SD. Data were compared using unpaired Student’s t-test, Mann-Whitney U test, 2-way repeated-measures analysis of variance with Šídák’s post hoc test multiple comparison, or log-rank test. ∗P < 0.05, ∗∗P < 0.01, and ∗∗∗P < 0.001.
Figure 3
Figure 3
Cardiac Atrophy, DNA Damage, and Fibrosis (A,B) Evolution of left ventricular (LV) mass (mg) (n = 4-35) determined from M-mode echocardiographic images. (C) Ratio of heart weight to tibia length 1 and 15 weeks after injections (n = 6-15). (D) Representative photomicrographs of LV myocardial cross sections stained with wheat germ agglutinin (WGA) and 4′,6-diamidino-2-phenylindole (DAPI). Scale bar, 50 μm. (E) Cardiomyocyte cross-sectional area (μm2) (n = 5-9). (F) Representative photomicrographs of LV myocardial cross sections stained with terminal deoxynucleotidyl transferase dUTP nick-end labeling (TUNEL) assay to assess DNA damage. Scale bar, 50 μm. (G) TUNEL-positive cells (%) (n = 5-10). (H) Representative histologic images illustrating myocardial interstitial fibrosis (Sirius red). Scale bar, 1 mm. (I) Fibrosis (%) (n = 8-13). Data are presented as mean ± SD. Data were compared using 1-way repeated-measures analysis of variance (ANOVA) with Holm-Šídák’s post hoc test, ordinary 1-way ANOVA with Dunnett’s post hoc test, or unpaired Student’s t-test. ∗P < 0.05, ∗∗P < 0.01, and ∗∗∗P < 0.001. Abbreviations as in Figures 1 and 2.
Figure 4
Figure 4
LVEF Measurement by Echocardiography (A) Representative M-mode echocardiographic images. (B,C) LV ejection fraction (LVEF) (%) (n = 4-35). Data are presented as mean ± SD. Data were compared using 1-way repeated-measures ANOVA with Holm-Šídák post hoc test. ∗P < 0.05 and ∗∗∗P < 0.001. Abbreviations as in Figure 1, Figure 2, Figure 3.
Figure 5
Figure 5
Glycolysis and Fatty Acid Metabolism (A,B) Reverse transcriptase quantitative polymerase chain reaction quantification of genes linked to fatty acid metabolism (Cpt1a, Cpt2, Acot1, Acox1, Crat, and Lipe) and glucose metabolism (Glut1, Glut4, Hk2, and Pdk4) in cardiac tissue. Gene expression was normalized to Hprt messenger RNA (mRNA) (n = 4 or 5). (C) Representative micro-PET/computed tomographic scans. (D) Fold change in the standardized uptake value (SUV) for [18F]-FDG after DOX treatment (n = 4-14). (E,F) Representative western blot and densitometry quantification of phosphorylated adenosine monophosphate–activated protein kinase (P-AMPK) and total AMPK in cardiac tissue 1 week after the final DOX injection (n = 8-10). Glyceraldehyde 3-phosphate dehydrogenase (GAPDH) was used as the loading control. Data are presented as mean ± SD. Data were compared using unpaired Student’s t-test, Mann-Whitney U test, or ordinary 1-way ANOVA with Dunnett’s post hoc test. ∗P < 0.05 and ∗∗P < 0.01. Abbreviations as in Figure 1, Figure 2, Figure 3.
Figure 6
Figure 6
Mitochondrial Function and ATP Production (A) Respirometry traces in mitochondria isolated from hearts. The blue line indicates [O2]; the gray and red lines indicate O2 flux per mitochondrial protein (JO2) in the various conditions. Arrows indicate additions. (B) Mitochondrial adenosine triphosphate (ATP) production at the indicated time points (mM). (C) OXPHOSCI. (D) ETCCI. (E) LeakCI. Data are presented as mean ± SD. Data were compared using ordinary 1-way ANOVA with Dunnett’s post hoc test. ∗P < 0.05, ∗∗P < 0.01, and ∗∗∗P < 0.001. CI = complex I; ETC = electron transfer capacity; FCCP = carbonyl cyanide-p-trifluoromethoxyphenylhydrazone; OXPHOS = oxidative phosphorylation; PM = pyruvate-malate; ROX = residual oxygen consumption; other abbreviations as in Figure 1, Figure 2, Figure 3.
Figure 7
Figure 7
Mitochondrial Dynamics (A) Representative transmission electron microscopic images of cardiac tissue. Scale bar, 2 μm. (B) Mitochondrial size (μm2) (n = 5). (C) Mitochondrial number (n = 5). (D,E) Representative western blot and (E,F) densitometric quantification of the expression of PTEN-induced kinase 1 (PINK1) (n = 5-16) and E3 ubiquitin-protein ligase parkin (PRKN) (n = 6-20). (G) Mitochondrial DNA (mtDNA) copy number measured as the ratio between Nd2 (mitochondrial gene) and Hprt (nuclear gene) in cardiac tissue (n = 7-24). (H,I) Western blot and densitometry quantification of proliferator-activated receptor gamma coactivator 1–alpha (PGC-1α) at 1 week after DOX treatment (n = 8). GAPDH was used as a loading control. Data are presented as mean ± SD. Data were compared using unpaired Student’s t-test or ordinary 1-way ANOVA with Dunnett’s post hoc test. ∗P < 0.05, ∗∗P < 0.01, and ∗∗∗P < 0.001. Abbreviations as in Figure 1, Figure 2, Figure 3and 5.
Central Illustration
Longitudinal Assessment of AIC and Novel Therapeutic Targets Principal effects of cumulative exposure to doxorubicin in mice on cardiac structure, metabolism, and mitochondria quality control. Timeline extends from subclinical to intermediate to overt heart failure stages: 1 to 15 weeks after doxorubicin treatment. Potential interventions against cardiotoxicity include enhancing defense mechanisms and mitigating the noxious processes activated during time of study. The early atrophy and decrease in FA metabolism may be alleviated by exercise and high-protein diets, the transient increase in mitophagy by remote ischemic conditioning, and increase in nutrient sensing by peroxisome-proliferator–associated receptor δ (PPARδ) agonists. AIC = anthracycline-induced cardiotoxicity; ATP = adenosine triphosphate; FA = fatty acids; LV = left ventricular; mtDNA = mitochondrial DNA; P-AMPK = phosphorylated adenosine monophosphate–activated protein kinase.

Similar articles

Cited by

References

    1. Omland T., Heck S.L., Gulati G. The role of cardioprotection in cancer therapy cardiotoxicity: JACC: CardioOncology state-of-the-art review. J Am Coll Cardiol CardioOnc. 2022;4:19–37. - PMC - PubMed
    1. Lyon A.R., Lopez-Fernandez T., Couch L.S., et al. 2022 ESC guidelines on cardio-oncology developed in collaboration with the European Hematology Association (EHA), the European Society for Therapeutic Radiology and Oncology (ESTRO) and the International Cardio-Oncology Society (IC-OS) Eur Heart J. 2022;43:4229–4361. - PubMed
    1. Lopez-Sendon J., Alvarez-Ortega C., Zamora Aunon P., et al. Classification, prevalence, and outcomes of anticancer therapy-induced cardiotoxicity: the CARDIOTOX registry. Eur Heart J. 2020;41:1720–1729. - PubMed
    1. Demissei B.G., Vedage N.A., Hubbard R.A., et al. Longitudinal right ventricular systolic function changes in breast cancer patients treated with cardiotoxic cancer therapy. J Am Coll Cardiol CardioOnc. 2022;4:552–554. - PMC - PubMed
    1. Ibanez B., Moreno-Arciniegas A. The quest for an early marker of anthracycline-induced cardiotoxicity. J Am Coll Cardiol Basic Trans Science. 2022;7:11–13. - PMC - PubMed

LinkOut - more resources