. 2024 May 7:15:1384731.
doi: 10.3389/fphar.2024.1384731. eCollection 2024.

Combination of plasma MMPs and PD-1-binding soluble PD-L1 predicts recurrence in gastric cancer and the efficacy of immune checkpoint inhibitors in non-small cell lung cancer

Affiliations

Combination of plasma MMPs and PD-1-binding soluble PD-L1 predicts recurrence in gastric cancer and the efficacy of immune checkpoint inhibitors in non-small cell lung cancer

Fumihiko Ando et al. Front Pharmacol. .

Abstract

Background: The tumor microenvironment (TME) impacts the therapeutic efficacy of immune checkpoint inhibitors (ICIs). No liquid biomarkers are available to evaluate TME heterogeneity. Here, we investigated the clinical significance of PD-1-binding soluble PD-L1 (bsPD-L1) in gastric cancer (GC) patients and non-small cell lung cancer (NSCLC) patients treated with PD-1/PD-L1 blockade.

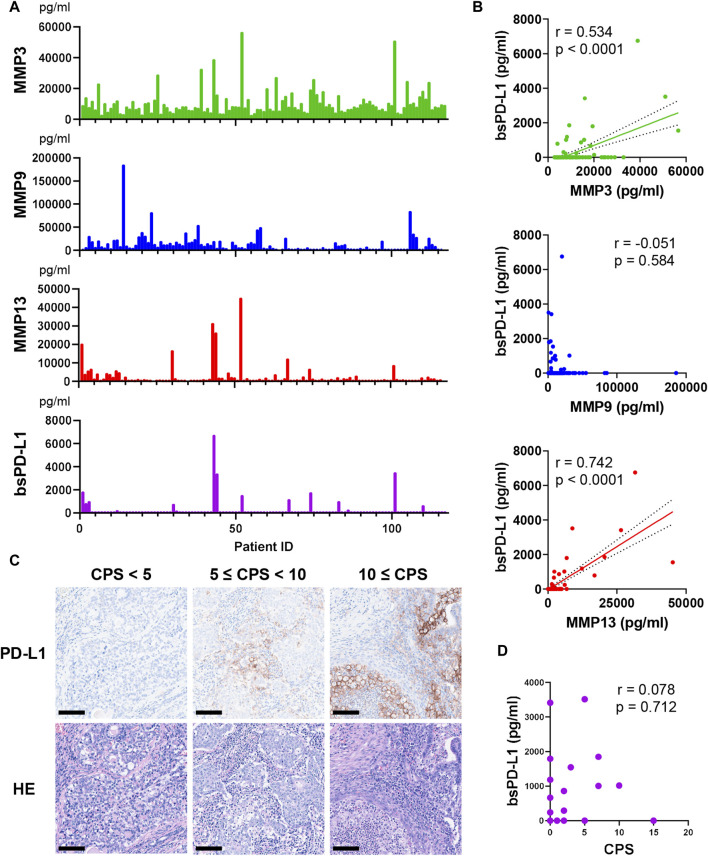
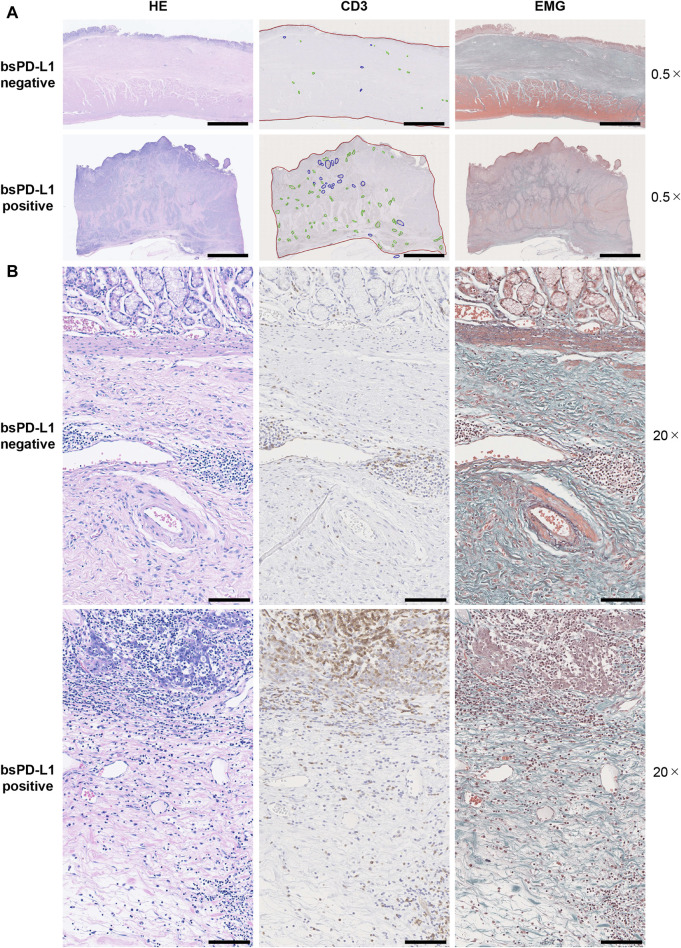
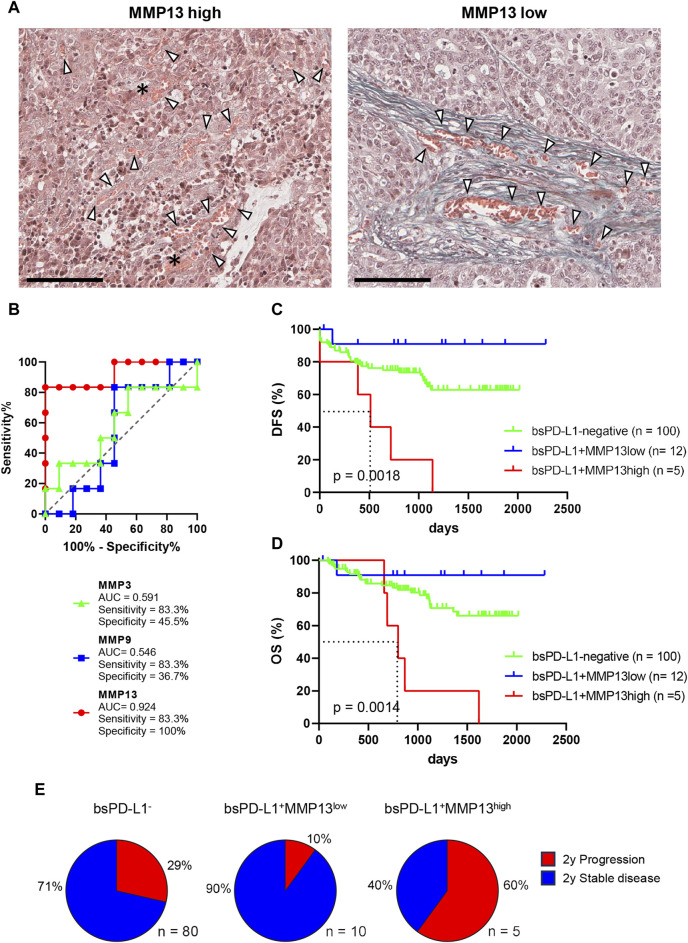
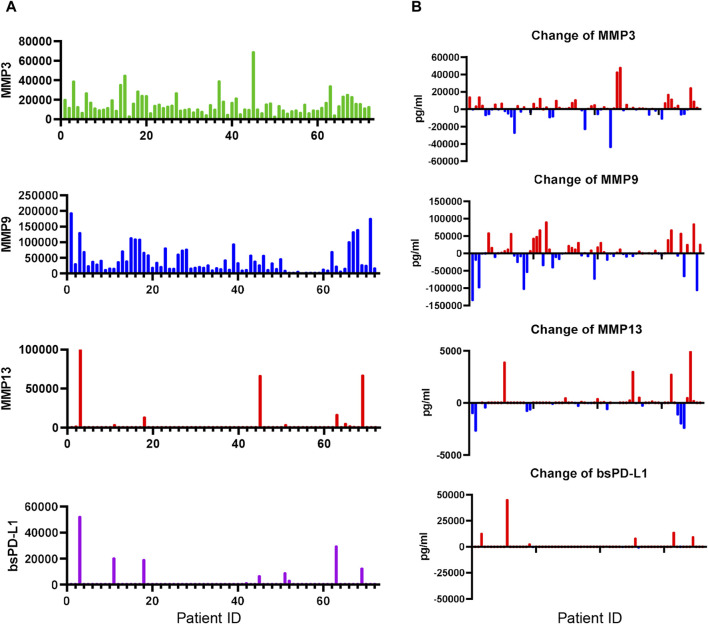
Methods: We examined bsPD-L1, matrix metalloproteinases (MMPs), and IFN-γ levels in plasma samples from GC patients (n = 117) prior to surgery and NSCLC patients (n = 72) prior to and 2 months after ICI treatment. We also examined extracellular matrix (ECM) integrity, PD-L1 expression, and T cell infiltration in tumor tissues from 25 GC patients by Elastica Masson-Goldner staining and immunohistochemical staining for PD-L1 and CD3, respectively.

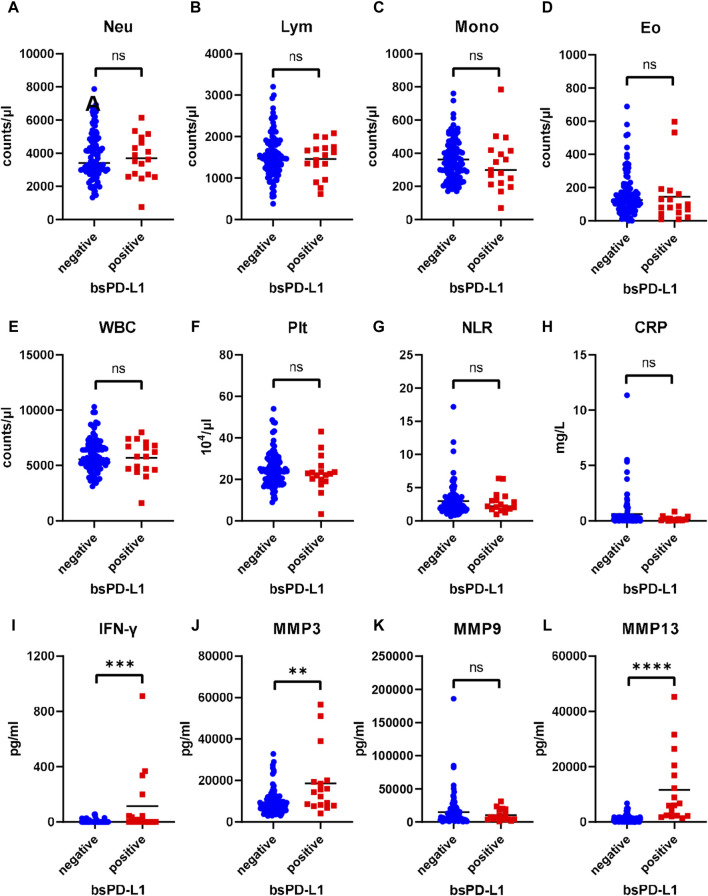
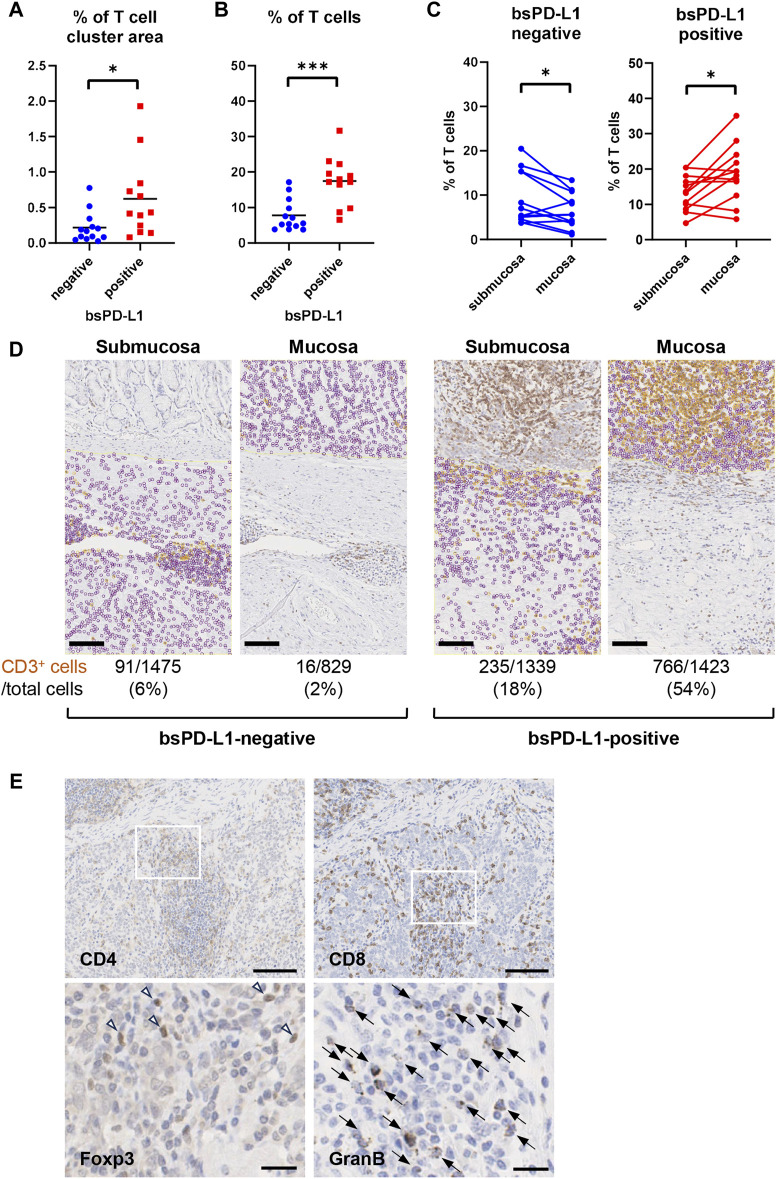
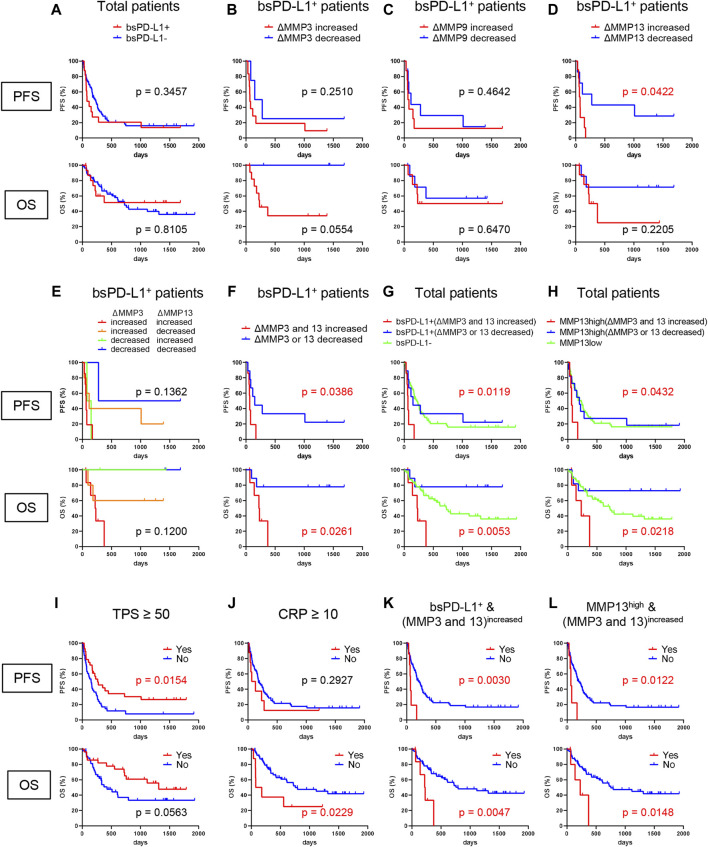
Results: bsPD-L1 was detected in 17/117 GC patients and 16/72 NSCLC patients. bsPD-L1 showed strong or moderate correlations with plasma MMP13 or MMP3 levels, respectively, in both GC and NSCLC patients. bsPD-L1 expression in GC was associated with IFN-γ levels and intra-tumoral T cell infiltration, whereas MMP13 levels were associated with loss of ECM integrity, allowing tumor cells to access blood vessels. Plasma MMP3 and MMP13 levels were altered during ICI treatment. Combined bsPD-L1 and MMP status had higher predictive accuracy to identify two patient groups with favorable and poor prognosis than tumor PD-L1 expression: bsPD-L1+MMP13high in GC and bsPD-L1+(MMP3 and MMP13)increased in NSCLC were associated with poor prognosis, whereas bsPD-L1+MMP13low in GC and bsPD-L1+(MMP3 or MMP13)decreased in NSCLC were associated with favorable prognosis.

Conclusion: Plasma bsPD-L1 and MMP13 levels indicate T cell response and loss of ECM integrity, respectively, in the TME. The combination of bsPD-L1 and MMPs may represent a non-invasive tool to predict recurrence in GC and the efficacy of ICIs in NSCLC.

Keywords: MMP13; T cell response; extracellular matrix integrity; soluble PD-L1; tumor microenvironment.


Conflict of interest statement

YI has patent applications for immunopotentiating compositions (WO/2009/0297518, 2011/0081341, 2014/0314714, 2015/0093380, 2015/0197572, 2016/0158356, 2016/0158355, 2017/0051060, and 2020/0062846) and an immune function evaluation method (WO/2019/049974). YI reports research grants from the Japan Society for the Promotion of Science (JP19K07783 and JP22K07262 to YI) and Sysmex Corporation. AG reports consulting fees from MSD, Nippon Kayaku, and Daiichi-Sankyo Company outside the submitted work. MS reports receiving research grants from Taiho Pharmaceutical, Chugai Pharmaceutical, Eli Lilly, Nippon Kayaku, and Kyowa Hakko Kirin and honoraria from AstraZeneca, MSD, Chugai Pharmaceutical, Taiho Pharmaceutical, Eli Lilly, Ono Pharmaceutical, Bristol-Myers Squibb, Nippon Boehringer Ingelheim, Pfizer, Novartis, Takeda Pharmaceutical, Kyowa Hakko Kirin, Nippon Kayaku, Daiichi-Sankyo Company, Merck Biopharma, and Amgen outside the submitted work. The remaining authors declare that the research was conducted in the absence of any commercial or financial relationships that could be construed as a potential conflict of interest. The author(s) declared that they were an editorial board member of Frontiers, at the time of submission. This had no impact on the peer review process and the final decision.

Figures

FIGURE 1
FIGURE 1
Detection of MMPs and bsPD-L1 in the plasma of GC patients. (A) Plasma MMP and bsPD-L1 levels in 117 GC patients. (B) Correlation between bsPD-L1 and MMP levels in GC patients (n = 117). r indicates the correlation coefficient. (C) Representative images of H&E and anti-PD-L1 immunohistochemical staining in tumor tissues from GC patients with low (CPS <5), moderate (5 ≤ CPS <10), and high (CPS ≥10) PD-L1 expression. Original magnification, ×20. Scale bars indicate 100 µm. Nuclei were counterstained with hematoxylin (blue). (D) Correlation between bsPD-L1 level and CPS in GC patients (n = 25). r indicates the correlation coefficient.
FIGURE 2
FIGURE 2
Comparison of inflammatory markers between bsPD-L1+ and bsPD-L1 GC patients. Counts of (A) Neutrophil, (B) lymphocyte, (C) monocyte, (D)eosinophil, (E) white blood cell, and (F) platelet, (G) neutrophil-to-lymphocyte ratio, and levels of (H) C-reactive protein, (I) IFN-γ, and (J–L) MMPs in bsPD-L1+ (n = 17) and bsPD-L1 (n = 100) GC patients. The horizontal lines indicate the mean. Statistical significance was calculated using the Student’s t-test (A,B,E) or the Mann–Whitney U test (C,D,F,G,H,I,J,K,L). ∗∗p < 0.01; ∗∗∗p < 0.001; ∗∗∗∗p < 0.0001; ns, not significant.
FIGURE 3
FIGURE 3
Histological analysis of T cell infiltration and extracellular matrix integrity in tumor tissues. Serial tumor tissue sections from bsPD-L1+ (n = 12) or bsPD-L1 (n = 13) GC patients were analyzed using H&E, EMG, or anti-CD3 immunohistochemical staining. Representative images at low magnification (×0.5; (A) and high magnification (×20; (B); scale bars indicate 5 mm (A) and 100 µm (B), respectively. In the immunohistochemical staining images, tumor regions, T cell cluster areas, and B cell follicles are indicated as red, green, and blue lines, respectively. In the EMG staining images, collagen fibers, elastic fibers, red blood cells, and muscle are shown in green, dark purple, orange, and red, respectively.
FIGURE 4
FIGURE 4
bsPD-L1+ GC patients had high numbers of tumor-infiltrating T lymphocytes. (A) The percentages of T cell cluster area within the tumor area and (B) the percentages of CD3+ T cells within the total viable cell population in bsPD-L1+ (n = 12) and bsPD-L1 (n = 13) GC patients. (C) The percentage of CD3+ T cells within the total viable cell population between mucosal and submucosal layers. (D) Representative images of tumor tissues from bsPD-L1+ and bsPD-L1 GC patients. Original magnification, ×20. Scale bars indicate 100 µm. Yellow and purple circles indicate CD3+ and CD3 nuclei, respectively. (E) Serial tumor tissue sections from bsPD-L1+ GC patients were analyzed by immunohistochemistry. Representative images at low magnification (×10; CD4 and CD8) and high magnification (×40; Foxp3 and Granzyme (B); scale bars indicate 100 µm and 20 μm, respectively. Nuclei were counterstained with hematoxylin (blue). The arrow heads and arrows represent Foxp3+ cells and Granzyme B+ cells, respectively. Statistical significance was calculated using the unpaired (A,B) or paired (C) Student’s t-test. ∗p < 0.05; ∗∗∗∗p < 0.0001.
FIGURE 5
FIGURE 5
Identification of GC patients with a high risk of relapse. (A) Representative images of EMG staining in tumor tissues from bsPD-L1+ GC patients with high or low MMP13 levels, respectively. Original magnification, ×20. Scale bars indicate 100 µm. Collagen fibers and red blood cells are shown in green and orange, respectively. The asterisk and arrow heads represent hemorrhage and blood vessels, respectively. (B) ROC curve analyses of MMP levels to predict DFS in bsPD-L1+ GC patients. (C) DFS and (D) OS in bsPD-L1 (n = 100), bsPD-L1+MMP13low (n = 12), and bsPD-L1+MMP13high (n = 5) GC patients. (E) Pie charts showing the percentages of GC patients with the indicated bsPD-L1 and MMP13 signatures who had progressed at 2 years post-surgery.
FIGURE 6
FIGURE 6
Detection of MMPs and bsPD-L1 in the plasma of NSCLC patients. (A) MMP and bsPD-L1 levels in plasma samples from 72 NSCLC patients. (B) Change of MMP and bsPD-L1 levels in 72 NSCLC patients at 2 months of ICI treatment.
FIGURE 7
FIGURE 7
Identification of NSCLC patients without benefit from ICI treatment. (A) PFS and OS of bsPD-L1+ (n = 16) and bsPD-L1 (n = 56) NSCLC patients. (B) PFS and OS of MMP3increased (n = 4) and MMP3decreased (n = 12) bsPD-L1+ patients. (C) PFS and OS of MMP9increased (n = 8) and MMP9decreased (n = 8) bsPD-L1+ patients. (D) PFS and OS of MMP13increased (n = 7) and MMP13decreased (n = 9) bsPD-L1+ patients. (E) PFS and OS of MMP3increasedMMP13increased (n = 7), MMP3increasedMMP13decreased (n = 5), MMP3decreasedMMP13increased (n = 2), and MMP3decreasedMMP13decreased (n = 2) bsPD-L1+ patients. (F) PFS and OS of (MMP3 and MMP13)increased (n = 7) and (MMP3 or MMP13)decreased (n = 9) bsPD-L1+ patients. (G) PFS and OS of bsPD-L1 (n = 56), bsPD-L1+(MMP3 and MMP13)increased (n = 7), and bsPD-L1+(MMP3 or MMP13)decreased (n = 9) NSCLC patients. (H) PFS and OS of MMP13low (n = 55), MMP13high (MMP3 and MMP13)increased (n = 6), and MMP13high (MMP3 or MMP13)decreased (n = 11) NSCLC patients. (I) PFS and OS of NSCLC patients stratified by TPS (≥50, n = 28 vs. < 50, n = 44). (J) PFS and OS of NSCLC patients stratified by CRP level (≥10 mg/L, n = 8 vs. < 10 mg/L, n = 64). (K) PFS and OS of NSCLC patients stratified by bsPD-L1+(MMP3 and MMP13)increased status (yes, n = 7 vs. no, n = 65). (L) PFS and OS of NSCLC patients stratified by MMP13high (MMP3 and MMP13)increased status (yes, n = 6 vs. no, n = 66).

References

    1. Alsina M., Arrazubi V., Diez M., Tabernero J. (2022). Current developments in gastric cancer: from molecular profiling to treatment strategy. Nat. Rev. Gastroenterol. Hepatol. 20, 155–170. 10.1038/s41575-022-00703-w - DOI - PubMed
    1. Borghaei H., Paz-Ares L., Horn L., Spigel D. R., Steins M., Ready N. E., et al. (2015). Nivolumab versus docetaxel in advanced nonsquamous non-small-cell lung cancer. N. Engl. J. Med. 373 (17), 1627–1639. 10.1056/NEJMoa1507643 - DOI - PMC - PubMed
    1. Brahmer J., Reckamp K. L., Baas P., Crino L., Eberhardt W. E., Poddubskaya E., et al. (2015). Nivolumab versus docetaxel in advanced squamous-cell non-small-cell lung cancer. N. Engl. J. Med. 373 (2), 123–135. 10.1056/NEJMoa1504627 - DOI - PMC - PubMed
    1. Brummel K., Eerkens A. L., de Bruyn M., Nijman H. W. (2023). Tumour-infiltrating lymphocytes: from prognosis to treatment selection. Br. J. Cancer 128 (3), 451–458. 10.1038/s41416-022-02119-4 - DOI - PMC - PubMed
    1. Chen G., Huang A. C., Zhang W., Zhang G., Wu M., Xu W., et al. (2018). Exosomal PD-L1 contributes to immunosuppression and is associated with anti-PD-1 response. Nature 560 (7718), 382–386. 10.1038/s41586-018-0392-8 - DOI - PMC - PubMed