Identification of Lipotoxicity-Related Biomarkers in Diabetic Nephropathy Based on Bioinformatic Analysis
- PMID: 38774257
- PMCID: PMC11108700
- DOI: 10.1155/2024/5550812
Identification of Lipotoxicity-Related Biomarkers in Diabetic Nephropathy Based on Bioinformatic Analysis
Abstract
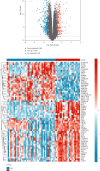
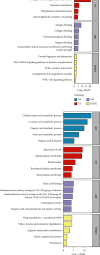
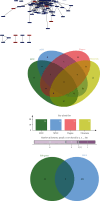
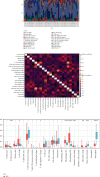
Objective: This study is aimed at investigating diagnostic biomarkers associated with lipotoxicity and the molecular mechanisms underlying diabetic nephropathy (DN). Methods: The GSE96804 dataset from the Gene Expression Omnibus (GEO) database was utilized to identify differentially expressed genes (DEGs) in DN patients. Gene Ontology (GO) and Kyoto Encyclopedia of Genes and Genomes (KEGG) enrichment analyses were conducted using the DEGs. A protein-protein interaction (PPI) network was established to identify key genes linked to lipotoxicity in DN. Immune infiltration analysis was employed to identify immune cells with differential expression in DN and to assess the correlation between these immune cells and lipotoxicity-related hub genes. The findings were validated using the external dataset GSE104954. ROC analysis was performed to assess the diagnostic performance of the hub genes. The Gene set enrichment analysis (GSEA) enrichment method was utilized to analyze the key genes associated with lipotoxicity as mentioned above. Result: In this study, a total of 544 DEGs were identified. Among them, extracellular matrix (ECM), fatty acid metabolism, AGE-RAGE, and PI3K-Akt signaling pathways were significantly enriched. Combining the PPI network and lipotoxicity-related genes (LRGS), LUM and ALB were identified as lipotoxicity-related diagnostic biomarkers for DN. ROC analysis showed that the AUC values for LUM and ALB were 0.882 and 0.885, respectively. The AUC values for LUM and ALB validated in external datasets were 0.98 and 0.82, respectively. Immune infiltration analysis revealed significant changes in various immune cells during disease progression. Macrophages M2, mast cells activated, and neutrophils were significantly associated with all lipotoxicity-related hub genes. These key genes were enriched in fatty acid metabolism and extracellular matrix-related pathways. Conclusion: The identified lipotoxicity-related hub genes provide a deeper understanding of the development mechanisms of DN, potentially offering new theoretical foundations for the development of diagnostic biomarkers and therapeutic targets related to lipotoxicity in DN.
Keywords: bioinformatic analysis; biomarker; diabetic nephropathy; immune cell infiltration; lipotoxicity-related genes.
Copyright © 2024 Han Nie et al.
Conflict of interest statement
The authors declare no conflicts of interest.
Figures



Similar articles
-
Lumican as a potential biomarker for diabetic nephropathy.Ren Fail. 2025 Dec;47(1):2480245. doi: 10.1080/0886022X.2025.2480245. Epub 2025 Apr 7. Ren Fail. 2025. PMID: 40195568 Free PMC article.
-
Integrating bioinformatics and machine learning to identify glomerular injury genes and predict drug targets in diabetic nephropathy.Sci Rep. 2025 May 15;15(1):16868. doi: 10.1038/s41598-025-01628-5. Sci Rep. 2025. PMID: 40374840 Free PMC article.
-
Machine learning based identification of anoikis related gene classification patterns and immunoinfiltration characteristics in diabetic nephropathy.Sci Rep. 2025 May 1;15(1):15271. doi: 10.1038/s41598-025-99395-w. Sci Rep. 2025. PMID: 40312440 Free PMC article.
-
Common gene signatures and key pathways in hypopharyngeal and esophageal squamous cell carcinoma: Evidence from bioinformatic analysis.Medicine (Baltimore). 2020 Oct 16;99(42):e22434. doi: 10.1097/MD.0000000000022434. Medicine (Baltimore). 2020. PMID: 33080677 Free PMC article.
-
Utilizing machine learning algorithms to identify biomarkers associated with diabetic nephropathy: A review.Medicine (Baltimore). 2024 Feb 23;103(8):e37235. doi: 10.1097/MD.0000000000037235. Medicine (Baltimore). 2024. PMID: 38394492 Free PMC article. Review.
Cited by
-
Meal-Induced NF-kB Activation in Mononuclear Cells Triggers Lumican Secretion and Promotes Chronic Kidney Disease in Metabolic Dysfunction-Associated Steatotic Liver Disease.MedComm (2020). 2025 Aug 7;6(8):e70122. doi: 10.1002/mco2.70122. eCollection 2025 Aug. MedComm (2020). 2025. PMID: 40787070 Free PMC article. No abstract available.
-
Novel Insights into Diabetic Kidney Disease.Int J Mol Sci. 2024 Sep 23;25(18):10222. doi: 10.3390/ijms251810222. Int J Mol Sci. 2024. PMID: 39337706 Free PMC article. Review.
References
MeSH terms
Substances
LinkOut - more resources
Full Text Sources
Medical
Miscellaneous

