

Alzheimer's disease manifests abnormal sphingolipid metabolism
- PMID: 38774265
- PMCID: PMC11106446
- DOI: 10.3389/fnagi.2024.1368839
Alzheimer's disease manifests abnormal sphingolipid metabolism
Abstract
Introduction: Alzheimer's disease (AD) is associated with disturbed metabolism, prompting investigations into specific metabolic pathways that may contribute to its pathogenesis and pathology. Sphingolipids have garnered attention due to their known physiological impact on various diseases.
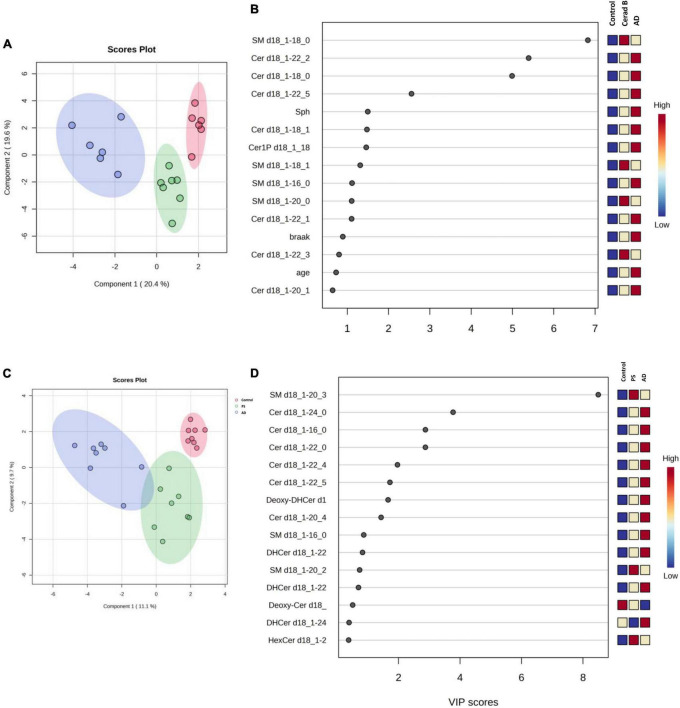
Methods: We conducted comprehensive profiling of sphingolipids to understand their possible role in AD. Sphingolipid levels were measured in AD brains, Cerad score B brains, and controls, as well as in induced pluripotent stem (iPS) cells (AD, PS, and control), using liquid chromatography mass spectrometry.
Results: AD brains exhibited higher levels of sphingosine (Sph), total ceramide 1-phosphate (Cer1P), and total ceramide (Cer) compared to control and Cerad-B brains. Deoxy-ceramide (Deoxy-Cer) was elevated in Cerad-B and AD brains compared to controls, with increased sphingomyelin (SM) levels exclusively in Cerad-B brains. Analysis of cell lysates revealed elevated dihydroceramide (dhSph), total Cer1P, and total SM in AD and PS cells versus controls. Multivariate analysis highlighted the relevance of Sph, Cer, Cer1P, and SM in AD pathology. Machine learning identified Sph, Cer, and Cer1P as key contributors to AD.
Discussion: Our findings suggest the potential importance of Sph, Cer1P, Cer, and SM in the context of AD pathology. This underscores the significance of sphingolipid metabolism in understanding and potentially targeting mechanisms underlying AD.
Keywords: Alzheimer’s disease (AD); ceramide (Cer); ceramide 1-phosphate (Cer1P); sphingomyelin (SM); sphingosine (Sph).
Copyright © 2024 Uranbileg, Isago, Sakai, Kubota, Saito and Kurano.
Conflict of interest statement
The present study was a collaborative research project undertaken by The University of Tokyo and Nihon Waters Masayuki Kubota. ES is now an employee of Japan Waters Corporation. ES and MKb were employed by Nihon Waters K.K. The remaining authors declare that the research was conducted in the absence of any commercial or financial relationships that could be construed as a potential conflict of interest.
Figures


Similar articles
-
Development of an advanced liquid chromatography-tandem mass spectrometry measurement system for simultaneous sphingolipid analysis.Sci Rep. 2024 Mar 8;14(1):5699. doi: 10.1038/s41598-024-56321-w. Sci Rep. 2024. PMID: 38459112 Free PMC article.
-
Blood sphingolipidomics in healthy humans: impact of sample collection methodology.J Lipid Res. 2010 Oct;51(10):3074-87. doi: 10.1194/jlr.D008532. Epub 2010 Jul 21. J Lipid Res. 2010. PMID: 20660127 Free PMC article.
-
Intestinal absorption of sphingosine: new insights on generated ceramide species using stable isotope tracing in vitro.J Lipid Res. 2024 Jun;65(6):100557. doi: 10.1016/j.jlr.2024.100557. Epub 2024 May 7. J Lipid Res. 2024. PMID: 38719152 Free PMC article.
-
Metabolism and biological functions of two phosphorylated sphingolipids, sphingosine 1-phosphate and ceramide 1-phosphate.Prog Lipid Res. 2007 Mar;46(2):126-44. doi: 10.1016/j.plipres.2007.03.001. Epub 2007 Mar 14. Prog Lipid Res. 2007. PMID: 17449104 Review.
-
Ceramide and Its Related Neurochemical Networks as Targets for Some Brain Disorder Therapies.Neurotox Res. 2018 Feb;33(2):474-484. doi: 10.1007/s12640-017-9798-6. Epub 2017 Aug 25. Neurotox Res. 2018. PMID: 28842833 Free PMC article. Review.
Cited by
-
Ceramide as a Promising Tool for Diagnosis and Treatment of Clinical Diseases: A Review of Recent Advances.Metabolites. 2025 Mar 11;15(3):195. doi: 10.3390/metabo15030195. Metabolites. 2025. PMID: 40137159 Free PMC article. Review.
-
Lipidome disruption in Alzheimer's disease brain: detection, pathological mechanisms, and therapeutic implications.Mol Neurodegener. 2025 Jan 27;20(1):11. doi: 10.1186/s13024-025-00803-6. Mol Neurodegener. 2025. PMID: 39871348 Free PMC article. Review.
-
Broken Balance: Emerging Cross-Talk Between Proteostasis and Lipostasis in Neurodegenerative Diseases.Cells. 2025 Jun 4;14(11):845. doi: 10.3390/cells14110845. Cells. 2025. PMID: 40498021 Free PMC article. Review.
-
Rescue of hippocampal synaptic plasticity and memory performance by Fingolimod (FTY720) in APP/PS1 model of Alzheimer's disease is accompanied by correction in metabolism of sphingolipids, polyamines, and phospholipid saturation composition.bioRxiv [Preprint]. 2025 Jan 18:2025.01.17.633452. doi: 10.1101/2025.01.17.633452. bioRxiv. 2025. PMID: 39868189 Free PMC article. Preprint.
References
LinkOut - more resources
Full Text Sources