. 2024 May 7:15:1358574.
doi: 10.3389/fmicb.2024.1358574. eCollection 2024.

Genomic characterisation and ecological distribution of Mantoniella tinhauana: a novel Mamiellophycean green alga from the Western Pacific

Affiliations

Genomic characterisation and ecological distribution of Mantoniella tinhauana: a novel Mamiellophycean green alga from the Western Pacific

Elvira Rey Redondo et al. Front Microbiol. .

Abstract

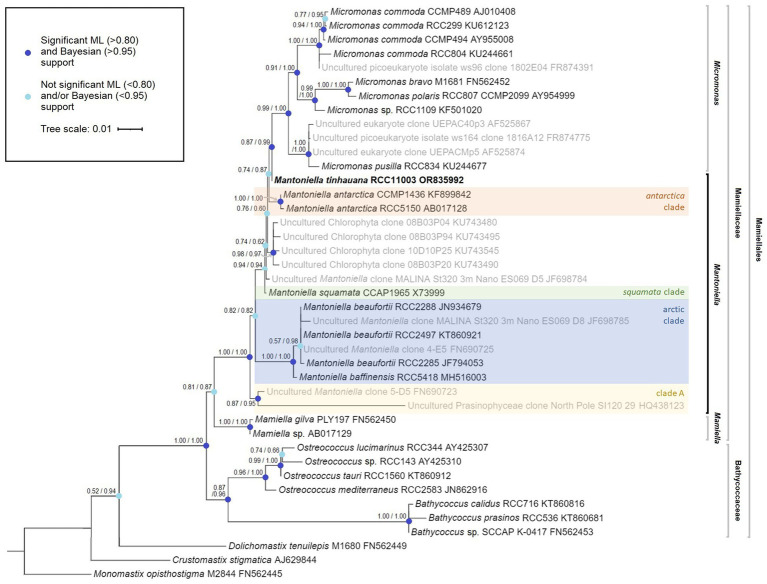
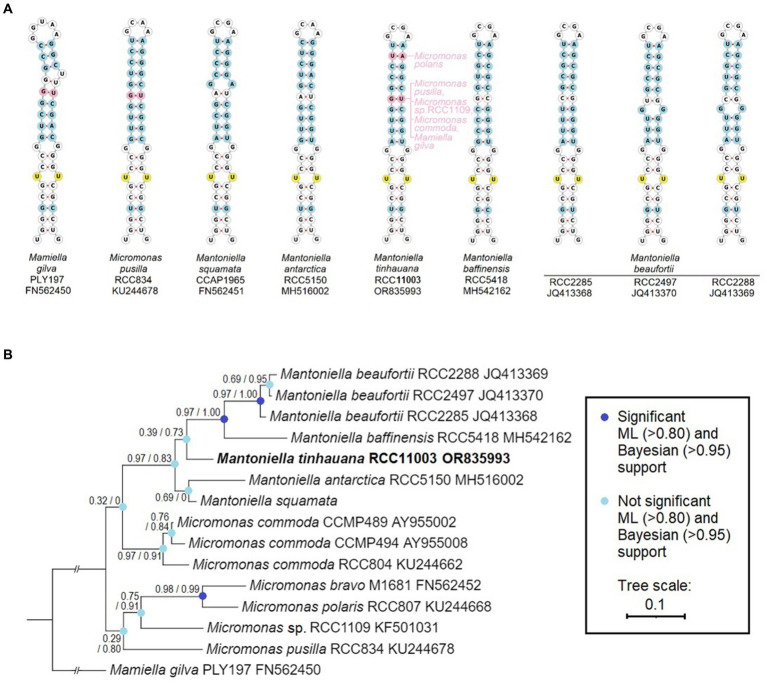
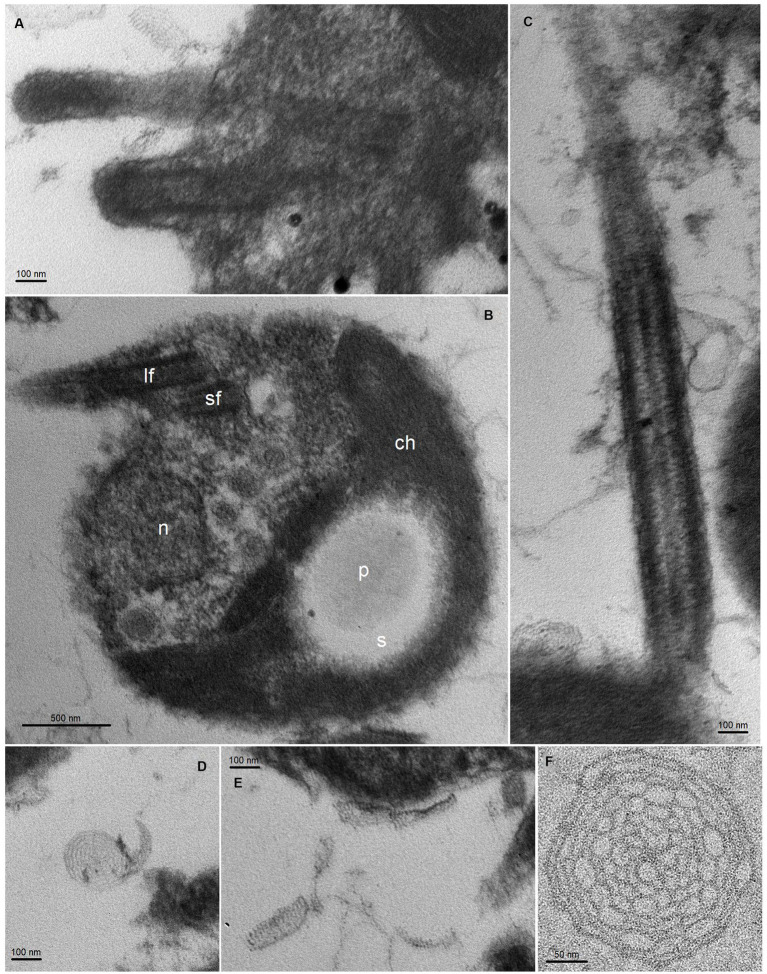
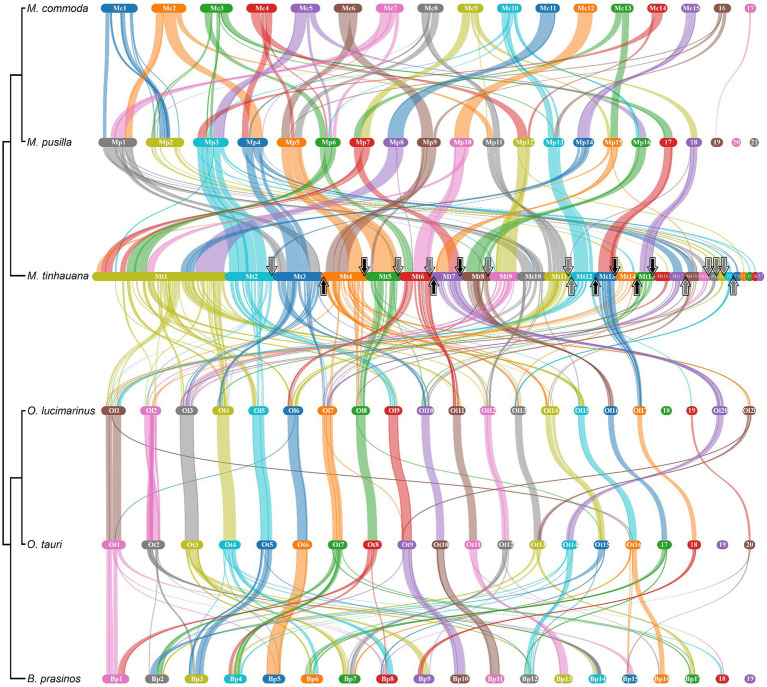
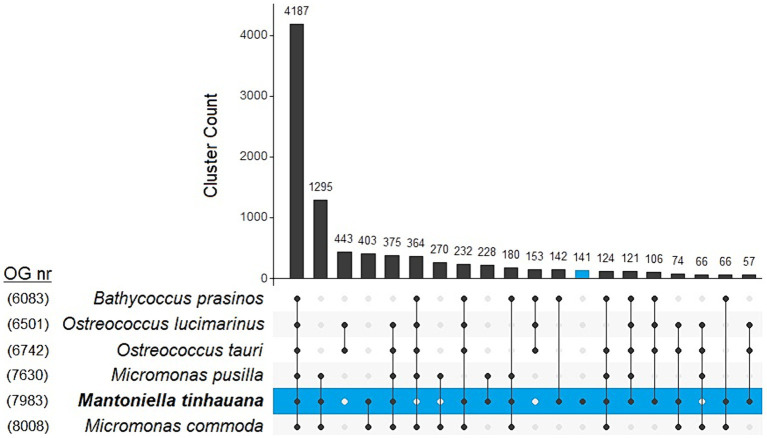
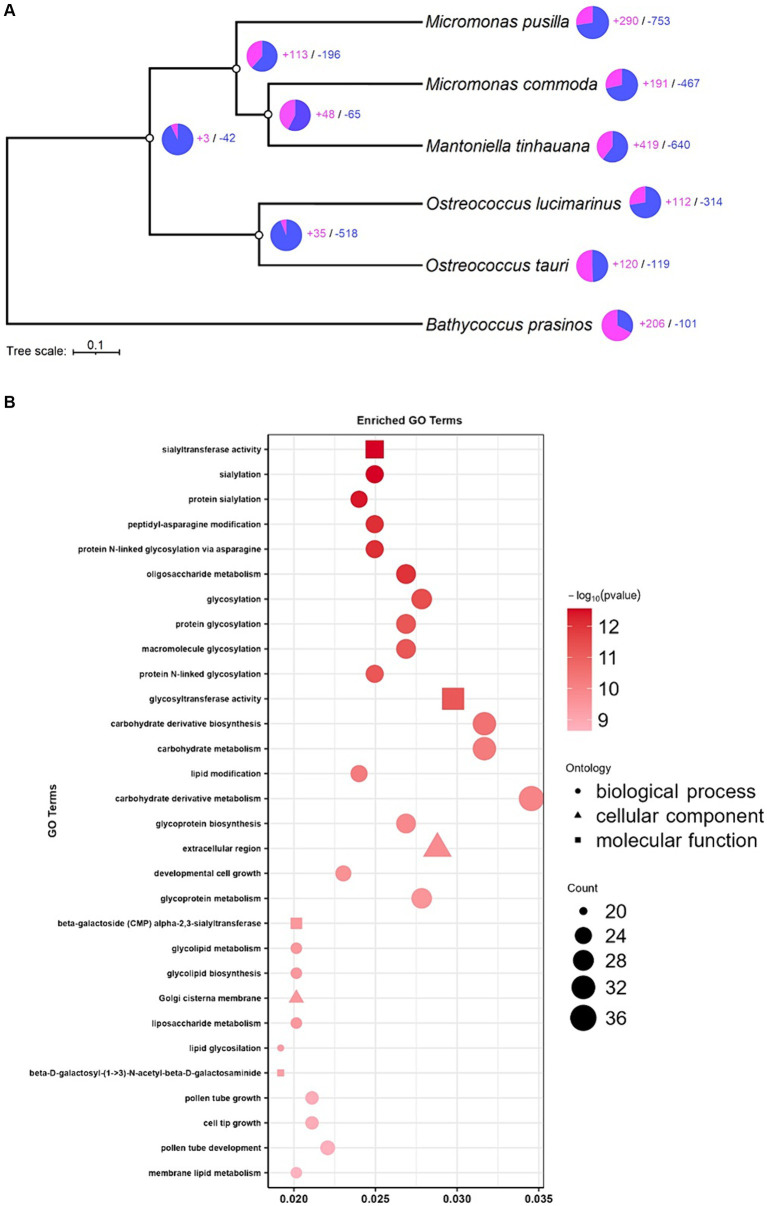
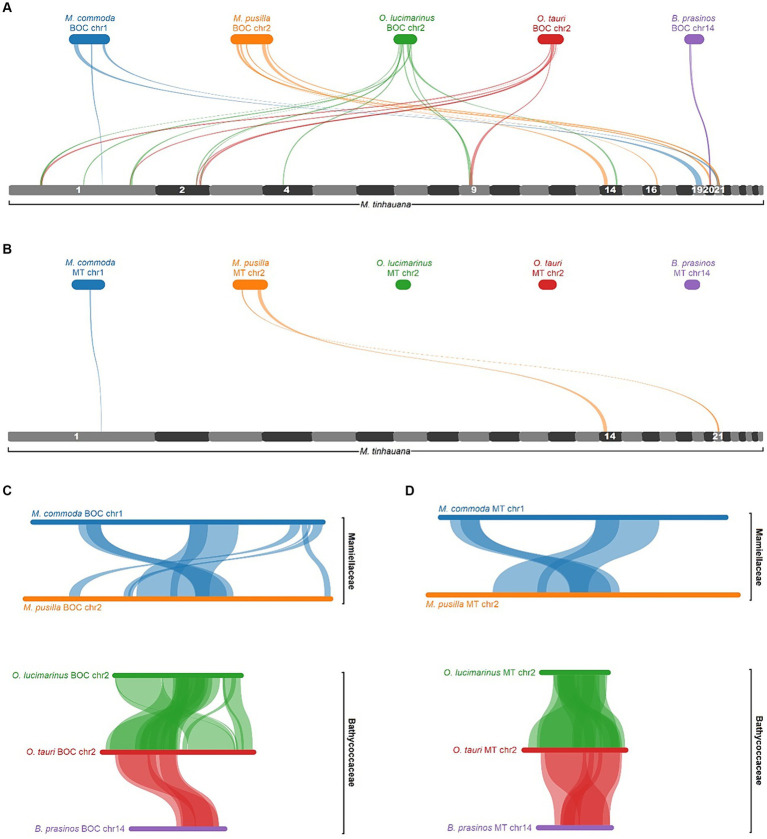
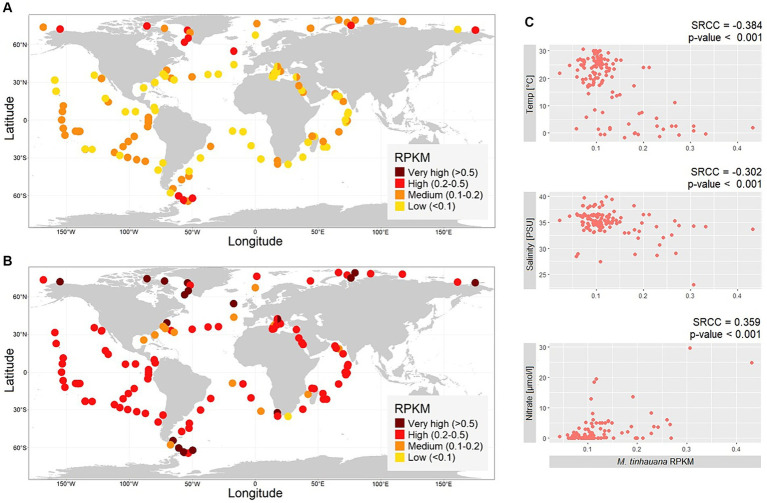
Mamiellophyceae are dominant marine algae in much of the ocean, the most prevalent genera belonging to the order Mamiellales: Micromonas, Ostreococcus and Bathycoccus, whose genetics and global distributions have been extensively studied. Conversely, the genus Mantoniella, despite its potential ecological importance, remains relatively under-characterised. In this study, we isolated and characterised a novel species of Mamiellophyceae, Mantoniella tinhauana, from subtropical coastal waters in the South China Sea. Morphologically, it resembles other Mantoniella species; however, a comparative analysis of the 18S and ITS2 marker genes revealed its genetic distinctiveness. Furthermore, we sequenced and assembled the first genome of Mantoniella tinhauana, uncovering significant differences from previously studied Mamiellophyceae species. Notably, the genome lacked any detectable outlier chromosomes and exhibited numerous unique orthogroups. We explored gene groups associated with meiosis, scale and flagella formation, shedding light on species divergence, yet further investigation is warranted. To elucidate the biogeography of Mantoniella tinhauana, we conducted a comprehensive analysis using global metagenomic read mapping to the newly sequenced genome. Our findings indicate this species exhibits a cosmopolitan distribution with a low-level prevalence worldwide. Understanding the intricate dynamics between Mamiellophyceae and the environment is crucial for comprehending their impact on the ocean ecosystem and accurately predicting their response to forthcoming environmental changes.

Keywords: Mamiellophyceae; Mantoniella tinhauana sp. nov.; biogeography; genomics; marine algae; metagenomics.


Conflict of interest statement

The authors declare that the research was conducted in the absence of any commercial or financial relationships that could be construed as a potential conflict of interest.

Figures

Figure 1
Figure 1
Mamiellophyceae 18S rRNA gene maximum likelihood tree, featuring species name, species code and 18S GenBank code (Monomastix opisthostigma as the outgroup). The numbers represent node support values, with the SH-like support values followed by the Bayesian posterior probability values. Nodes with enough support from both values (SH>0.80 and Bayes>0.95) are indicated in dark blue whereas nodes lacking sufficient support from either or both values are marked in light blue. Uncultured strains, obtained through blast search and previous studies, are depicted in grey where a complete 18S sequence was available. Mantoniella clades, if known, are labelled in different colours.
Figure 2
Figure 2
ITS2 RNA helix structural and base comparison, and phylogeny of Mamiellaceae. (A) ViennaRNA forna ITS2 folding structure of helix 2 (the other helices and complete ITS2 structure can be found in Supplementary Figures S1, S2), base-by-base comparison of novel Mantoniella tinhauana to other Mantoniella and Mamiellaceae strains, displayed in ITS2-based phylogenetic order. Only one representative Micromonas species and one Mamiella are shown. Yellow: universal eukaryote ITS2 motifs. Blue: site of nucleotide variant present in other Mantoniella species with structural effect. Pink: site of nucleotide variant absent in other Mantoniella species but present in other Mamiellophyceae species. (B) Mamiellaceae phylogenetic tree based on the structurally-informed comparison of ITS2 sequences, with branch support values as described.
Figure 3
Figure 3
TEM thin sections of Mantoniella tinhauana. Cells were measured to be approximately 3 μm in diameter (10 cells measured, standard deviation 0.7 μm, min size 1.8 μm, max size 4.5 μm, median 3.1 μm), slightly smaller than but around the range of M. squamata (3–6.5 μm) (Manton and Parke, 1960), M. antarctica (2.8–5 μm) (Marchant et al., 1989), M. beaufortii (2.9–5 μm) and M. baffinensis (3.5–5.7 μm) (Yau et al., 2020b). (A) Bases of the long and short flagella. (B) Whole cell view with detail of organellar structures: n = nucleus, ch = chloroplast, s = starch granule, p = pyrenoid, lf = long flagellum, sf = short flagellum. (C) Detail of flagellum covered in scales (body and hair scales). (D–F) Body scales with octaradial spiderweb structure.
Figure 4
Figure 4
Pairwise gene block synteny of Mamiellales proteomes computed with MCScanX and visualised using SynVisio. Species are ordered by 18S-based phylogeny, with a simplified phylogenetic tree and names labelled on the left. Scaffolds or chromosomes for each species are shown in separate sections of different colours (random repeating 10 colour series), in order (largest to smallest), labelled. Collinear gene blocks between each pair of species are connected with ribbons of varying thicknesses denoting gene block lengths, in the colour corresponding to the source scaffold. For M. tinhauana, telomeres at the beginning (upwards arrow) or end (downwards arrow) of a scaffold are marked with arrows. The four scaffolds which have telomeres at both ends have black arrows.
Figure 5
Figure 5
UpSet plot comparison of top 20 clustering unique and shared orthogroups in 6 Mamiellophyceae species. Number of orthogroups per species is labelled on the left.
Figure 6
Figure 6
Expansion and contraction analysis and enrichment analysis. (A) Tree of expanded (purple) and contracted (blue) gene families. (B) GO enrichment analysis of significantly expanded gene families in M. tinhauana.
Figure 7
Figure 7
MCScanX pairwise alignment of BOCs and MTs. (A) BOC alignments to the full Mantoniella tinhauana genome. M. tinhauana scaffolds with syntenic blocks are numbered. (B) MT alignments to the Mantoniella tinhauana genome. (C) BOC alignments to one another. (D) MT alignments to one another. Collinear gene blocks (of at least 5 genes with a max gap of 25) are connected with ribbons of different thicknesses denoting gene block lengths, in the same colour as the source species.
Figure 8
Figure 8
Biogeographic distribution of Mamiellophyceae. (A,B) Maps of global metagenomic RPKM read mapping of over 0.8 μm size fraction reads sampled at the ocean surface to (A) Mantoniella tinhauana genome, (B) Micromonas pusilla CCMP1545 genome. (C) Correlations between not highly collinear environmental variables and M. tinhauana RPKM values.

Similar articles

Cited by

References

    1. Aiyar A. (1999). “The use of CLUSTAL W and CLUSTAL X for multiple sequence alignment” in Bioinformatics methods and protocols. eds. Misener S., Krawetz S. A. (Totowa, NJ: Humana Press; ).
    1. Alonso-González A., Orive E., David H., García-Etxebarria K., Garrido J. L., Laza-Martínez A., et al. . (2014). Scaly green flagellates from Spanish Atlantic coastal waters: molecular, ultrastructural and pigment analyses. Bot. Mar. 57, 379–402. doi: 10.1515/bot-2013-0108 - DOI
    1. Baldwin B. G., Sanderson M. J., Porter J. M., Wojciechowski M. F., Campbell C. S., Donoghue M. J. (1995). The ITS region of nuclear ribosomal DNA: a valuable source of evidence on angiosperm phylogeny. Ann. Mo. Bot. Gard. 82, 247–277. doi: 10.2307/2399880 - DOI
    1. Balzano S., Gourvil P., Siano R., Chanoine M., Marie D., Lessard S., et al. . (2012). Diversity of cultured photosynthetic flagellates in the north East Pacific and Arctic oceans in summer. Biogeosci. Discuss. 9, 4553–4571. doi: 10.5194/bgd-9-6219-2012 - DOI
    1. Bandi V., Gutwin C., Siri J. N., Neufeld E., Sharpe A., Parkin I. (2022). Visualization tools for genomic conservation. New York, NY: Springer US. - PubMed

LinkOut - more resources