. 2024 May 7:15:1371247.
doi: 10.3389/fmicb.2024.1371247. eCollection 2024.

Impact of high-altitude acclimatization and de-acclimatization on the intestinal microbiota of rats in a natural high-altitude environment

Affiliations

Impact of high-altitude acclimatization and de-acclimatization on the intestinal microbiota of rats in a natural high-altitude environment

Doudou Hao et al. Front Microbiol. .

Abstract

Introduction: Intestinal microorganisms play an important role in the health of both humans and animals, with their composition being influenced by changes in the host's environment.

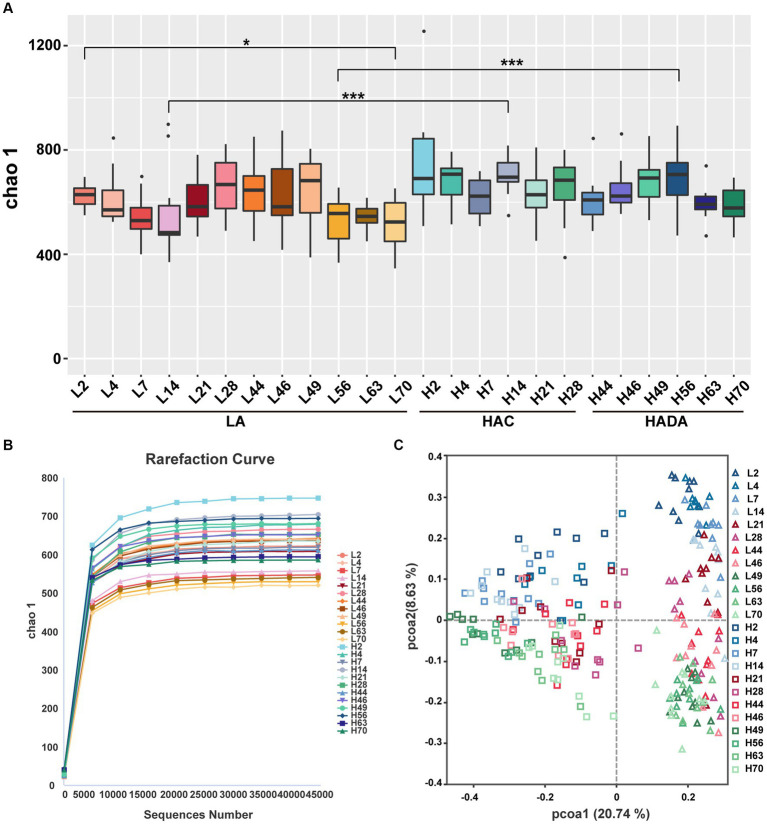
Methods: We evaluated the longitudinal changes in the fecal microbial community of rats at different altitudes across various time points. Rats were airlifted to high altitude (3,650 m) and acclimatized for 42 days (HAC), before being by airlifted back to low altitude (500 m) and de-acclimatized for 28 days (HADA); meanwhile, the control group included rats living at low altitude (500 m; LA). We investigated changes in the gut microbiota at 12 time points during high-altitude acclimatization and de-acclimatization, employing 16S rRNA gene sequencing technology alongside physiological indices, such as weight and daily autonomous activity time.

Results: A significant increase in the Chao1 index was observed on day 14 in the HAC and HADA groups compared to that in the LA group, indicating clear differences in species richness. Moreover, the principal coordinate analysis revealed that the bacterial community structures of HAC and HADA differed from those in LA. Long-term high-altitude acclimatization and de- acclimatization resulted in the reduced abundance of the probiotic Lactobacillus. Altitude and age significantly influenced intestinal microbiota composition, with changes in ambient oxygen content and atmospheric partial pressure being considered key causal factors of altitude-dependent alterations in microbiota composition. High-altitude may be linked to an increase in anaerobic bacterial abundance and a decrease in non-anaerobic bacterial abundance.

Discussion: In this study, the hypobaric hypoxic conditions at high-altitude increased the abundance of anaerobes, while reducing the abundance of probiotics; these changes in bacterial community structure may, ultimately, affect host health. Overall, gaining a comprehensive understanding of the intestinal microbiota alterations during high-altitude acclimatization and de-acclimatization is essential for the development of effective prevention and treatment strategies to better protect the health of individuals traveling between high- and low-altitude areas.

Keywords: gut microbiota; high altitude hypoxia; high-altitude acclimatization; high-altitude de-acclimatization; plateau environment.


Conflict of interest statement

The authors declare that the research was conducted in the absence of any commercial or financial relationships that could be construed as a potential conflict of interest.

Figures

Figure 1
Figure 1
Experimental design of this study. Created with BioRender.com.
Figure 2
Figure 2
(A) Changes in the body weight of rats during high-altitude acclimatization (HAC) and de-acclimation (HADA). (B) Comparison of the autonomic activity time (s) of rats during HAC and HADA with the low altitude (LA) group. *p < 0.05; **p < 0.01; ***p < 0.001; ****p < 0.0001.
Figure 3
Figure 3
Alpha and beta diversity analysis. (A) Statistical analysis of Alpha diversity index Chao1. Wilcoxon rank-sum test was used to examine the significance of differences in alpha diversity indices chao1between two groups. LA, low altitude; HAC, high-altitude acclimatization; HADA, high-altitude de-acclimatization. The X-axis denotes different time points. *p < 0.05; ***p < 0.001. (B) Dilution curves produced at different time points in the different groups. (C) Analysis of PCoA based on Bray–Curtis dissimilarity. Triangles represent the low altitude (LA) group, while squares represent the high altitude acclimatization (HAC) and high altitude de-acclimatization (HADA) groups. The 2nd-14th day, the 21st-46th day, and the 49th-70th day are marked with blue, red, and green gradient colors, respectively.
Figure 4
Figure 4
(A-C) The relative abundances among the three groups at the phylum, family, and genus levels. LA, low altitude; HAC, high-altitude acclimatization; HADA, high-altitude de-acclimatization. The X-axis denotes different time points in different groups.
Figure 5
Figure 5
(A, C) Comparative analysis of gut microbiota composition at the phylum and genus levels between low altitude (LA) and high-altitude acclimatization (HAC). (B, D) Comparative analysis of gut microbiota composition at the phylum and genus levels between low altitude (LA) and de-acclimatization (HADA). These differences were statistically evaluated using Welch’s T-test and are presented as the corrected P value.
Figure 6
Figure 6
(A,B) Species with statistically significant differences identified through LEfSe analysis. LDA threshold was set to be greater than 4, p < 0.05 was considered statistically significant. LA, low altitude; HAC, high-altitude acclimatization; HADA, high-altitude de-acclimatization. (C,D) To assess the correlation between body weight, daily autonomous activity time, and intestinal microbiota of rats in both the HAC and HADA groups, Spearman’s test was employed. Multiple hypothesis testing correction was performed on the p-values using the FDR error control method (Benjamini and Hochberg False Discovery Rate). The corrected p-value, henceforth referred to as pFDR, was used as the criterion for statistical significance, with a threshold of pFDR <0.05. ★p FDR <0.05; ★★p FDR <0.01.
Figure 7
Figure 7
(A-E) Comparative analysis of the gut microbiota phenotypes during high-altitude acclimatization utilizing the BugBase database. Wilcoxon rank sum test was used to detect significant differences. LA, low altitude; HAC, high altitude acclimatization. *p < 0.05; ***p < 0.001.
Figure 8
Figure 8
(A-E) Comparative analysis of the gut microbiota phenotypes during high-altitude de-acclimatization utilizing the BugBase database. Wilcoxon rank sum test was used to detect significant differences. LA, low altitude; HADA, high altitude de-acclimatization. *p < 0.05; **p < 0.01; ***p < 0.001.
Figure 9
Figure 9
Function of the gut microbiota based on the Kyoto Encyclopedia of Genes and Genomes (KEGG) database. (A) H2, H4, H7, H14, H21, and H28 denote the process of high-altitude acclimatization (HAC) on day 2, 4, 7, 14, 21, and 28. L2, L4, L7, L14, L21, and L28 denote the low altitude (LA) group on day 2, 4, 7, 14, 21, and 28. (B) H44, H46, H49, H56, H63, and H70 denote the process of high-altitude de-acclimatization (HADA) on day 2, 4, 7, 14, 21, and 28. L44, L46, L49, L56, L63, and L70 denote the low altitude (LA) group on day 44, 46, 49, 56, 63, and 70.
Figure 10
Figure 10
(A,B) Microbiota composition of day 2 (L2D) and day 70 (L70D) of the experiment, at the phylum and genus level. These differences were evaluated using Welch’s T test and expressed as the corrected p value. (C) To assess the correlation between body weight, daily autonomous activity time, and intestinal microbiota of rats, Spearman’s test was employed. Multiple hypothesis testing correction was performed on the p values using the FDR error control method (Benjamini and Hochberg False Discovery Rate). The corrected p-value, henceforth referred to as pFDR, was used as the criterion for statistical significance, with a threshold of pFDR <0.05. ★pFDR <0.05; ★★p FDR <0.01.
Figure 11
Figure 11
(A-E) Comparative analysis of intestinal microbiota function using the BugBase database. Samples were taken on day 2 (L2D) and day 70 (L70D) of the experiment, corresponding to 9–10 and 19–20 weeks old, respectively. Wilcoxon rank sum test was used to detect significant differences. *p < 0.05; **p < 0.01; ***p < 0.001.

Similar articles

Cited by

References

    1. Adak A., Maity C., Ghosh K., Mondal K. C. (2014). Alteration of predominant gastrointestinal flora and oxidative damage of large intestine under simulated hypobaric hypoxia. Z. Gastroenterol. 52, 180–186. doi: 10.1055/s-0033-1336007, PMID: - DOI - PubMed
    1. Adak A., Maity C., Ghosh K., Pati B. R., Mondal K. C. (2013). Dynamics of predominant microbiota in the human gastrointestinal tract and change in luminal enzymes and immunoglobulin profile during high-altitude adaptation. Folia Microbiol. (Praha) 58, 523–528. doi: 10.1007/s12223-013-0241-y, PMID: - DOI - PubMed
    1. Anand A. C., Sashindran V. K., Mohan L. (2006). Gastrointestinal problems at high altitude. Trop. Gastroenterol. 27, 147–153, PMID: - PubMed
    1. Bai X., Liu G., Yang J., Zhu J., Li X. (2022). Gut microbiota as the potential mechanism to mediate drug metabolism under high-altitude hypoxia. Curr. Drug Metab. 23, 8–20. doi: 10.2174/1389200223666220128141038, PMID: - DOI - PubMed
    1. Bailey D. P., Smith L. R., Chrismas B. C., Taylor L., Stensel D. J., Deighton K., et al. . (2015). Appetite and gut hormone responses to moderate-intensity continuous exercise versus high-intensity interval exercise, in normoxic and hypoxic conditions. Appetite 89, 237–245. doi: 10.1016/j.appet.2015.02.019, PMID: - DOI - PubMed

LinkOut - more resources