

Novel kinase 1 regulates CD8+T cells as a potential therapeutic mechanism for idiopathic pulmonary fibrosis
- PMID: 38774751
- PMCID: PMC11103402
- DOI: 10.7150/ijms.93510
Novel kinase 1 regulates CD8+T cells as a potential therapeutic mechanism for idiopathic pulmonary fibrosis
Abstract
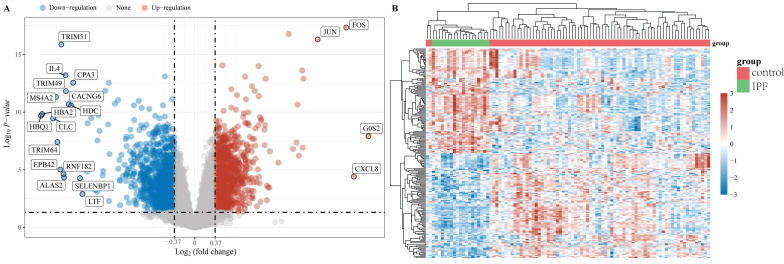
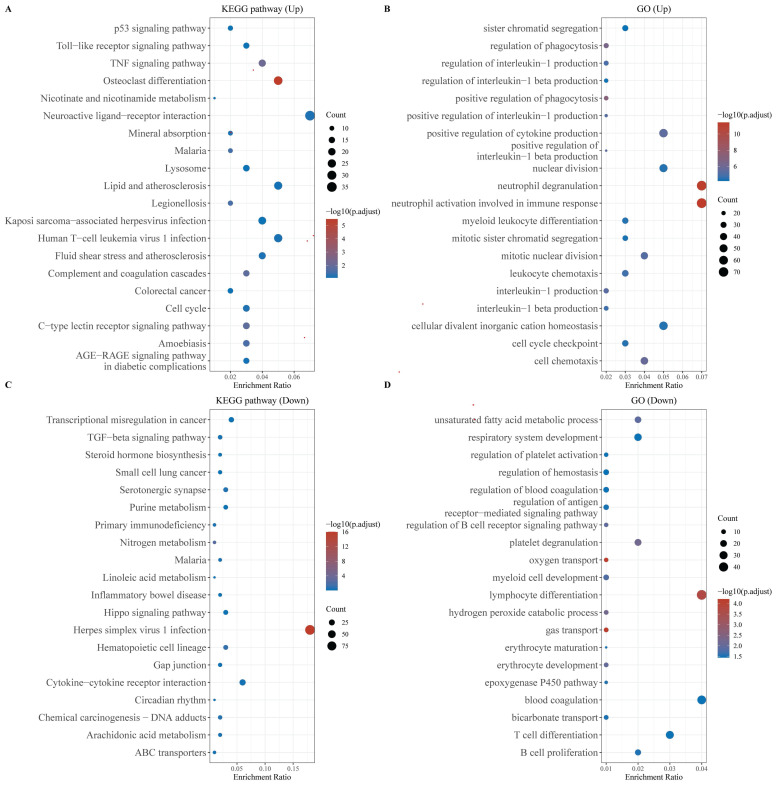
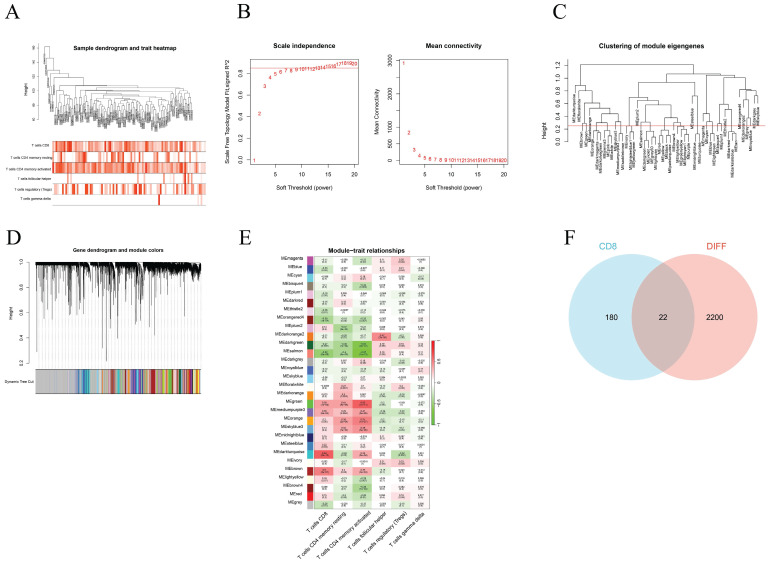
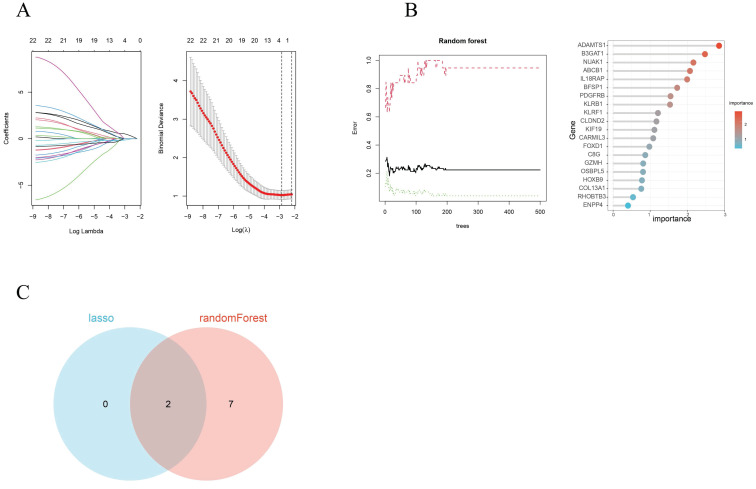
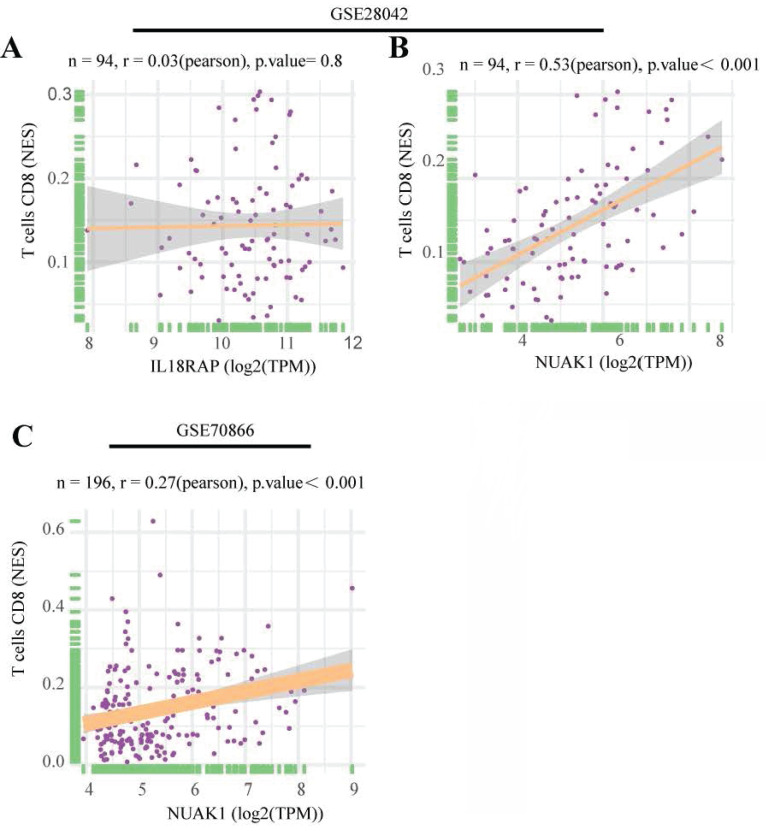
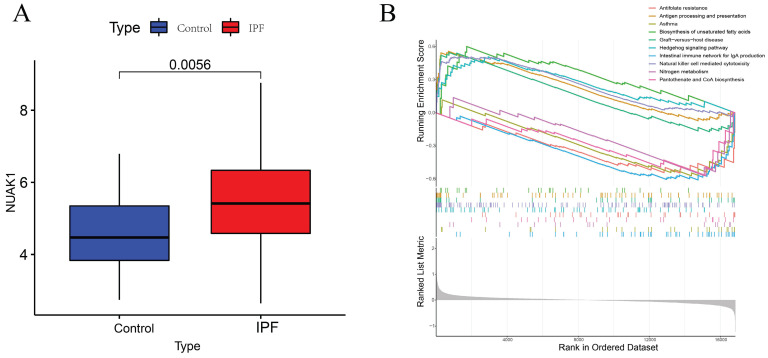
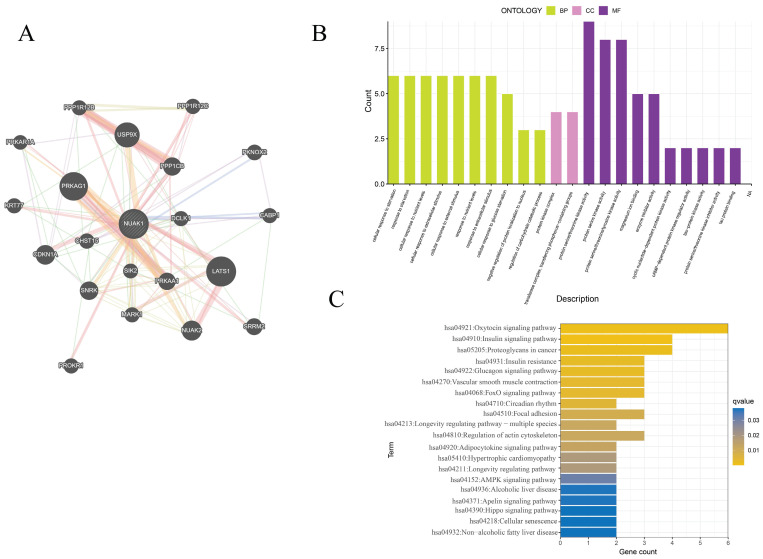
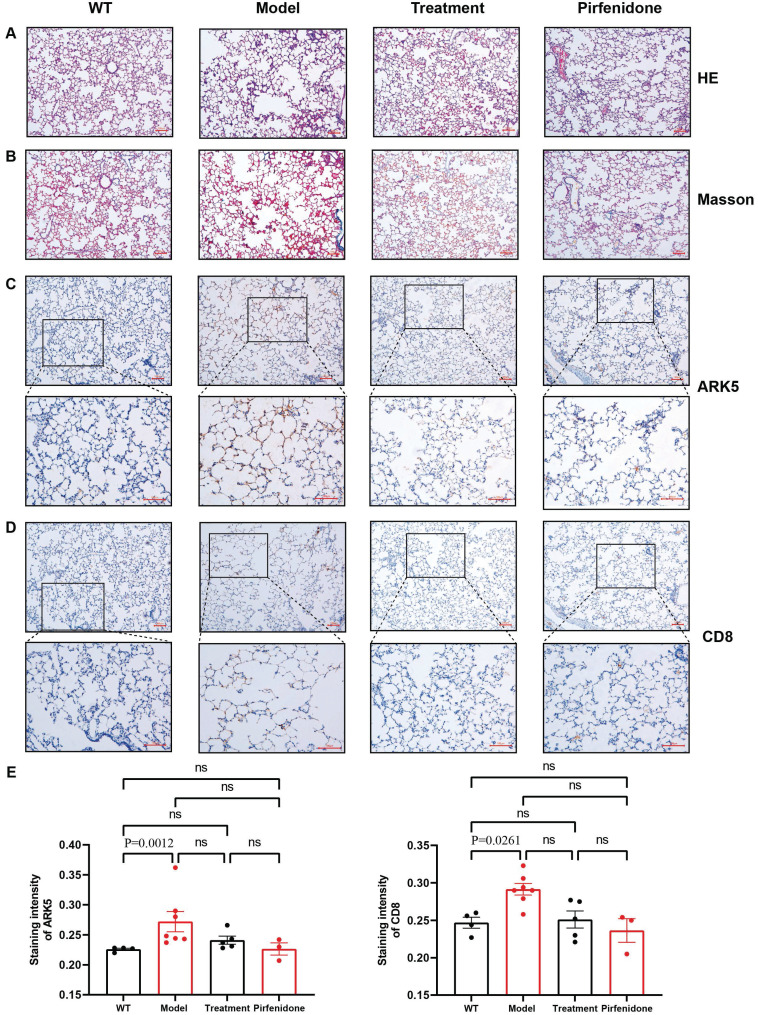
Idiopathic pulmonary fibrosis (IPF) is a rare, chronic and progressively worsening lung disease that poses a significant threat to patient prognosis, with a mortality rate exceeding that of some common malignancies. Effective methods for early diagnosis and treatment remain for this condition are elusive. In our study, we used the GEO database to access second-generation sequencing data and associated clinical information from IPF patients. By utilizing bioinformatics techniques, we identified crucial disease-related genes and their biological functions, and characterized their expression patterns. Furthermore, we mapped out the immune landscape of IPF, which revealed potential roles for novel kinase 1 and CD8+T cells in disease progression and outcome. These findings can aid the development of new strategies for the clinical diagnosis and treatment of IPF.
Keywords: CD8+T; Idiopathic pulmonary fibrosis; NUAK1; bioinformatics; immune landscape.
© The author(s).
Conflict of interest statement
Competing Interests: The authors have declared that no competing interest exists.
Figures
Similar articles
-
Single-cell transcriptomics reveals CD8+ T cell structure and developmental trajectories in idiopathic pulmonary fibrosis.Mol Immunol. 2024 Aug;172:85-95. doi: 10.1016/j.molimm.2024.06.008. Epub 2024 Jun 26. Mol Immunol. 2024. PMID: 38936318
-
Unveiling the role of copper metabolism and STEAP2 in idiopathic pulmonary fibrosis molecular landscape.J Cell Mol Med. 2024 Jun;28(11):e18414. doi: 10.1111/jcmm.18414. J Cell Mol Med. 2024. PMID: 38872435 Free PMC article.
-
The Potential Effects of Curcumin on Pulmonary Fibroblasts of Idiopathic Pulmonary Fibrosis (IPF)-Approaching with Next-Generation Sequencing and Bioinformatics.Molecules. 2020 Nov 21;25(22):5458. doi: 10.3390/molecules25225458. Molecules. 2020. PMID: 33233354 Free PMC article.
-
Immune Stroma in Lung Cancer and Idiopathic Pulmonary Fibrosis: A Common Biologic Landscape?Int J Mol Sci. 2021 Mar 12;22(6):2882. doi: 10.3390/ijms22062882. Int J Mol Sci. 2021. PMID: 33809111 Free PMC article. Review.
-
Idiopathic pulmonary fibrosis and a role for autoimmunity.Immunol Cell Biol. 2017 Aug;95(7):577-583. doi: 10.1038/icb.2017.22. Epub 2017 Mar 30. Immunol Cell Biol. 2017. PMID: 28356570 Review.
Cited by
-
NUAK1 acts as a novel regulator of PD-L1 via activating GSK-3β/β-catenin pathway in hepatocellular carcinoma.Mol Med. 2025 Feb 3;31(1):38. doi: 10.1186/s10020-025-01088-7. Mol Med. 2025. PMID: 39901136 Free PMC article.
-
Update of Aging Hallmarks in Idiopathic Pulmonary Fibrosis.Cells. 2025 Feb 5;14(3):222. doi: 10.3390/cells14030222. Cells. 2025. PMID: 39937013 Free PMC article. Review.
References
-
- Richeldi L, Collard HR, Jones MG. Idiopathic pulmonary fibrosis. Lancet. 2017;389:1941–1952. - PubMed
-
- Lederer DJ, Martinez FJ. Idiopathic Pulmonary Fibrosis. N Engl J Med. 2018;378:1811–1823. - PubMed
-
- Moss BJ, Ryter SW, Rosas IO. Pathogenic Mechanisms Underlying Idiopathic Pulmonary Fibrosis. Annu Rev Pathol. 2022;17:515–546. - PubMed
-
- Bjoraker JA, Ryu JH, Edwin MK, Myers JL, Tazelaar HD, Schroeder DR, Offord KP. Prognostic significance of histopathologic subsets in idiopathic pulmonary fibrosis. Am J Respir Crit Care Med. 1998;157:199–203. - PubMed
MeSH terms
LinkOut - more resources
Full Text Sources
Research Materials
