Construction and Validation of Novel Ferroptosis-related Risk Score Signature and Prognostic Prediction Nomogram for Patients with Colorectal Cancer
- PMID: 38774759
- PMCID: PMC11103399
- DOI: 10.7150/ijms.91446
Construction and Validation of Novel Ferroptosis-related Risk Score Signature and Prognostic Prediction Nomogram for Patients with Colorectal Cancer
Abstract
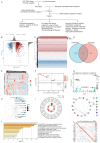
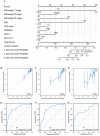
Background: Colorectal cancer (CRC) has a high morbidity and mortality. Ferroptosis is a phenomenon in which metabolism and cell death are closely related. The role of ferroptosis-related genes in the progression of CRC is still not clear. Therefore, we screened and validated the ferroptosis-related genes which could determine the prevalence, risk and prognosis of patients with CRC. Methods: We firstly screened differentially expressed ferroptosis-related genes by The Cancer Genome Atlas (TCGA) database. Then, these genes were used to construct a risk-score model using the least absolute shrinkage and selection operator (LASSO) regression algorithm. The function and prognosis of the ferroptosis-related genes were confirmed using multi-omics analysis. The gene expression results were validated using publicly available databases and qPCR. We also used publicly available data and ferroptosis-related genes to construct a prognostic prediction nomogram. Results: A total of 24 differential expressed genes associated with ferroptosis were screened in this study. A three-gene risk score model was then established based on these 24 genes and GPX3, CDKN2A and SLC7A11 were selected. The significant prognostic value of this novel three-gene signature was also assessed. Furthermore, we conducted RT-qPCR analysis on cell lines and tissues, and validated the high expression of CDKN2A, GPX3 and low expression of SLC7A11 in CRC cells. The observed mRNA expression of GPX3, CDKN2A and SLC7A11 was consistent with the predicted outcomes. Besides, eight variables including selected ferroptosis related genes were included to establish the prognostic prediction nomogram for patients with CRC. The calibration plots showed favorable consistency between the prediction of the nomogram and actual observations. Also, the time-dependent AUC (>0.7) indicated satisfactory discriminative ability of the nomogram. Conclusions: The present study constructed and validated a novel ferroptosis-related three-gene risk score signature and a prognostic prediction nomogram for patients with CRC. Also, we screened and validated the ferroptosis-related genes GPX3, CDKN2A, and SLC7A11 which could serve as novel biomarkers for patients with CRC.
Keywords: Colorectal Cancer; Ferroptosis; Nomogram; Prognosis; Risk model.
© The author(s).
Conflict of interest statement
Competing Interests: The authors have declared that no competing interest exists.
Figures


Similar articles
-
Ferroptosis-related genes are potential prognostic molecular markers for patients with colorectal cancer.Clin Exp Med. 2021 Aug;21(3):467-477. doi: 10.1007/s10238-021-00697-w. Epub 2021 Mar 6. Clin Exp Med. 2021. PMID: 33674956
-
FADS2 inhibits colorectal cancer cell proliferation by regulating ferroptosis through SLC7A11/GPX4.Mol Biol Rep. 2025 Apr 15;52(1):394. doi: 10.1007/s11033-025-10395-5. Mol Biol Rep. 2025. PMID: 40232565
-
Identifying colorectal cancer subtypes and establishing a prognostic model using metabolic plasticity and ferroptosis genes.Sci Rep. 2024 Nov 8;14(1):27277. doi: 10.1038/s41598-024-78505-0. Sci Rep. 2024. PMID: 39516556 Free PMC article.
-
Ferroptosis: the balance between death and survival in colorectal cancer.Int J Biol Sci. 2024 Jul 2;20(10):3773-3783. doi: 10.7150/ijbs.96828. eCollection 2024. Int J Biol Sci. 2024. PMID: 39113707 Free PMC article. Review.
-
Performance of prediction models on survival outcomes of colorectal cancer with surgical resection: A systematic review and meta-analysis.Surg Oncol. 2019 Jun;29:196-202. doi: 10.1016/j.suronc.2019.05.014. Epub 2019 May 20. Surg Oncol. 2019. PMID: 31196488
Cited by
-
Constructing a mitochondrial-related genes model based on machine learning for predicting the prognosis and therapeutic effect in colorectal cancer.Discov Oncol. 2025 May 3;16(1):661. doi: 10.1007/s12672-025-02462-x. Discov Oncol. 2025. PMID: 40317411 Free PMC article.
References
-
- Siegel RL, Miller KD, Jemal A. Cancer statistics, 2020. CA Cancer J Clin. 2020;70:7–30. - PubMed
-
- Siegel RL, Miller KD, Goding Sauer A, Fedewa SA, Butterly LF, Anderson JC. et al. Colorectal cancer statistics, 2020. CA Cancer J Clin. 2020;70:145–64. - PubMed
-
- Biller LH, Schrag D. Diagnosis and Treatment of Metastatic Colorectal Cancer: A Review. JAMA. 2021;325:669–85. - PubMed
Publication types
MeSH terms
Substances
LinkOut - more resources
Full Text Sources
Medical
Miscellaneous

