. 2024 May 7:15:1354348.
doi: 10.3389/fimmu.2024.1354348. eCollection 2024.

The shared circulating diagnostic biomarkers and molecular mechanisms of systemic lupus erythematosus and inflammatory bowel disease

Affiliations

The shared circulating diagnostic biomarkers and molecular mechanisms of systemic lupus erythematosus and inflammatory bowel disease

Hao-Wen Sun et al. Front Immunol. .

Abstract

Background: Systemic lupus erythematosus (SLE) is a multi-organ chronic autoimmune disease. Inflammatory bowel disease (IBD) is a common chronic inflammatory disease of the gastrointestinal tract. Previous studies have shown that SLE and IBD share common pathogenic pathways and genetic susceptibility, but the specific pathogenic mechanisms remain unclear.

Methods: The datasets of SLE and IBD were downloaded from the Gene Expression Omnibus (GEO). Differentially expressed genes (DEGs) were identified using the Limma package. Weighted gene coexpression network analysis (WGCNA) was used to determine co-expression modules related to SLE and IBD. Pathway enrichment was performed using Gene Ontology (GO) and Kyoto Encyclopedia of Genes and Genomes (KEGG) analysis for co-driver genes. Using the Least AbsoluteShrinkage and Selection Operator (Lasso) regressionand Support Vector Machine-Recursive Feature Elimination (SVM-RFE), common diagnostic markers for both diseases were further evaluated. Then, we utilizedthe CIBERSORT method to assess the abundance of immune cell infiltration. Finally,we used the single-cell analysis to obtain the location of common diagnostic markers.

Results: 71 common driver genes were identified in the SLE and IBD cohorts based on the DEGs and module genes. KEGG and GO enrichment results showed that these genes were closely associated with positive regulation of programmed cell death and inflammatory responses. By using LASSO regression and SVM, five hub genes (KLRF1, GZMK, KLRB1, CD40LG, and IL-7R) were ultimately determined as common diagnostic markers for SLE and IBD. ROC curve analysis also showed good diagnostic performance. The outcomes of immune cell infiltration demonstrated that SLE and IBD shared almost identical immune infiltration patterns. Furthermore, the majority of the hub genes were commonly expressed in NK cells by single-cell analysis.

Conclusion: This study demonstrates that SLE and IBD share common diagnostic markers and pathogenic pathways. In addition, SLE and IBD show similar immune cellinfiltration microenvironments which provides newperspectives for future treatment.

Keywords: bioinformatic analysis; hub genes; immune cells infiltration; inflammatory bowel disease; systemic lupus erythematosus.


Conflict of interest statement

The authors declare that the research was conducted in the absence of any commercial or financial relationships that could be construed as a potential conflict of interest.

Figures

Figure 1
Figure 1
Identification of differentially expressed genes (DEGs). (A) Heatmap of the top 20 genes with the most prominent differential expression in the IBD-GSE3365 cohort. (B) Volcano plot showing the distribution of DEGs in IBD. Green color represents down-regulated genes and yellow color represents up-regulated genes. (C) Heatmap of the top 20 genes with the most pronounced expression difference in the SLE-GSE72326 cohort. (D) Volcano plot showing the distribution of DEGs in SLE. Green color represents down-regulated genes and yellow color represents up-regulated genes. (E) Venn diagram of overlapping DEGs in SLE versus IBD.
Figure 2
Figure 2
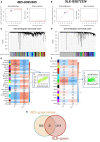
WCGNA analysis of SLE and IBD. (A, B) Mean connectivity for scale independence and soft threshold (β) in the IBD-GSE3365 cohort and the SLE-GSE72326 cohort. (C, D) Clustering dendrograms of genes in SLE and IBD. (E, F) Heatmap of the correlation analysis of module eigengenes with clinical phenotypes in SLE and IBD. Red color represents positive correlation and blue color represents negative correlation. (G) Venn diagram for intersecting genes between greenyellow module in IBD and green module in SLE.
Figure 3
Figure 3
Functional enrichment and pathway enrichment of SLE and IBD co-driver genes. (A) GO analysis and KEGG analysis of common driver genes. (B, C) Enrichment analysis of 71 candidate common driver genes using Metascape online tool. (D) PPI network analysis of common driver genes.
Figure 4
Figure 4
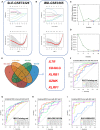
Identification of shared hub genes by SVM and LASSO. (A, B) LASSO regression analysis of the SLE-GSE72326 cohort and the IBD-GSE3365 cohort. (C, D) SVM analysis of the SLE and IBD cohorts. (E) Cross-identification of optimal shared hub genes using SVM and LASSO. (F) ROC curves for five shared diagnostic markers in the IBD-GSE3365 cohort. (G) ROC curves for five shared diagnostic markers in the SLE-GSE72326 cohort. (H) ROC curves for five shared diagnostic markers in the IBD-GSE126124 cohort. (I) ROC curves for five shared diagnostic markers in the SLE-GSE81622 cohort.
Figure 5
Figure 5
The expression of hub genes in SLE and IBD. (A, B) Expression of five hub genes in SLE-GSE72326 and IBD-GSE3365. (C, D) Expression of five hub genes in SLE-GSE81622 and IBD-GSE126124. Green color represents normal people and yellow color represents SLE/IBD patients. *p< 0.05; **p< 0.01; ***p< 0.001; ****p< 0.0001.
Figure 6
Figure 6
Correlation of hub genes and immune cell infiltration in SLE and IBD. (A, B) Boxplots showing the pattern of immune cell infiltration in the SLE-GSE72326 cohort and the IBD-GSE3365 cohort. Blue color represents SLE/IBD patients and yellow color represents normal people. (C, D) Heatmaps showing the correlation between hub genes and immune cells. Green color represents positive correlation and red color represents negative correlation. *p< 0.05; **p< 0.01; ***p< 0.001; ns, non-significant.
Figure 7
Figure 7
Single-cell analysis of hub gene expression profiles. (A) UMAP visualization of 18 circulating cells in SLE. (B) UMAP visualization of immune cells in SLE. (C) Localization analysis of hub genes. (D–H) Cellular expression distribution of the five hub genes in controls and SLE patients. (I) Differential analysis based on single-cell pseudo-bulk data. *:p< 0.05; **:p< 0.01; ***:p< 0.001; ns: non-significant.

References

    1. Ma C, Wu W, Lin R, Ge Y, Zhang C, Sun S, et al. . Critical role of CD6highCD4+ T cells in driving th1/th17 cell immune responses and mucosal inflammation in IBD. J Crohn's colitis. (2019) 13:510–24. doi: 10.1093/ecco-jcc/jjy179 - DOI - PubMed
    1. Massart A, Hunt DP. Pulmonary manifestations of inflammatory bowel disease. Am J Med. (2020) 133:39–43. doi: 10.1016/j.amjmed.2019.07.007 - DOI - PubMed
    1. Yu Y, Zhu S, Li P, Min L, Zhang S. Helicobacter pylori infection and inflammatory bowel disease: a crosstalk between upper and lower digestive tract. Cell Death Dis. (2018) 9:961. doi: 10.1038/s41419-018-0982-2 - DOI - PMC - PubMed
    1. Huibregtse IL, van Lent AU, van Deventer SJ. Immunopathogenesis of IBD: insufficient suppressor function in the gut? Gut. (2007) 56:584–92. doi: 10.1136/gut.2006.103523 - DOI - PMC - PubMed
    1. Yen EY, Singh RR. Brief report: lupus-an unrecognized leading cause of death in young females: A population-based study using nationwide death certificates, 2000-2015. Arthritis Rheumatol (Hoboken NJ). (2018) 70:1251–5. doi: 10.1002/art.40512 - DOI - PMC - PubMed

MeSH terms