

Immunomodulatory properties of Bacillus subtilis extracellular vesicles on rainbow trout intestinal cells and splenic leukocytes
- PMID: 38774883
- PMCID: PMC11106384
- DOI: 10.3389/fimmu.2024.1394501
Immunomodulatory properties of Bacillus subtilis extracellular vesicles on rainbow trout intestinal cells and splenic leukocytes
Abstract
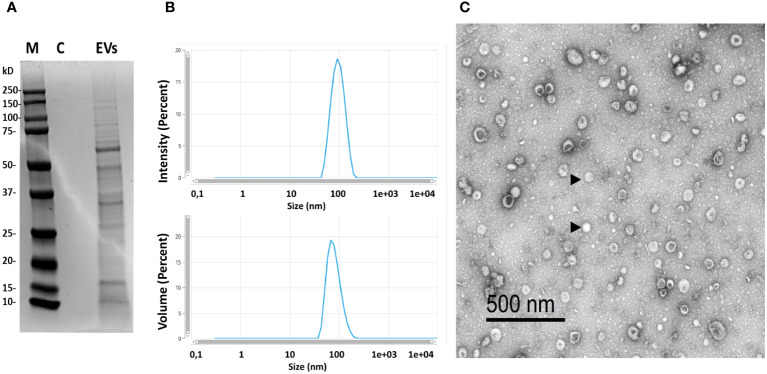
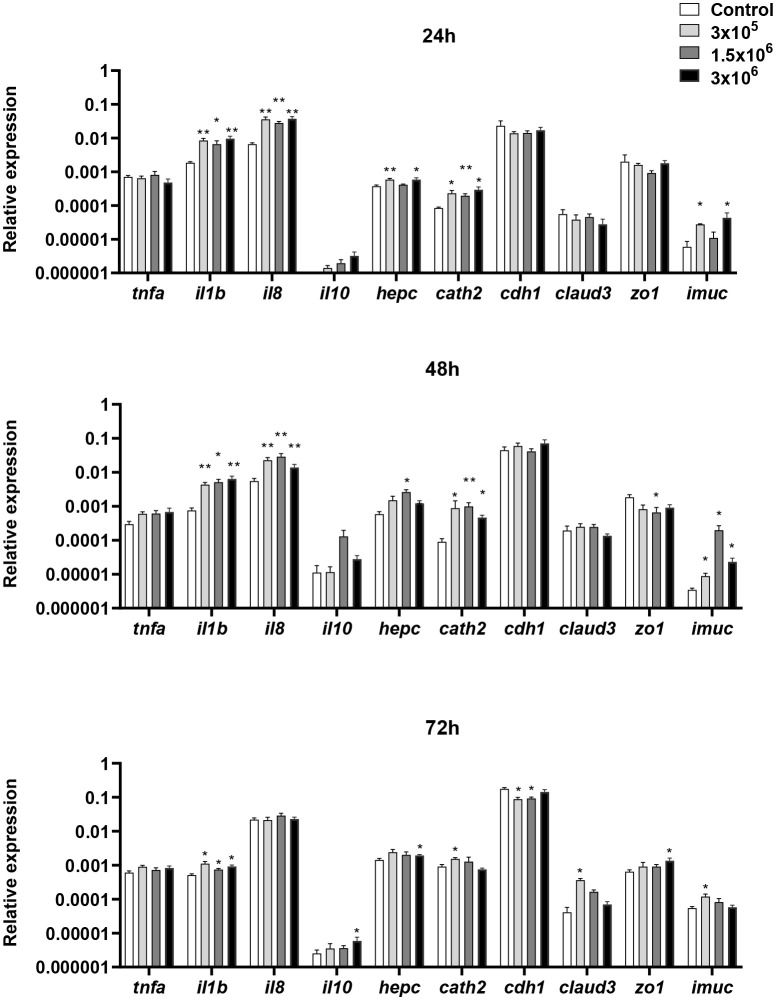
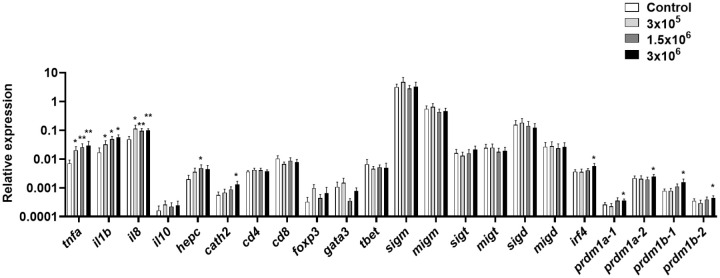
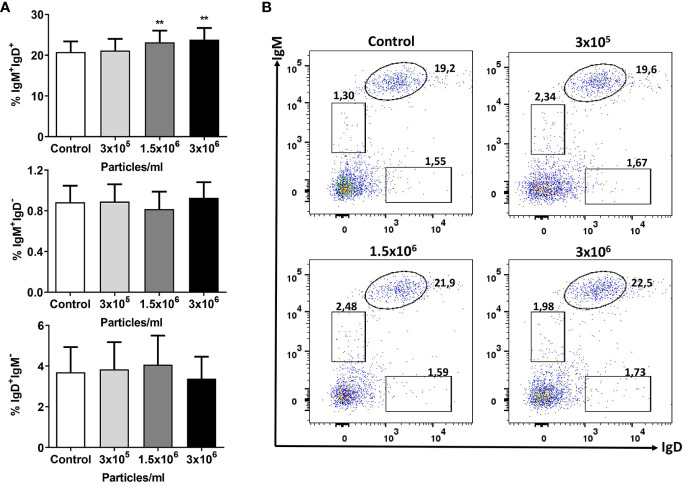
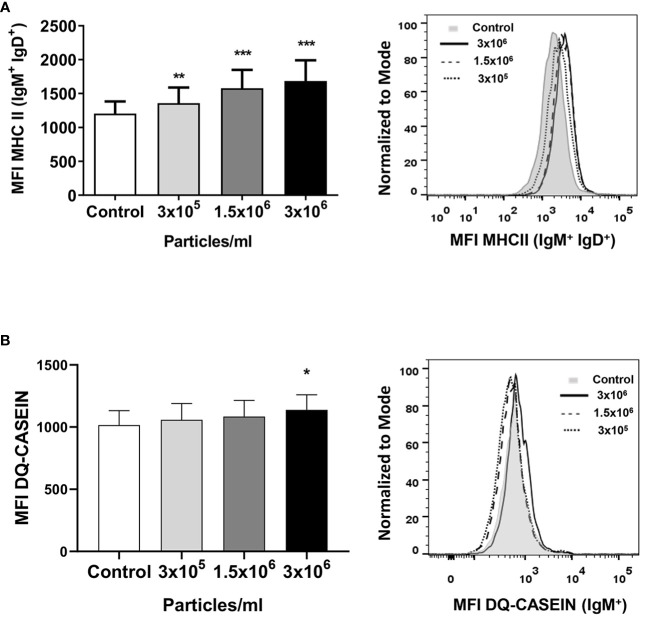
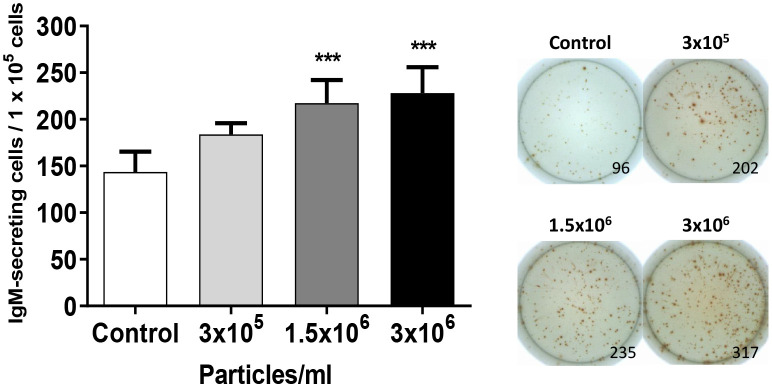
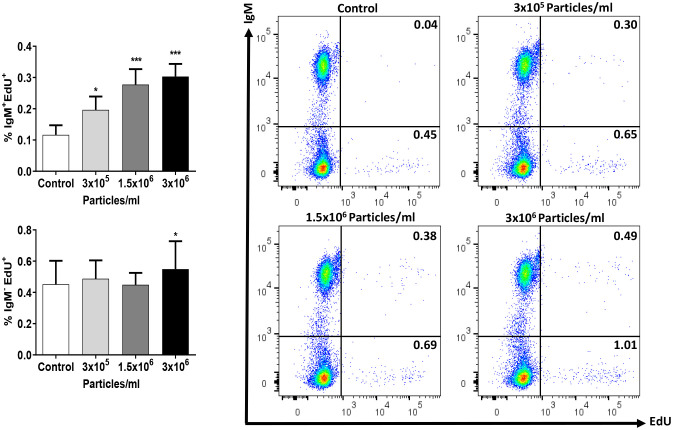
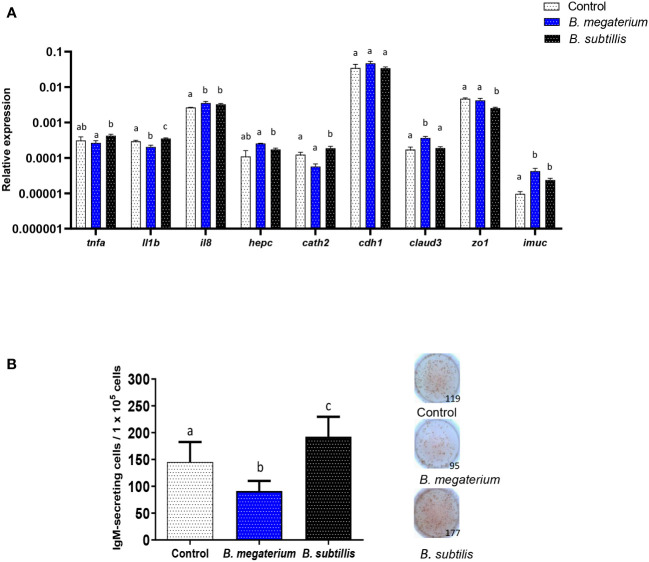
Extracellular vesicles (EVs) are cell-derived membrane-surrounded vesicles that carry bioactive molecules. Among EVs, outer membrane vesicles (OMVs), specifically produced by Gram-negative bacteria, have been extensively characterized and their potential as vaccines, adjuvants or immunotherapeutic agents, broadly explored in mammals. Nonetheless, Gram-positive bacteria can also produce bilayered spherical structures from 20 to 400 nm involved in pathogenesis, antibiotic resistance, nutrient uptake and nucleic acid transfer. However, information regarding their immunomodulatory potential is very scarce, both in mammals and fish. In the current study, we have produced EVs from the Gram-positive probiotic Bacillus subtilis and evaluated their immunomodulatory capacities using a rainbow trout intestinal epithelial cell line (RTgutGC) and splenic leukocytes. B. subtilis EVs significantly up-regulated the transcription of several pro-inflammatory and antimicrobial genes in both RTgutGC cells and splenocytes, while also up-regulating many genes associated with B cell differentiation in the later. In concordance, B. subtilis EVs increased the number of IgM-secreting cells in splenocyte cultures, while at the same time increased the MHC II surface levels and antigen-processing capacities of splenic IgM+ B cells. Interestingly, some of these experiments were repeated comparing the effects of B. subtilis EVs to EVs obtained from another Bacillus species, Bacillus megaterium, identifying important differences. The data presented provides evidence of the immunomodulatory capacities of Gram-positive EVs, pointing to the potential of B. subtilis EVs as adjuvants or immunostimulants for aquaculture.
Keywords: B cells; Bacillus subtilis; RTgutGC; cell line; extracellular vesicles (EVs); probiotics.
Copyright © 2024 Vicente-Gil, Nuñez-Ortiz, Morel, Serra, Docando, Díaz-Rosales and Tafalla.
Conflict of interest statement
The authors declare that the research was conducted in the absence of any commercial or financial relationships that could be construed as a potential conflict of interest. The author(s) declared that they were an editorial board member of Frontiers, at the time of submission. This had no impact on the peer review process and the final decision.
Figures
Similar articles
-
Mucosal and systemic immune effects of Bacillus subtilis in rainbow trout (Oncorhynchus mykiss).Fish Shellfish Immunol. 2022 May;124:142-155. doi: 10.1016/j.fsi.2022.03.040. Epub 2022 Mar 31. Fish Shellfish Immunol. 2022. PMID: 35367376
-
Isolation and characterization of the morphology, size and particle number of rainbow trout (Oncorhynchus mykiss) and zebrafish (Danio rerio) cell line derived large and small extracellular vesicles.Fish Physiol Biochem. 2023 Dec;49(6):1199-1214. doi: 10.1007/s10695-023-01251-z. Epub 2023 Oct 23. Fish Physiol Biochem. 2023. PMID: 37870723 Free PMC article.
-
Immunomodulatory effects of bacteriocinogenic and non-bacteriocinogenic Lactococcus cremoris of aquatic origin on rainbow trout (Oncorhynchus mykiss, Walbaum).Front Immunol. 2023 Apr 20;14:1178462. doi: 10.3389/fimmu.2023.1178462. eCollection 2023. Front Immunol. 2023. PMID: 37153602 Free PMC article.
-
Extracellular Vesicle Biogenesis and Functions in Gram-Positive Bacteria.Infect Immun. 2020 Nov 16;88(12):e00433-20. doi: 10.1128/IAI.00433-20. Print 2020 Nov 16. Infect Immun. 2020. PMID: 32989035 Free PMC article. Review.
-
Immunomodulatory Effects of Probiotic-Derived Extracellular Vesicles: Opportunities and Challenges.J Agric Food Chem. 2024 Sep 4;72(35):19259-19273. doi: 10.1021/acs.jafc.4c04223. Epub 2024 Aug 23. J Agric Food Chem. 2024. PMID: 39177683 Review.
Cited by
-
Impact of probiotics-derived extracellular vesicles on livestock gut barrier function.J Anim Sci Biotechnol. 2024 Nov 7;15(1):149. doi: 10.1186/s40104-024-01102-8. J Anim Sci Biotechnol. 2024. PMID: 39506860 Free PMC article. Review.
-
Bacteroides Fragilis Exacerbates T2D Vascular Calcification by Secreting Extracellular Vesicles to Induce M2 Macrophages.Adv Sci (Weinh). 2025 Feb;12(5):e2410495. doi: 10.1002/advs.202410495. Epub 2024 Dec 12. Adv Sci (Weinh). 2025. PMID: 39665119 Free PMC article.
-
Bacillus subtilis HGCC-1 improves growth performance and liver health via regulating gut microbiota in golden pompano.Anim Microbiome. 2025 Jan 13;7(1):7. doi: 10.1186/s42523-024-00372-x. Anim Microbiome. 2025. PMID: 39806437 Free PMC article.
-
Bacterial Extracellular Vesicles and Antimicrobial Peptides: A Synergistic Approach to Overcome Antimicrobial Resistance.Antibiotics (Basel). 2025 Apr 19;14(4):414. doi: 10.3390/antibiotics14040414. Antibiotics (Basel). 2025. PMID: 40298572 Free PMC article. Review.
References
MeSH terms
LinkOut - more resources
Full Text Sources
Research Materials