. 2024 Aug;11(29):e2306912.
doi: 10.1002/advs.202306912. Epub 2024 May 22.

The Spermine Oxidase/Spermine Axis Coordinates ATG5-Mediated Autophagy to Orchestrate Renal Senescence and Fibrosis

Affiliations

The Spermine Oxidase/Spermine Axis Coordinates ATG5-Mediated Autophagy to Orchestrate Renal Senescence and Fibrosis

Dan Luo et al. Adv Sci (Weinh). 2024 Aug.

Abstract

Decreased plasma spermine levels are associated with kidney dysfunction. However, the role of spermine in kidney disease remains largely unknown. Herein, it is demonstrated that spermine oxidase (SMOX), a key enzyme governing polyamine metabolism, is predominantly induced in tubular epithelium of human and mouse fibrotic kidneys, alongside a reduction in renal spermine content in mice. Moreover, renal SMOX expression is positively correlated with kidney fibrosis and function decline in patients with chronic kidney disease. Importantly, supplementation with exogenous spermine or genetically deficient SMOX markedly improves autophagy, reduces senescence, and attenuates fibrosis in mouse kidneys. Further, downregulation of ATG5, a critical component of autophagy, in tubular epithelial cells enhances SMOX expression and reduces spermine in TGF-β1-induced fibrogenesis in vitro and kidney fibrosis in vivo. Mechanically, ATG5 readily interacts with SMOX under physiological conditions and in TGF-β1-induced fibrogenic responses to preserve cellular spermine levels. Collectively, the findings suggest SMOX/spermine axis is a potential novel therapy to antagonize renal fibrosis, possibly by coordinating autophagy and suppressing senescence.

Keywords: SMOX; autophagy; cell senescence; renal fibrosis; spermine.


Conflict of interest statement

The authors declare no conflict of interest.

Figures

Figure 1
Figure 1
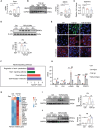
SMOX is induced in renal tubular epithelium in CKD mouse models. A) qRT‐PCR showed the Smox mRNA levels in the injured kidney of UUO mice. B,C) Renal SMOX expression was determined by Western blotting. GAPDH was used as a control (n = 6). Dot plots represent quantitative densitometric data from Western blotting. D) Representative images of Masson trichrome staining (upper panel) and immunostained for SMOX (lower panel) in kidneys after UUO. Scale bar, 100 µm. E) qRT‐PCR showed the Smox mRNA level in the injured kidney of UIRI mice. F,G) Renal SMOX expression was induced at indicated time points after UIRI. GAPDH was used as a control (n = 6). Dot plots represent quantitative densitometric data from western blotting. H) Representative images of Masson trichrome staining (upper panel) and immunostained for SMOX (lower panel) in kidneys after UIRI. Scale bar, 100 µm. I) The relative fold change in spermine in the kidneys of sham surgery, UUO at day 10, or UIRI at day 14 by mass spectrometric detection (n = 6). J,K) The relative fold change in spermine in the kidneys at indicated time points after UUO and UIRI by ELISA (n = 6). Data are expressed as means ± SEM, *P < 0.05, **P < 0.01, ***P < 0.001 versus sham kidneys. UUO, unilateral ureteral obstruction; UIRI, unilateral renal ischemia‐reperfusion.
Figure 2
Figure 2
SMOX is elevated in the kidneys of CKD patients. A) Representative images of Masson trichrome staining (upper panel) and immunostained for SMOX (lower panel) in kidney tissues from CKD patients. Non‐tumor kidney tissues from patients with renal carcinoma were used as controls (Ctrl). Scale bar, 100 µm. B,C) Graphical representation showing the relative abundance of SMOX expression in the kidneys of Ctrl and CKD patients with varying degrees of kidney fibrosis. D,E) The correlations between the positive area for D) SMOX staining and renal fibrosis and E) eGFR in CKD patients. The P value, number of patients (n), and Spearman correlation coefficient (R) are indicated on the graph. Data are expressed as means ± SEM, ***P < 0.001 versus the Ctrl group. CKD, chronic kidney disease; eGFR, estimated glomerular filtration rate; Ctrl, control; Mod, moderate; Ser, severe.
Figure 3
Figure 3
Exogenous spermine alleviates renal fibrosis in CKD mouse models. A) Masson trichrome and picrosirius red staining images in various groups as indicated were shown. Scale bar, 100 µm. Quantitative determination of collagen deposition area based on Masson trichrome and picrosirius red staining in different groups (right panel) (n = 6). B) Representative western blotting and quantitative data for fibrosis‐related protein levels of FN, Col I, and α‐SMA in the kidneys of various groups as indicated were shown. C) Masson trichrome and Picrosirius red staining images in various groups as indicated were shown. Scale bar, 100 µm. Quantitative determination of collagen deposition area based on masson trichrome and picrosirius red staining in different groups. D) Representative western blotting and quantitative data for fibrosis‐related protein levels of FN, Col I, and α‐SMA in the kidneys of different groups as indicated are shown. Data are expressed as means ± SEM, **P < 0.01, ***P < 0.001 versus sham controls; #P < 0.05, ##P < 0.01 versus UUO/UIRI with vehicle (n = 6). FN, fibronectin; Col I, collagen I; α‐SMA, α‐smooth muscle actin.
Figure 4
Figure 4
Knockdown of SMOX ameliorates renal fibrosis in UUO and UIRI mice. A) Schematic diagram of the Smox+/− mouse construction strategy. B) Representative western blotting and quantitative data showing the expression of SMOX in the kidneys of Smox+/+ and Smox+/− mice. *P < 0.05 versus Smox+/+ (n = 3). C) Graphical representations showing the relative fold‐change of spermine in the kidney of Smox+/+ and Smox+/− mice. D) Representative images of kidney tissues from indicated groups with either Masson trichrome (upper panel) or Picrosirius red staining (lower panel). Scale bar, 100 µm. Quantitative assessment of the collagen deposition area based on masson trichrome and picrosirius red staining in different groups. E) Representative western blotting and quantitative data showing fibrosis‐related protein levels of FN, Col I, and α‐SMA in the kidneys of different groups as indicated are shown. F) Representative images of kidney tissues from indicated groups with either masson trichrome staining (upper panel) or picrosirius red staining (lower panel). Scale bar, 100 µm. Quantitative assessment of the collagen deposition area based on masson trichrome and Picrosirius red staining in different groups. G) Representative western blotting and quantitative data for fibrosis‐related protein levels of FN, Col I, and α‐SMA in the kidneys of different groups as indicated are shown. Data are expressed as means ± SEM, **P < 0.01, ***P < 0.001 versus Smox+/+ sham; #P < 0.05, ##P < 0.01 versus Smox+/+ mice with either UUO or UIRI (n = 6).
Figure 5
Figure 5
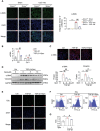
Spermine inhibits TGF‐β1‐induced ECM production in renal tubular cells (mTECs). A,B) Cells were treated with 10 ng/mL of TGF‐β1 for the indicated time periods. The Smox mRNA and SMOX protein levels were analyzed by A) qRT‐PCR and B) Western blotting, respectively. *P < 0.05, ***P < 0.001 versus Ctrl (n = 3). C) Graphical representation showing the relative level of spermine in mTECs with or without TGF‐β1 stimulation, measured by ELISA. *P < 0.05 versus Ctrl (n = 5). D) Cells were preincubated with 5 × 10⁻⁶ and 10 × 10−6 m of spermine (Spm) for 12 h and then treated with 10 ng mL−1 of TGF‐β1 for 24 h. Western blotting and quantitative data of FN expression are presented. ***P < 0.001 versus the Ctrl group; ##P < 0.01 versus TGF‐β1‐stimulated cells without Spm treatment (n = 3). E) Representative micrographs with immunofluorescence staining of vimentin, α‐SMA, and E‐cadherin are shown in different groups. Scale bar, 10 µm. F) Kyoto Encyclopedia of Genes and Genomes (KEGG) enrichment analysis showed that differential signaling pathways were identified by the downregulated differential genes between the TGF‐β1+vehicle and TGF‐β1+Spm groups. G) Heatmap of RNA‐seq data showing the expression of fibrosis‐related genes in different groups (n = 3). H) qRT‐PCR showing the relative mRNA levels of fibrosis‐related genes in different groups. *P < 0.05, **P < 0.01, ***P < 0.001 versus control cells treated without Spm; #P < 0.05, ##P < 0.01, ### P < 0.001 versus cells‐treated with TGF‐β1 (n = 3). I) Cells were transfected with either of control siRNA (siNC) or siRNA specific for SMOX (siSMOX) followed by treatment with 10 ng mL−1 TGF‐β1 for 24 h. Western blotting and quantitative data of FN expression are presented. ***P < 0.001 versus TGF‐β1‐untreated cells; #P < 0.05 versus TGF‐β1‐treated cells without siSMOX (n = 3). J) Cells were transfected with either control vector or SMOX‐overexpression plasmid followed by treatment with 10 ng mL−1 TGF‐β1 for 24 h. Western blotting and quantitative data of FN expression are presented. **P < 0.01 versus TGF‐β1‐untreated cells; #P < 0.05 versus TGF‐β1‐treated cells without SMOX overexpression (n = 3).
Figure 6
Figure 6
Downregulation of SMOX represses autophagy impairment and cellular senescence in renal fibrosis. A) Volcanic map on proteomic analysis shows significantly differential proteins in the kidneys of Smox+/+ and Smox+/− mice with UUO (n = 3). B) GO enrichment analysis shows several important pathways. Data are expressed as means ± SEM. C,D) Representative micrographs and quantitative data with immunohistochemistry staining of p62 and p16 in the kidneys of Smox+/+ and Smox+/− mice. Scale bar, 25 µm. ***P < 0.001 versus the Smox+/+ sham; #P < 0.05 versus Smox+/+ UUO 10d (n = 3–6). E) Representative micrographs and quantitative data with SA‐β‐gal activity staining in the kidneys of Smox+/+ and Smox+/− mice. Scale bar, 50 µm. ***P < 0.001 versus the Smox+/+ sham; #P < 0.05 versus Smox+/+ UUO 10d (n = 6).
Figure 7
Figure 7
Spermine regulates the activation of autophagy and inhibits cellular senescence in renal fibrosis. A) Representative western blotting and quantitative data for indicated proteins in kidneys in different groups as indicated are shown. **P < 0.01, *P < 0.05 versus sham; #P < 0.05 versus UUO mice treated with vehicle (n = 6). B,C) Representative micrographs and quantitative data with immunohistochemistry staining of p62 and p16 in different groups. Scale bar, 25 µm. ***P < 0.001 versus the sham; #P < 0.05 versus UUO mice treated with vehicle (n = 6). D) Representative micrographs and quantitative data with SA‐β‐gal activity staining in different groups. Scale bar, 50 µm. ***P < 0.001 versus the sham; ##P < 0.01 versus UUO mice treated with vehicle (n = 6).
Figure 8
Figure 8
ATG5 interacts with and suppresses the expression of SMOX. A) Images represent the 3D structure and the potential binding of SMOX (green) proteins and ATG5 (purple), ATG7 (yellow), and ATG3 (blue) respectively. DockQ represents the confidence of the potential binding. B) Co‐immunoprecipitation of SMOX and autophagy‐related protein ATG5, ATG7, ATG3. C) Images represent the 3D structure of ATG5 (green) and SMOX (blue) proteins, and the dotted box indicates the binding site of ATG5 and SMOX protein. D) mTECs were transfected with ATG5 overexpression plasmid, and cell lysate was immunoprecipitated (IP) with anti‐ATG5 antibody followed by examination the affected proteins by mass spectrometry. E–G) mTECs or 293T cells were treated with or without TGF‐β1 as indicated. Coimmunoprecipitation of ATG5 and SMOX. H) Double immunofluorescence staining of ATG5 and SMOX in 293T cells. Scale bar, 5 µm. I) Double immunofluorescence staining of ATG5 and SMOX in TGF‐β1‐treated mTECs. Scale bar, 10 µm. J) Representative western blotting and quantitative data for protein levels of SMOX and ATG5 in mTECs transfected with either control siRNA (siNC) or siRNA specific for ATG5 (siATG5). *P < 0.05 versus siNC (n = 3). K) Representative western blotting and quantitative data for SMOX and ATG5 protein levels in mTECs transfected with ATG5 empty vector or overexpression plasmid. *P < 0.05 versus empty vector (n = 3). L) Western blotting showing SMOX protein expression in the kidneys of Atg5+/+ and Atg5−/− mice with or without UUO. M,N) mTECs were transfected with either negative control siRNA (siNC) or siRNA specific for ATG5 (siATG5) followed by treatment with 10 ng mL−1 of TGF‐β1 for 24 h. M) The heatmap shows the different metabolites in cells by non‐target metabolomics. N) The graphical representation shows the relative level of intracellular spermine. *P < 0.05 versus siNC (n = 5). O) Graphical representation showing the relative spermine levels by ELISA in the kidneys of Atg5+/+ and Atg5−/− mice with or without UUO. **P < 0.01, ***P < 0.001 versus Atg5+/+ sham controls; #P < 0.05 versus Atg5+/+ UUO mice (n = 8). Data are expressed as means ± SEM.
Figure 9
Figure 9
Spermine inhibits TGF‐β1‐induced fibroblast proliferation and activation. A) Representative micrographs and quantitative data with immunofluorescence staining of α‐SMA in the kidneys of Smox+/+ and Smox+/− mice. Scale bar, 50 µm. ***P < 0.001 versus the Smox+/+ sham; ##P < 0.01 versus Smox+/+ UUO 10d (n = 3). B) NRK‐49F cells were preincubated with 10 × 10−6 m spermine (Spm) for 12 h and then treated with TGF‐β1 (5 ng mL−1) for 24 h and subjected to qRT‐PCR detection. C) Representative micrographs with immunofluorescence staining of α‐SMA are shown. Scale bar, 10 µm. DAPI denotes the nuclei. D) Western blotting and quantitative data of α‐SMA and vimentin in different groups as indicated are shown. E–G) Representative micrographs with immunofluorescence staining and flow cytometry plots showing the mean fluorescence intensity of EdU in different groups. Scale bar, 10 µm. Data are expressed as means ± SEM, *P < 0.05, **P < 0.01, ***P < 0.001 versus Ctrl; #P < 0.05, ##P < 0.01 versus TGF‐β1; ns, means no significant (n = 3).
Figure 10
Figure 10
Schematic illustration of the potential mechanism of SMOX/spermine axis against renal fibrosis. Created with BioRender.com.

References

    1. Luyckx V. A., Al‐Aly Z., Bello A. K., Bellorin‐Font E., Carlini R. G., Fabian J., Garcia‐Garcia G., Iyengar A., Sekkarie M., Van Biesen W., Ulasi I., Yeates K., Stanifer J., Nat. Rev. Nephrol. 2021, 17, 15. - PMC - PubMed
    1. Chen T. K., Knicely D. H., Grams M. E., JAMA, J. Am. Med. Assoc. 2019, 322, 1294. - PMC - PubMed
    1. Djudjaj S., Boor P., Mol. Aspects Med. 2019, 65, 16. - PubMed
    1. Zhao X., Kwan J. Y. Y., Yip K., Liu P. P., Liu F. F., Nat. Rev. Drug Discovery. 2020, 19, 57. - PubMed
    1. Verissimo T., Faivre A., Rinaldi A., Lindenmeyer M., Delitsikou V., Veyrat‐Durebex C., Heckenmeyer C., Fernandez M., Berchtold L., Dalga D., Cohen C., Naesens M., Ricksten S. E., Martin P. Y., Pugin J., Merlier F., Haupt K., Rutkowski J. M., Moll S., Cippa P. E., Legouis D., De Seigneux S., J. Am. Soc. Nephrol. 2022, 33, 810. - PMC - PubMed

MeSH terms

Substances

LinkOut - more resources