. 2024 May 22:12:RP87756.
doi: 10.7554/eLife.87756.

Aging impairs cold-induced beige adipogenesis and adipocyte metabolic reprogramming

Affiliations

Aging impairs cold-induced beige adipogenesis and adipocyte metabolic reprogramming

Corey D Holman et al. Elife. .

Abstract

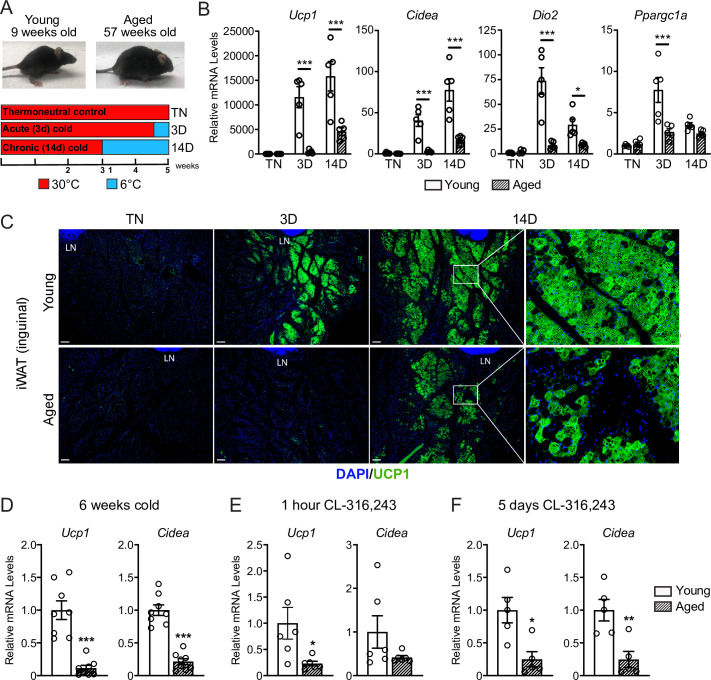
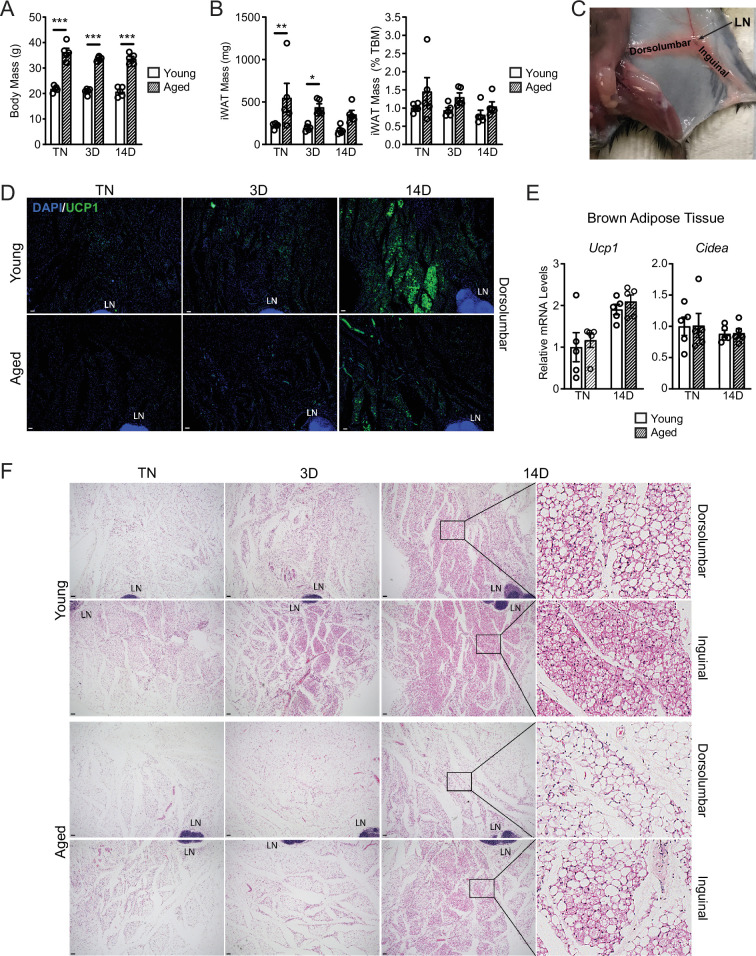
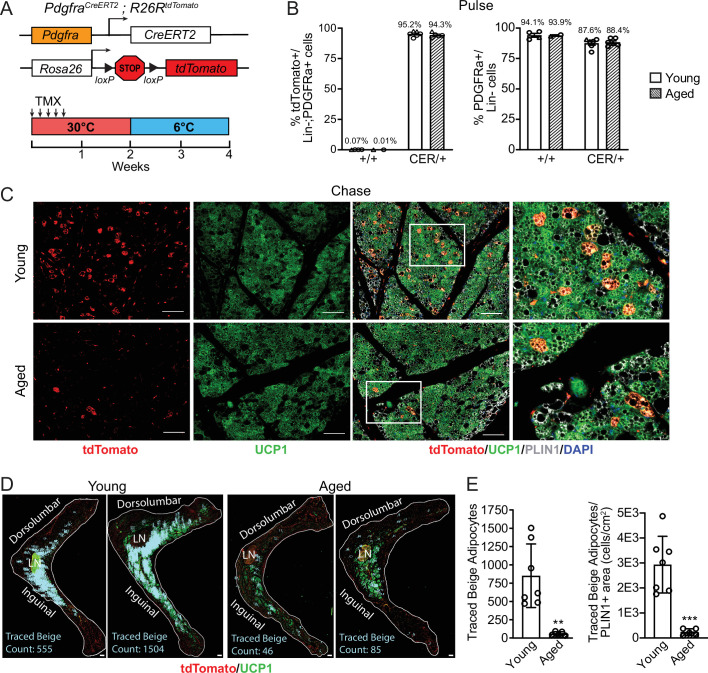
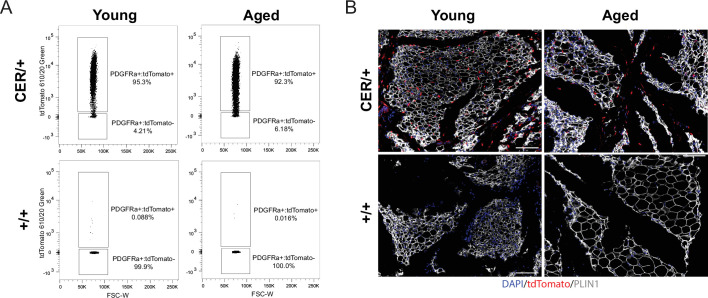
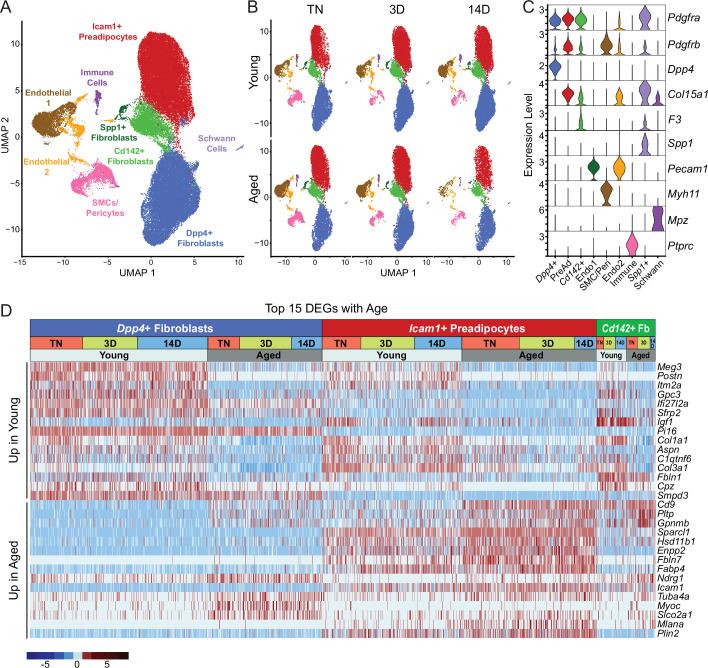
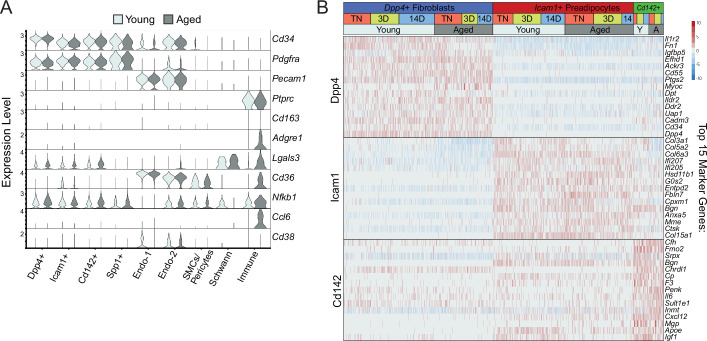
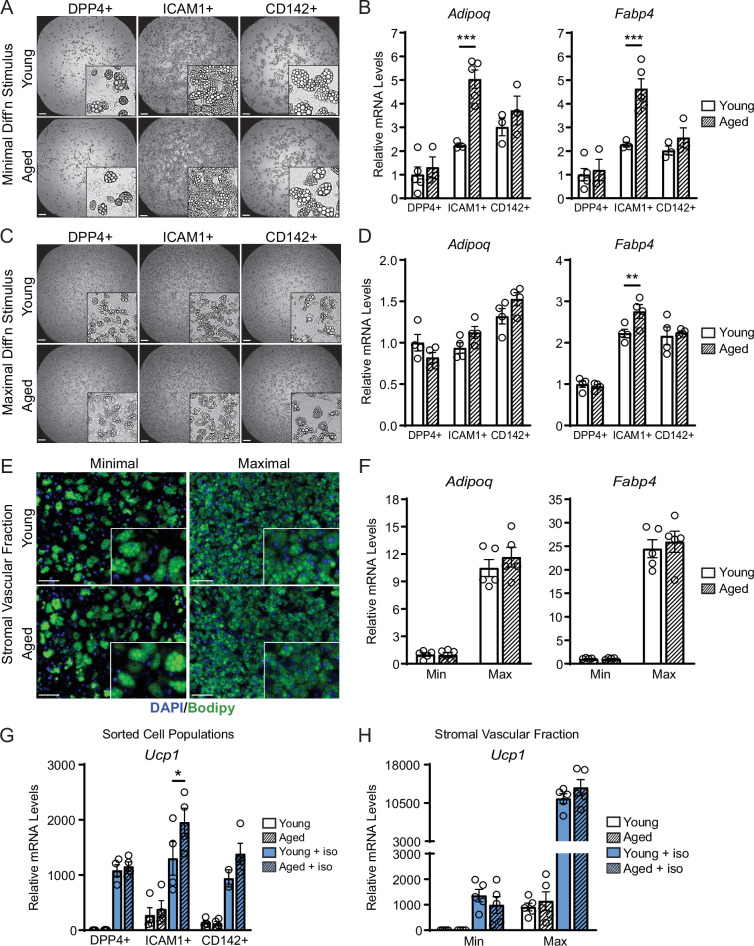
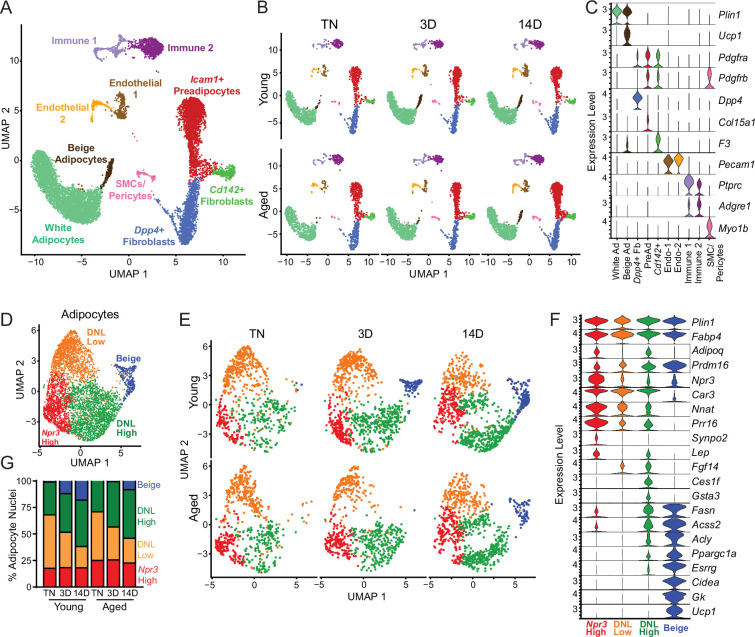
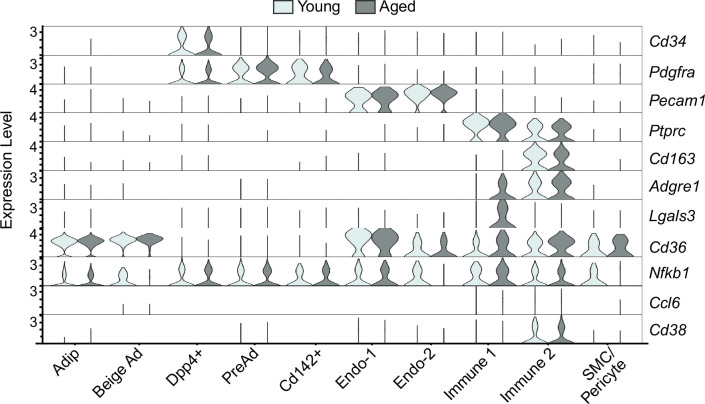
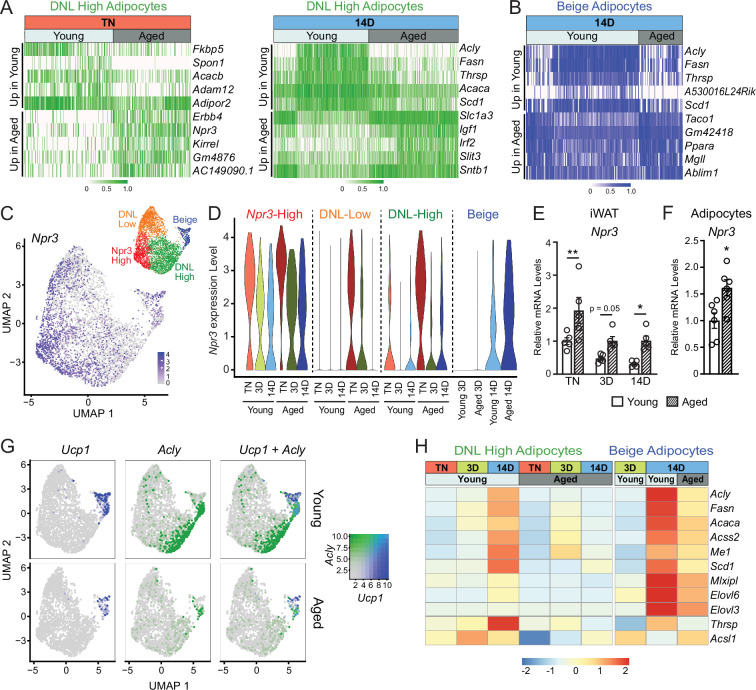
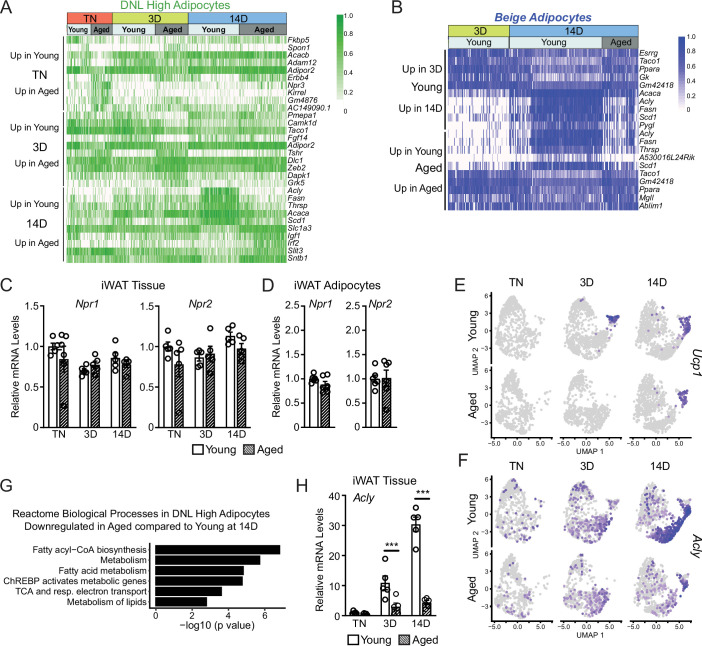
The energy-burning capability of beige adipose tissue is a potential therapeutic tool for reducing obesity and metabolic disease, but this capacity is decreased by aging. Here, we evaluate the impact of aging on the profile and activity of adipocyte stem and progenitor cells (ASPCs) and adipocytes during the beiging process in mice. We found that aging increases the expression of Cd9 and other fibro-inflammatory genes in fibroblastic ASPCs and blocks their differentiation into beige adipocytes. Fibroblastic ASPC populations from young and aged mice were equally competent for beige differentiation in vitro, suggesting that environmental factors suppress adipogenesis in vivo. Examination of adipocytes by single nucleus RNA-sequencing identified compositional and transcriptional differences in adipocyte populations with aging and cold exposure. Notably, cold exposure induced an adipocyte population expressing high levels of de novo lipogenesis (DNL) genes, and this response was severely blunted in aged animals. We further identified Npr3, which encodes the natriuretic peptide clearance receptor, as a marker gene for a subset of white adipocytes and an aging-upregulated gene in adipocytes. In summary, this study indicates that aging blocks beige adipogenesis and dysregulates adipocyte responses to cold exposure and provides a resource for identifying cold and aging-regulated pathways in adipose tissue.

Keywords: UCP1; aging; beige adipocyte; beige adipogenesis; cell biology; cold exposure; developmental biology; mouse.


Conflict of interest statement

CH, AS, RC, LC, EF, CJ, LT, ER, PS No competing interests declared

Figures

Figure 1.
Figure 1.. Aged mice exhibit decreased iWAT beiging in response to cold exposure or β3-agonist treatment.
(A) Young (9-week-old) and aged (57-week-old) C57BL/6 mice were acclimated to 30 °C for 3 weeks, followed by two additional weeks either remaining at 30 °C (TN, thermoneutral), spending the last 3 days at 6 °C (3D, acute cold) or the last 14 days at 6 °C (14D, chronic cold). (B) Relative mRNA levels of thermogenic marker genes in mouse iWAT from (A), n=5. (C) Immunofluorescence analysis of UCP1 (green) and DAPI (blue) in iWAT sections from mice in (A), LN = lymph node. Scale bar 100 μm. (D–F) Relative mRNA levels of Ucp1 and Cidea in iWAT from separate groups of young and aged mice that were either: exposed to 6 °C cold for 6 weeks (D), treated with CL-316,243 for 1 hr (E) or treated with CL 316,243 for 5 days (F). Data represent mean ± SEM, points represent biological replicates, two groups analyzed using a Student’s t-test, and multiple conditions analyzed using a two-way ANOVA with a Tukey correction for multiple comparisons. Significance: not significant, p>0.05; * p<0.05 ** p<0.01; *** p<0.001.
Figure 1—figure supplement 1.
Figure 1—figure supplement 1.. Aging impairs WAT beiging.
(A, B) Body mass and iWAT mass of mice described in Figure 1A, n=5. (C) Mouse dissection with lymph node (LN) orientation showing the dorsolumbar and inguinal regions of the iWAT pad. (D) IF analysis of UCP1 (green) in iWAT, DAPI (nuclei, blue). LN = lymph node. Scale bar 100 μm. (E) mRNA levels of Ucp1 and Cidea in BAT of young and aged mice housed at TN, and either maintained at TN or exposed to cold for 2 weeks. (F) H&E staining of serial sections of iWAT from D (above) and Figure 1C, LN = lymph node. Scale bar 100 μm. Data represent mean ± SEM, points represent biological replicates, analyzed using a Student’s t-test with a two-way ANOVA with a Tukey correction for multiple comparisons. Significance: not significant, p>0.05; * p<0.05 ** p<0.01; *** p<0.001.
Figure 2.
Figure 2.. Aging blocks beige adipogenesis from fibroblastic ASPCs.
(A) Schematic of Pdgfra-CreERT2;R26R-tdTomato reporter mouse model and lineage tracing paradigm. (B) Flow cytometry-based quantification showing proportions of tdTomato-expressing cells (as % of total Live, Lin- (CD45-/CD31-, PDGFRα+ cells)) (left) and PDGFRα+ cells (as % of total Live, Lin- cells) (right) in iWAT from young and aged Cre- (control, +/+), and Cre+ (CER) mice. n=6 young, 5 aged (Circles represent male mice, triangles represent female mice). (C) IF analysis of tdTomato (red), UCP1 (green), PLIN1 (white) and DAPI (blue) in iWAT from young and aged reporter mice after 14 days of 6 °C cold exposure (chase). Scale bar 100 μm. (D) Representative stitched images of full length iWAT histology slices from samples in (C) showing quantification of traced tdTomato+; UCP1 + multilocular (beige) adipocytes (blue numbers). LN = lymph node, scale bar 500 μm. (E) Quantification of traced beige adipocytes from (D) presented as total cell number (left) or proportion of PLIN1 + area (right), n=7 (young), n=5 (aged). Data represent mean ± SEM, points represent biological replicates, two groups analyzed using a Student’s t-test, and multiple conditions analyzed with a two-way ANOVA with a Tukey correction for multiple comparisons. Significance: not significant, p>0.05; * p<0.05 ** p<0.01; *** p<0.001.
Figure 2—figure supplement 1.
Figure 2—figure supplement 1.. Aging blocks beige adipogenesis from PDGFRa +ASPCs.
(A) Representative flow cytometry plots showing expression of tdTomato in gated Live, Lin-; PDGFRα+stromal vascular cells isolated from young and aged reporter mice (described in Figure 2) immediately after treatment with tamoxifen (tmx, pulse). (B) IF analysis of iWAT from young and aged reporter mice with tdTomato (red), PLIN1 (white), and DAPI (blue) after the tmx pulse, scale bar 100 μm.
Figure 3.
Figure 3.. Single-cell expression profiling of ASPCs during iWAT beiging.
(A) Integrated UMAP of gene expression in 54,987 stromal vascular cells (FACS depleted of CD45 +immune cells) from young and aged mouse groups detailed in Figure 1A. (B) UMAPs split by condition. (C) Violin plots showing the expression levels of representative marker genes for cell clusters. Y-axis=log-scale normalized read count. (D) Expression heatmap of the top differentially expressed genes in young vs. aged fibroblastic ASPCs (Dpp4+, Icam1+ preadipocytes and Cd142+ cells). Table shows expression of these genes in ASPC populations across temperature conditions (TN, cold 3D, cold 14D) from young and aged mice.
Figure 3—figure supplement 1.
Figure 3—figure supplement 1.. Single-cell expression profiling of ASPCs during iWAT beiging.
(A) Violin plot showing expression of ARC marker genes in cell clusters split by age, Y-axis=log-scale normalized read count. (B) Expression heatmap of top ASPC marker genes across age and housing conditions.
Figure 4.
Figure 4.. ASPCs from young and aged mice display similar beige adipogenic activity ex vivo.
(A, C) Phase contrast images of DPP4+, ICAM1+ and CD142+ cells from iWAT of young and aged mice that were induced to undergo adipocyte differentiation with minimal (Min, A) or maximal (Max, C) induction cocktail for 8 days. Scale bar 200 μm. (B, D) mRNA levels of adipocyte marker genes Adipoq and Fabp4 in cultures from (A, C). Data points represent separate wells, sorted from a pool of five mice (A) or sorted from two pools of two to three mice (C). (E) Stromal vascular fraction (SVF) cell cultures from the iWAT of young and aged mice were induced to differentiate for 8 days with Minimal or Maximal cocktail, followed by Bodipy (green) staining of lipid droplets and DAPI (blue) staining of nuclei. Scale bar 100 μm. (F) Relative mRNA levels of Adipoq and Fabp4 in cultures from (E). Data points represent wells from individual mice, n=5. (G, H) Relative mRNA levels of Ucp1 in adipocyte cultures from (C, E) with or without treatment with isoproterenol for 4 hr. Data points represent wells sorted from two pools of two to three mice (G) or wells from individual mice, n=5 (H). Data represent mean ± SEM, two groups analyzed using a Student’s t-test, and multiple conditions analyzed with a two-way ANOVA with a Tukey correction for multiple comparisons. Significance: not significant, p>0.05; * p<0.05 ** p<0.01; *** p<0.001.
Figure 5.
Figure 5.. Single-nucleus expression profiling of adipocytes during the beiging process in young and aged mice.
(A) Fully integrated UMAP of mRNA levels in 11,905 nuclei from iWAT of mouse groups detailed in Figure 1A, n=2 mice per condition. (B) UMAPs split by condition. (C) Violin plots showing expression patterns of cell cluster-selective marker genes, Y-axis=log-scale normalized read count. (D) UMAP of gene expression in re-integrated adipocyte clusters including 4937 nuclei from (A) identifying four populations: Npr3-high, beige, DNL-low, and DNL-high. (E) Adipocyte UMAPs split by condition. (F) Violin plots showing expression patterns of selected genes in adipocyte populations, Y-axis=log-scale normalized read count. (G) Adipocyte nuclei numbers in each sample, plotted as percent of total adipocytes captured for that sample.
Figure 5—figure supplement 1.
Figure 5—figure supplement 1.. Single-nucleus expression profiling of iWAT during the beiging process.
Violin plot showing marker gene levels split by age, y-axis=log-scale normalized read count.
Figure 6.
Figure 6.. Aging blocks activation of the lipogenic gene program in adipocytes.
(A) Expression heatmap of the top aging-regulated genes in DNL-high adipocytes at TN (left) and after 14 days of cold exposure (right). (B) Expression heatmap of the top aging-regulated genes in beige adipocytes after 14 days of cold exposure. (C) UMAP of Npr3 mRNA levels in adipocyte populations (from Figure 5D). (D) Violin plots showing Npr3 mRNA levels in adipocyte populations at TN (T), and at 3 and 14 days of cold exposure, Y-axis=log-scale normalized read count. (E) Npr3 mRNA levels in iWAT from mouse groups described in Figure 1A, n=5. (F) Npr3 mRNA levels in isolated adipocytes from TN- acclimated young and aged mice, n=6. (G) UMAPs of Ucp1, Acly, and their co-expression in adipocyte populations from young and aged mice. (H) Heatmap showing average expression of DNL genes in all nuclei from DNL-high and beige adipocytes per condition indicated in the top table. Data represent mean ± SEM, points represent biological replicates, two groups analyzed using a Student’s t-test, and multiple conditions analyzed with a two-way ANOVA with a Tukey correction for multiple comparisons. Significance: not significant, p>0.05; * p<0.05 ** p<0.01; *** p<0.001.
Figure 6—figure supplement 1.
Figure 6—figure supplement 1.. Single-nucleus expression profiling of adipocytes during the beiging process.
(A) Expression heatmap of the top aging-regulated genes in DNL-high adipocytes. (B) Expression heatmap of the top aging- and cold-regulated genes in beige adipocytes. (C, D) Npr1 and Npr2 mRNA levels in iWAT (from mouse groups in Figure 1A) (C), n=5 and in isolated adipocytes from iWAT (D), n=6. (E, F) UMAP of Ucp1 (E) and Acly (F) mRNA levels in adipocyte groups (from Figure 5D). (G) Enrichment analysis of age-regulated genes in DNL high adipocytes. (H) Acly mRNA levels in iWAT (from groups in Figure 1A) n=5. Data are mean ± SEM, points represent biological replicates, two groups analyzed using a Student’s t-test, and multiple conditions analyzed with a two-way ANOVA with a Tukey correction for multiple comparisons. Significance: *p<0.05; **p<0.01; ***p<0.001.

Update of

Comment in

  • Becoming less beige with age.
    Song A, Wang QA. Song A, et al. Elife. 2023 Jul 7;12:e89700. doi: 10.7554/eLife.89700. Elife. 2023. PMID: 37417552 Free PMC article.

References

    1. Barreau C, Labit E, Guissard C, Rouquette J, Boizeau ML, Gani Koumassi S, Carrière A, Jeanson Y, Berger-Müller S, Dromard C, Plouraboué F, Casteilla L, Lorsignol A. Regionalization of browning revealed by whole subcutaneous adipose tissue imaging. Obesity. 2016;24:1081–1089. doi: 10.1002/oby.21455. - DOI - PubMed
    1. Becher T, Palanisamy S, Kramer DJ, Eljalby M, Marx SJ, Wibmer AG, Butler SD, Jiang CS, Vaughan R, Schöder H, Mark A, Cohen P. Brown adipose tissue is associated with cardiometabolic health. Nature Medicine. 2021;27:58–65. doi: 10.1038/s41591-020-1126-7. - DOI - PMC - PubMed
    1. Benvie AM, Lee D, Steiner BM, Xue S, Jiang Y, Berry DC. Age-dependent Pdgfrβ signaling drives adipocyte progenitor dysfunction to alter the beige adipogenic niche in male mice. Nature Communications. 2023;14:1806. doi: 10.1038/s41467-023-37386-z. - DOI - PMC - PubMed
    1. Berry DC, Jiang Y, Graff JM. Mouse strains to study cold-inducible beige progenitors and beige adipocyte formation and function. Nature Communications. 2016;7:10184. doi: 10.1038/ncomms10184. - DOI - PMC - PubMed
    1. Berry DC, Jiang Y, Arpke RW, Close EL, Uchida A, Reading D, Berglund ED, Kyba M, Graff JM. Cellular aging contributes to failure of cold-induced beige adipocyte formation in old mice and humans. Cell Metabolism. 2017;25:166–181. doi: 10.1016/j.cmet.2016.10.023. - DOI - PMC - PubMed

Associated data