. 2024 May 22;9(10):e171650.
doi: 10.1172/jci.insight.171650.

Lentivirus-mediated gene therapy corrects ribosomal biogenesis and shows promise for Diamond Blackfan anemia

Affiliations

Lentivirus-mediated gene therapy corrects ribosomal biogenesis and shows promise for Diamond Blackfan anemia

Yari Giménez et al. JCI Insight. .

Abstract

This study lays the groundwork for future lentivirus-mediated gene therapy in patients with Diamond Blackfan anemia (DBA) caused by mutations in ribosomal protein S19 (RPS19), showing evidence of a new safe and effective therapy. The data show that, unlike patients with Fanconi anemia (FA), the hematopoietic stem cell (HSC) reservoir of patients with DBA was not significantly reduced, suggesting that collection of these cells should not constitute a remarkable restriction for DBA gene therapy. Subsequently, 2 clinically applicable lentiviral vectors were developed. In the former lentiviral vector, PGK.CoRPS19 LV, a codon-optimized version of RPS19 was driven by the phosphoglycerate kinase promoter (PGK) already used in different gene therapy trials, including FA gene therapy. In the latter one, EF1α.CoRPS19 LV, RPS19 expression was driven by the elongation factor alpha short promoter, EF1α(s). Preclinical experiments showed that transduction of DBA patient CD34+ cells with the PGK.CoRPS19 LV restored erythroid differentiation, and demonstrated the long-term repopulating properties of corrected DBA CD34+ cells, providing evidence of improved erythroid maturation. Concomitantly, long-term restoration of ribosomal biogenesis was verified using a potentially novel method applicable to patients' blood cells, based on ribosomal RNA methylation analyses. Finally, in vivo safety studies and proviral insertion site analyses showed that lentivirus-mediated gene therapy was nontoxic.

Keywords: Gene therapy; Genetic diseases; Hematology; Hematopoietic stem cells; Therapeutics.


Conflict of interest statement

Conflict of interest: The authors have declared that no conflict of interest exists.

Figures

Figure 1
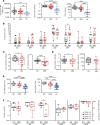
Figure 1. Analysis of the HSPC content and composition of bone marrow samples from patients with DBA.
(A) Cellularity (WBCs/µL), CD34+ cell percentage, and CD34+ cell concentration (cells/µL) in bone marrow (BM) from HDs, patients with FA, and patients with DBA. (B) Frequency of hematopoietic stem cells (HSC, LinCD34+CD38CD90+CD45RA), multipotent progenitors (MPP, CD34+CD38Thy-1CD45RAFlt3+CD7CD10), intermediate hematopoietic progenitors such as common myeloid progenitors (CMP, CD34+CD38+Thy-1CD45RAFlt3+CD7CD10), megakaryocytic and erythroid progenitors (MEP, CD34+CD38+Thy-1CD45RAFlt3CD7CD10), granulocyte–monocyte progenitors (GMP, CD34+CD38+Thy-1CD45RA+Flt3+CD7CD10), multilymphoid progenitors (MLP, CD34+CD38Thy-1loCD45RAFlt3+CD7–/+CD10), and B-NKs (CD34+CD38Thy-1loCD45RAFlt3+CD7–/+CD10+). (C) CD71+CD235a+ and CD71CD235a+ proerythroblast content (cells/μL) of BM from DBA patients compared with HDs. (D) CD41+CD42+ frequency and content of BM from patients with DBA compared with HDs. (E) Number of granulocyte-macrophage progenitor colony-forming units (CFU-GMs) per 105 seeded mononuclear cells (MNCs) and number of burst-forming unit-erythroid progenitors (BFU-Es) per 105 seeded MNCs. (F) Left: Percentage of human CD45+ (hCD45+) cells found in mouse BM at 3 time points posttransplantation (30, 60, and 90 days). Right: differentiation to the different lineages (CD33+: myeloid, CD19+: lymphoid, and CD34+: HSCs). The graphs show the median and interquartile range along with the 90th and 10th percentiles. In both graphs, each symbol represents 1 patient. The degree of statistical significance was determined by multiple-comparison Kruskal-Wallis test (P value; * ≤ 0.017; ** ≤ 0.003; *** ≤ 0.0003; **** ≤ 0.00003) for figures A and E. The degree of significance was determined with the 2-tailed Mann-Whitney test (P value; * ≤ 0.05; ** ≤ 0.01; *** ≤ 0.001; **** ≤ 0.0001) for BD. Patients with DBA marked with darker dots were under corticosteroid treatment.
Figure 2
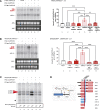
Figure 2. Phenotypic correction of DBA cell models using PGK.CoRPS19 LV and EF1α.CoRPS19 LV therapeutic LVs.
(A) Northern blot analysis of precursor rRNA levels. Left, upper part: pre-rRNA precursors from K562 cells transduced with the interference vector THM-shRPS19 LV, with or without a therapeutic vector (PGK.CoRPS19 or EF1α.CoRPS19 LVs), probed with a radioactively labeled oligonucleotide (LD2122). Left, lower part: mature 18S and 28S rRNAs on an ethidium bromide–stained gel. Right, phosphorimager quantification of the combined amounts of 21S and 21C pre-rRNAs, mean value and standard deviation of 3 experiments. The degree of significance was determined with the 1-way ANOVA test (P value; ** ≤ 0.01; *** ≤ 0.001; **** ≤ 0.0001). (B) Northern blot analysis of precursor rRNA levels. Left, total RNA extracted from K562 cells transduced with interference vector MISSION-shRPS19 LV, with or without the therapeutic PGK.CoRPS19 or EF1α.CoRPS19 LVs. Right, phosphorimager quantification of the combined amounts of 21S and 21C pre-rRNAs, mean value and standard deviation of 3 experiments. The degree of significance was determined with the 1-way ANOVA test (P value; **** ≤ 0.0001). Both blots shown are representative of triplicate blots (Supplemental Figure 3). (C) Primer extension analysis of precursor rRNA dimethylation levels in K562 cells transduced with the interference vector THM.shRPS19 LV, with or without a therapeutic vector (PGK.CoRPS19 LV or EF1α.CoRPS19 LV). A radioactively labeled oligonucleotide, LD2122, specific to the internal transcribed spacer 1 (ITS1) sequence located 3′ to the dimethylation mark, was extended with reverse transcriptase (see D). The position of the dimethylation is indicated. Dimethylation levels were quantitated with a phosphorimager (signal normalized to the band denoted with a star) as described (31). (D) Schematics representing the oligonucleotides used in Northern blotting (LD2122) and primer extension (LD2141, see C) and the major pre-rRNA precursors detected.
Figure 3
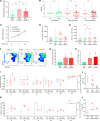
Figure 3. Phenotypic hematopoietic correction mediated by transduction of BM CD34+ cells from DBA patients with PGK.CoRPS19 LV or EF1α(s).CoRPS19 LV.
(A) Transduction efficiency of DBA patient hematopoietic progenitors: PGK.EGFP LV (n = 4), PGK.CoRPS19 LV (n = 6), or EF1α.CoRPS19 LV (n = 4). The data are presented as means with standard deviation. CFCs, colony-forming cells. (B) Vector copy number (VCN) in cells maintained in liquid culture (LC) and in CFCs at 14 days of culture. PGK.EGFP LV (n = 4), PGK.CoRPS19 LV (n = 5), and EF1α.CoRPS19 LV (n = 3). (C) Number of HSPCs after 0, 7, and 14 days of LC expansion specific for HSCs. (D and E) Number of CFU-GM and BFU-E colonies per 10 × 10–5 mononuclear cells seeded. n = 3 PGK.EGFP LV, n = 5 PGK.CoRPS19 LV, and n = 5 EF1α.CoRPS19 LV. (F) Flow cytometry strategy used to analyze erythroid progenitors, (G) percentage of CD71/CD235a+, and (H) increment of CD71/CD235a+ mature erythroid progenitors, obtained in BM CD34+ DBA cells from 3 patients posttransduction at day 14 of specific erythroid expansion culture. The graph shows the mean and standard deviation obtained in 3 patients. (I) Left: percentage of hCD45+ engrafted cells at 30, 60, and 90 days posttransplantation with 10 × 10–5 BM CD34+ transduced cells from DBA patients. Right: myeloid cells (CD33+), lymphoid cells (CD19+), and HSCs (CD34+) of DBA patient cells transplanted posttransduction into NSG mice. Each symbol represents 1 specific patient. (J) VCN at day 90 posttransplantation. The graph shows the mean and standard error of the mean. (K) Left: Percentage of hCD45+ cells measured 30, 60, and 90 days (indicated below the graph) after transplantation of 8 × 10⁻⁵ BM CD34+ cells from patient DBA-37. Right: Myeloid cells (CD33+), lymphoid cells (CD19+), and HSCs (CD34+) of DBA patient cells transduced and transplanted into NSG mice. (L) VCN, at day 90 posttransplantation, in hCD45+ cells (from patient DBA-37). Multiple-comparison Kruskal-Wallis test (P value; * ≤ 0.017).
Figure 4
Figure 4. Improved erythroid differentiation mediated by transduction of BM CD34+ cells from DBA patients with PGK.CoRPS19 LV or EF1α(s).CoRPS19 LV.
(A) Protocol used to obtain a model of in vivo erythropoiesis in immunodeficient NSG mice. (B) Flow cytometry strategy used. (C) Bar plot showing the percentage of CD71/CD235a+ cells resulting from BM hCD45+ DBA cells transduced with PGK.CoRPS19 LV. (D) Primer extension analysis of precursor rRNA dimethylation levels. The experiment was performed on human CD45+ hematopoietic cells purified at 90 days posttransplantation from NSG mice that had been transplanted with DBA patient CD34+ cells previously transduced with the therapeutic vector PGK.CoRPS19 LV. Arrows indicate the position of the dimethylation. Dimethylation levels were quantitated (signal normalized to the band denoted with a double star). (E) Expression of CoRPS19 in RPS19-deficient CD34+ cells corrected with PGK.CoRPS19 LV, after 14 days of expansion in erythroid differentiation medium. The graph shows the mean and the standard deviation (n = 4). (F) Erythroid progenitor expansion in erythroid differentiation medium after transduction of thawed CD34+ cells from 4 DBA patients with PGK.CoRPS19 LV, as compared with the corresponding nontransduced RPS19-deficient cells (MOCK). (G) Total yield of CD71/CD235a+ mature erythroid progenitors after transfection of thawed CD34+ cells with PGK.CoRPS19 LV, as compared with nontransduced RPS19-deficient cells (mock). The graph shows the mean and the standard deviation. (H) Left: Engraftment level (percentage of hCD45+ cells) measured 30, 45, and 60 days after transplantation of 3 × 10⁻⁵ BM CD34+ cells from 4 DBA patients (DBA-47, DBA-48, DBA-49, DBA-50) in NBSGW mouse strain. Right: multilineage potential of DBA patient cells transduced with the therapeutic vector PGK.CoRPS19 LV or untransduced: myeloid cells (CD33+), lymphoid cells (CD19+), and HSCs (CD34+). Each symbol represents 1 specific patient. (I) Engrafted erythroid cell populations (expressed as percentages) observed at 45 days posttransplantation in NBSGW recipients.
Figure 5
Figure 5. Safety studies mediated by the overexpression of RPS19 in cord blood CD34+ cells from HDs transduced with the therapeutic PGK.CoRPS19 LV.
Graphs refer to HD cord blood (CB) CD34+ cells transduced with therapeutic vector PGK.CoRPS19 LV or the control vector PGK.EGFP LV. (A) Growth curves of HD HSPC progenitors maintained in HSC expansion medium, after transduction. The graph shows the mean and standard deviation of 5 experiments. Mann-Whitney test. x axis, days. (B and C) Healthy donor umbilical cord CD34+ cells transduced with PGK.CoRPS19 LV or PGK.EGFP LV (control). (B) Number of granulocyte-macrophage progenitor colony-forming units (CFU-GMs) per 105 mononuclear cells seeded. (C) The number of BFU-Es per 105 mononuclear cells seeded. The degree of significance was determined with the Mann-Whitney test. (D) Body weight of NSG mice transplanted with HD CD34+ cells transduced with the therapeutic vector PGK.CoRPS19 LV or the control vector PGK.EGFP LV. (E) The repopulation potential was determined by quantifying the percentage of hCD45+ cells in NSG recipient mice up to day 120. (F) VCN in human HSPC engrafted into NSG recipient mice. The graph shows the mean and standard error of the mean of 2 different experiments after transducing healthy donor CD34+ cells from CB and transplanting them into NSG mice. Statistical significance was determined with the Mann-Whitney test (P value; * ≤ 0.05). (G) Distribution of myeloid cells (CD33+), lymphoid cells (CD19+), and HSCs (CD34+) in NSG recipients. (H) Determination of hematological parameters in NSG mice transplanted: erythrocytes, leukocytes, platelets, and neutrophils. The graph shows the mean and standard error of the mean of 2 different experiments conducted to analyze safety and in vivo toxicity effects of the therapeutic vectors after transfecting HD CD34+ cells from CB and transplanting them into NSG mice. Statistical significance was determined with the 2-tailed Mann-Whitney test. x axis, days.
Figure 6
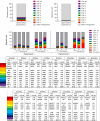
Figure 6. Analysis of the ISs of PGK.CoRPS19 LV in CD34+ cells from HDs.
The data are presented as cumulative retrieval frequencies of the 10 most prominent cell ISs detected in liquid cultures and all mouse recipient samples (referred to as R1 to R6). For individual samples, sequence data from all shearing extension first tag selection ligation-mediated PCR replicates were combined. Sequence counts for the 10 most prominent ISs, of all remaining ISs as well as total sequence count from all replicates are shown at the bottom for each sample. RefSeq names of genes located closest to ISs are in the table. Relative sequence count contributions of the 10 most prominent ISs and of all remaining mappable ISs are shown (frequency).

References

    1. Da Costa L, et al. Diamond-Blackfan anemia. Blood. 2020;136(11):1262–1273. doi: 10.1182/blood.2019000947. - DOI - PMC - PubMed
    1. Vlachos A, et al. Incidence of neoplasia in Diamond Blackfan anemia: a report from the Diamond Blackfan anemia registry. Blood. 2012;119(16):3815–3819. doi: 10.1182/blood-2011-08-375972. - DOI - PMC - PubMed
    1. Da Costa L, et al. Molecular approaches to diagnose Diamond-Blackfan anemia: the EuroDBA experience. Eur J Med Genet. 2018;61(11):664–673. doi: 10.1016/j.ejmg.2017.10.017. - DOI - PubMed
    1. Sankaran VG, et al. Exome sequencing identifies GATA1 mutations resulting in Diamond-Blackfan anemia. J Clin Invest. 2012;122(7):2439–2443. doi: 10.1172/JCI63597. - DOI - PMC - PubMed
    1. Klar J, et al. Recurrent GATA1 mutations in Diamond-Blackfan anaemia. Br J Haematol. 2014;166(6):949–951. doi: 10.1111/bjh.12919. - DOI - PubMed

Substances