

Computing linkage disequilibrium aware genome embeddings using autoencoders
- PMID: 38775680
- PMCID: PMC11208726
- DOI: 10.1093/bioinformatics/btae326
Computing linkage disequilibrium aware genome embeddings using autoencoders
Abstract
Motivation: The completion of the genome has paved the way for genome-wide association studies (GWAS), which explained certain proportions of heritability. GWAS are not optimally suited to detect non-linear effects in disease risk, possibly hidden in non-additive interactions (epistasis). Alternative methods for epistasis detection using, e.g. deep neural networks (DNNs) are currently under active development. However, DNNs are constrained by finite computational resources, which can be rapidly depleted due to increasing complexity with the sheer size of the genome. Besides, the curse of dimensionality complicates the task of capturing meaningful genetic patterns for DNNs; therefore necessitates dimensionality reduction.
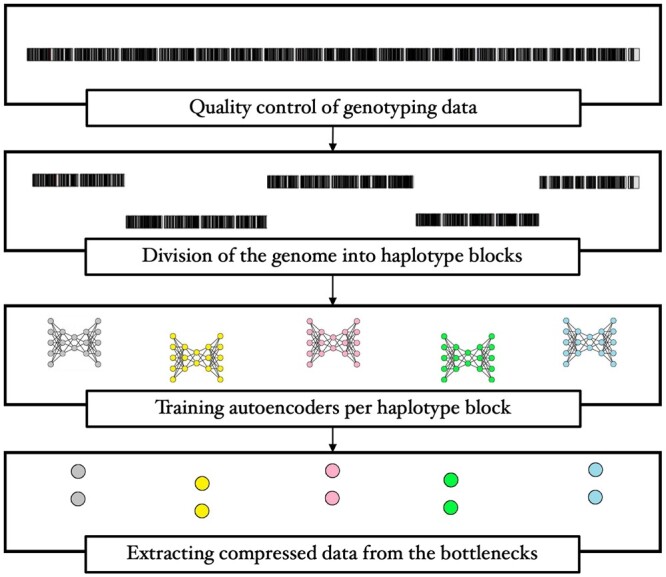
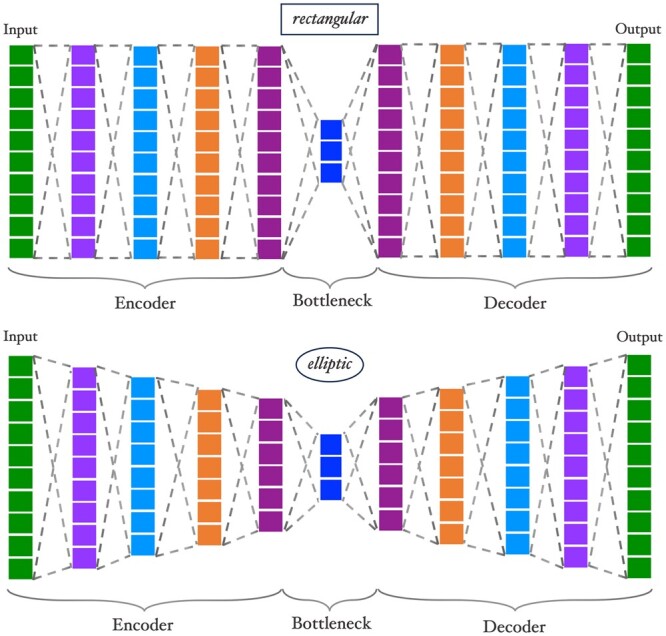
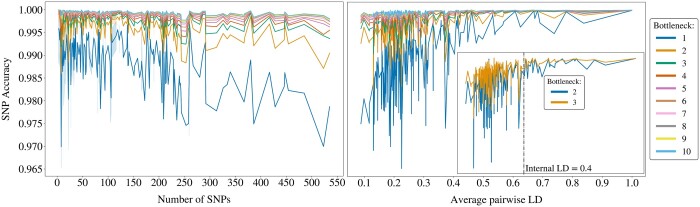
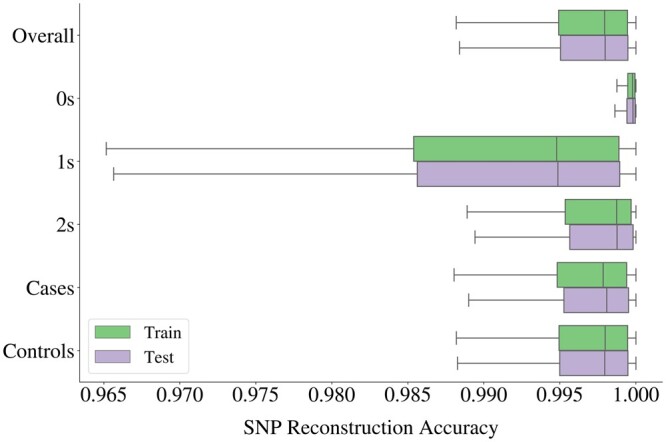
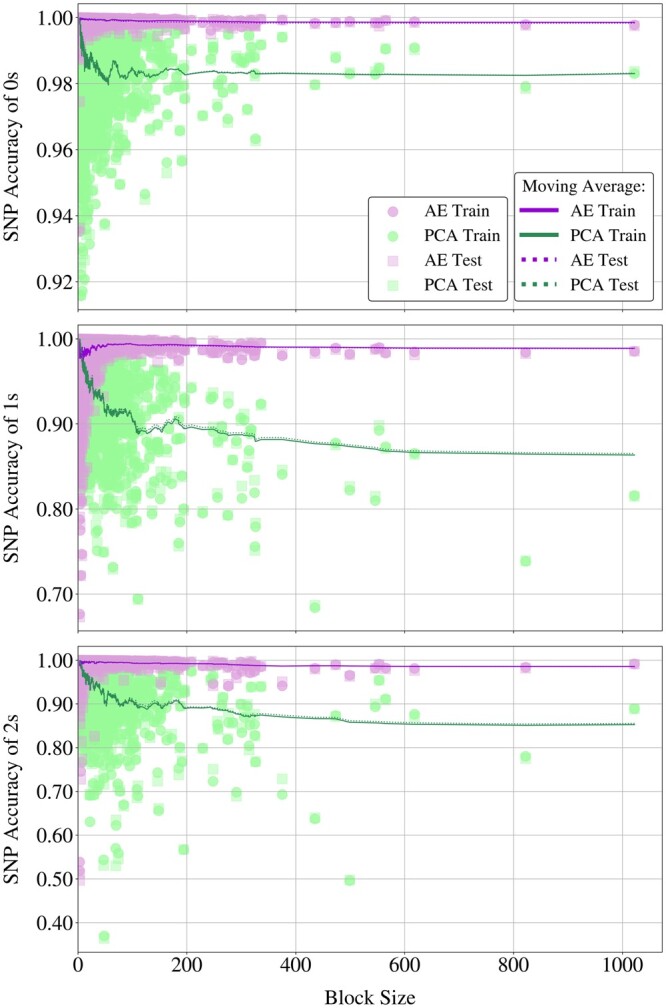
Results: We propose a method to compress single nucleotide polymorphism (SNP) data, while leveraging the linkage disequilibrium (LD) structure and preserving potential epistasis. This method involves clustering correlated SNPs into haplotype blocks and training per-block autoencoders to learn a compressed representation of the block's genetic content. We provide an adjustable autoencoder design to accommodate diverse blocks and bypass extensive hyperparameter tuning. We applied this method to genotyping data from Project MinE, and achieved 99% average test reconstruction accuracy-i.e. minimal information loss-while compressing the input to nearly 10% of the original size. We demonstrate that haplotype-block based autoencoders outperform linear Principal Component Analysis (PCA) by approximately 3% chromosome-wide accuracy of reconstructed variants. To the extent of our knowledge, our approach is the first to simultaneously leverage haplotype structure and DNNs for dimensionality reduction of genetic data.
Availability and implementation: Data are available for academic use through Project MinE at https://www.projectmine.com/research/data-sharing/, contingent upon terms and requirements specified by the source studies. Code is available at https://github.com/gizem-tas/haploblock-autoencoders.
© The Author(s) 2024. Published by Oxford University Press.
Conflict of interest statement
None declared.
Figures

References
-
- Altman N, Krzywinski M.. The curse(s) of dimensionality. Nat Methods 2018;15:399–400. - PubMed
-
- Bank D, Koenigstein N, Giryes R. Autoencoders. arXiv 2003.05991 [Preprint]. 2020. Available from: https://arxiv.org/abs/2003.05991.
-
- Barrett JC, Fry B, Maller J. et al. Haploview: analysis and visualization of LD and haplotype maps. Bioinformatics 2005;21:263–5. - PubMed
Publication types
MeSH terms
Grants and funding
LinkOut - more resources
Full Text Sources
Research Materials
