. 2024 May 28;121(22):e2321167121.
doi: 10.1073/pnas.2321167121. Epub 2024 May 22.

Structure and mechanism of the human CTDNEP1-NEP1R1 membrane protein phosphatase complex necessary to maintain ER membrane morphology

Affiliations

Structure and mechanism of the human CTDNEP1-NEP1R1 membrane protein phosphatase complex necessary to maintain ER membrane morphology

Shujuan Gao et al. Proc Natl Acad Sci U S A. .

Abstract

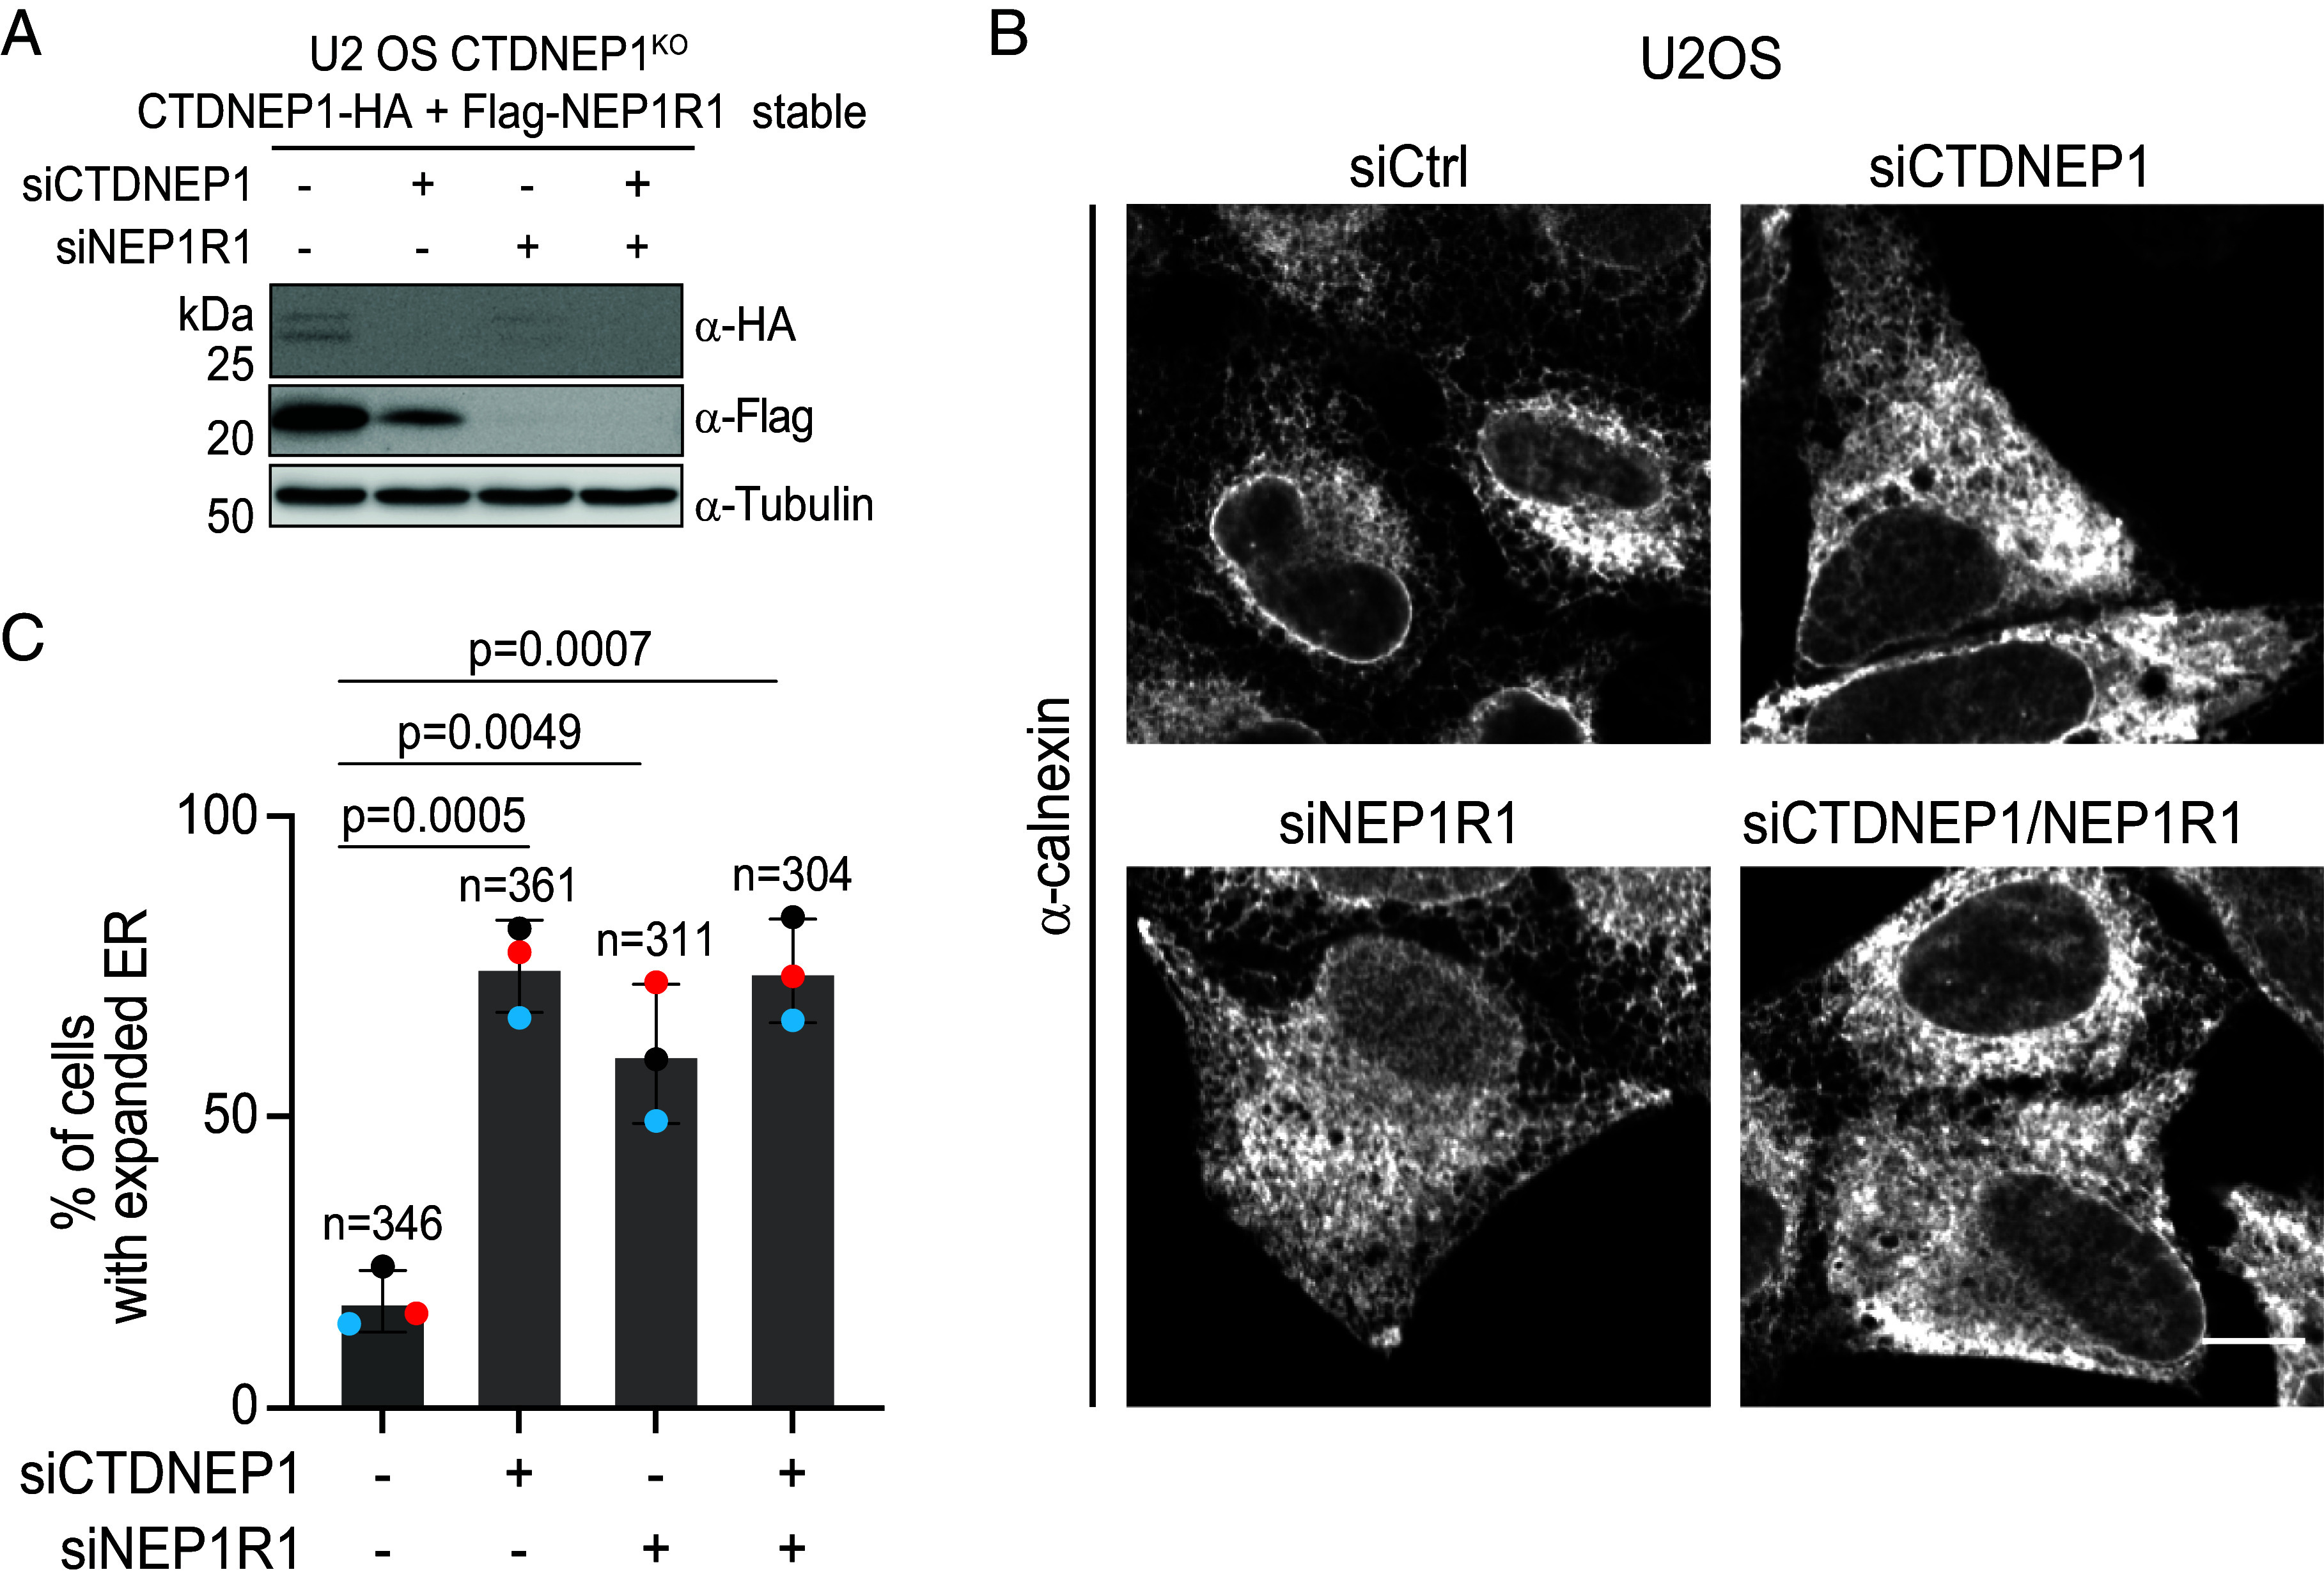
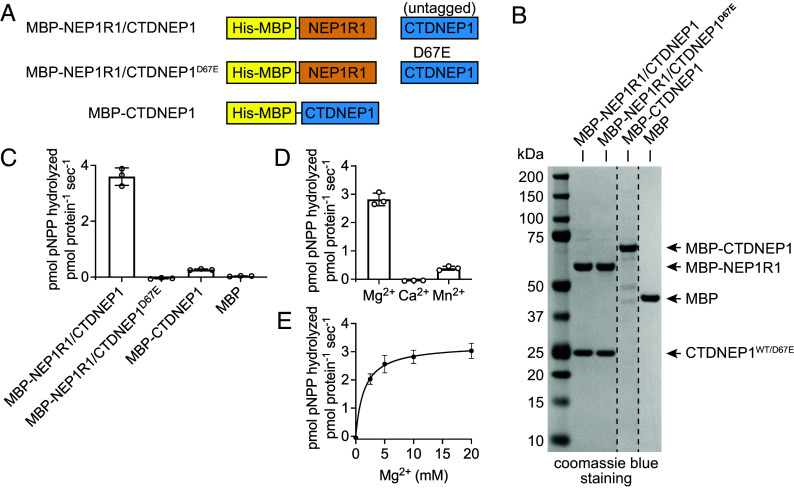
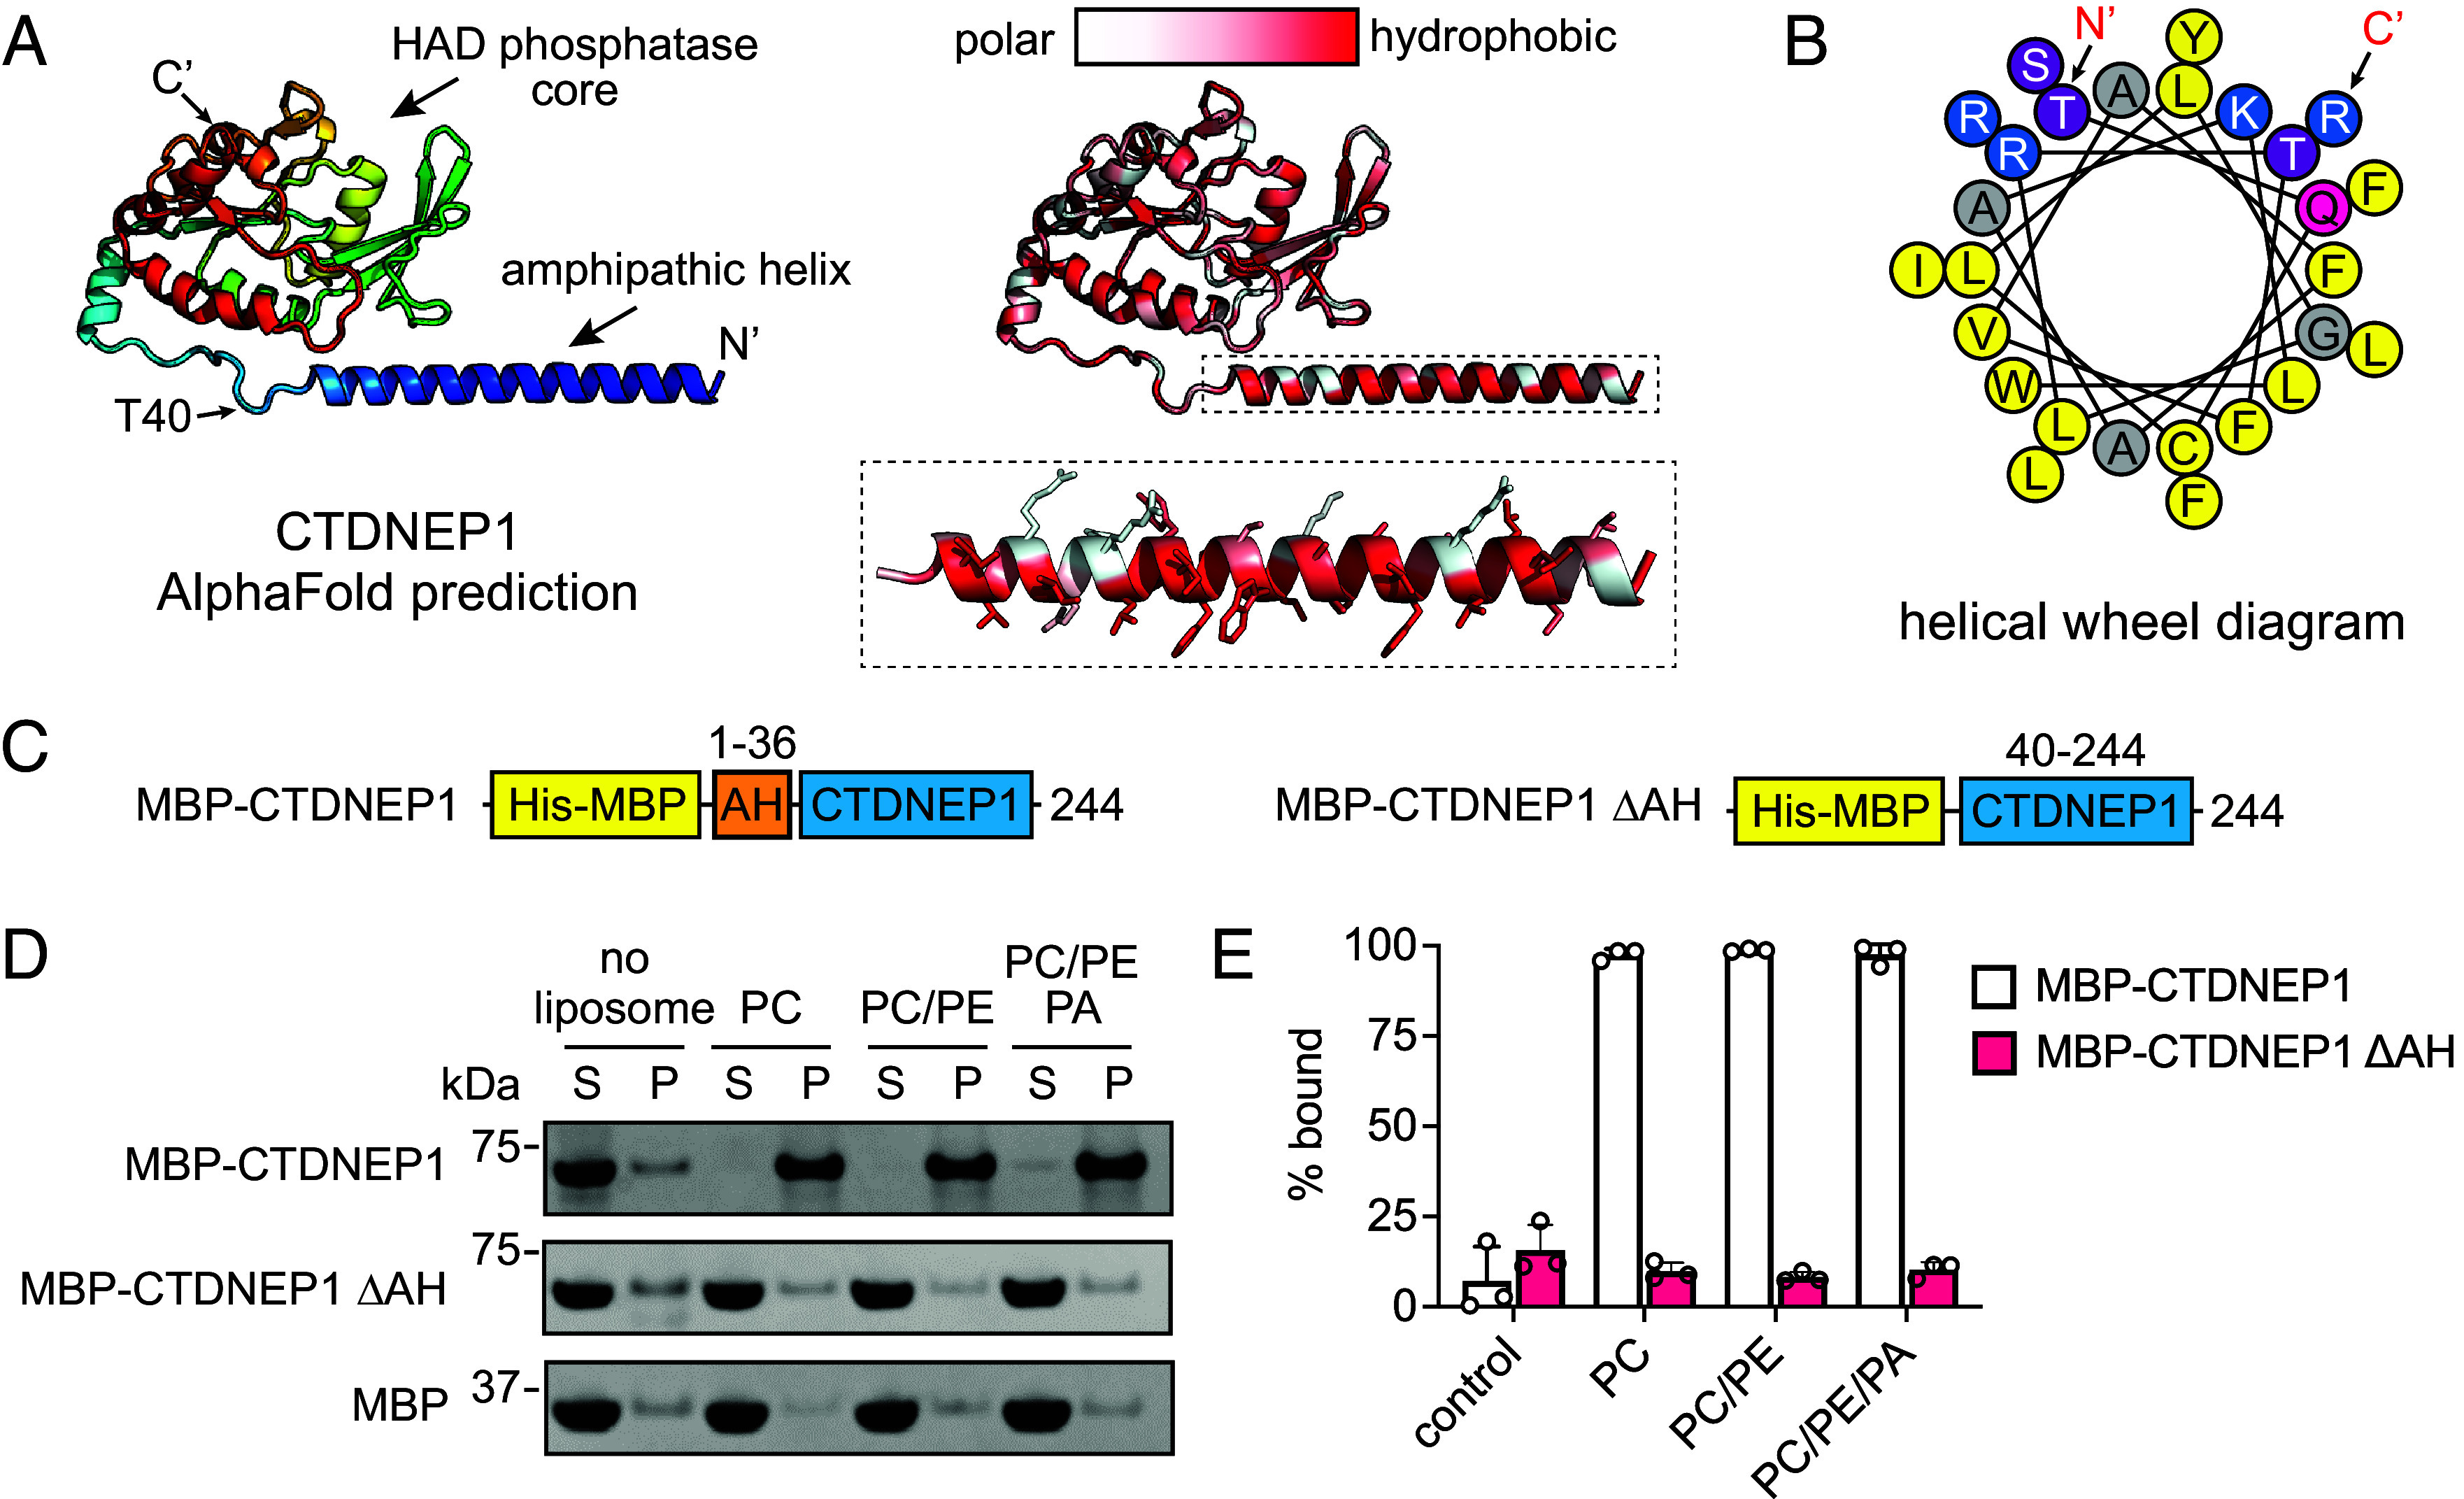
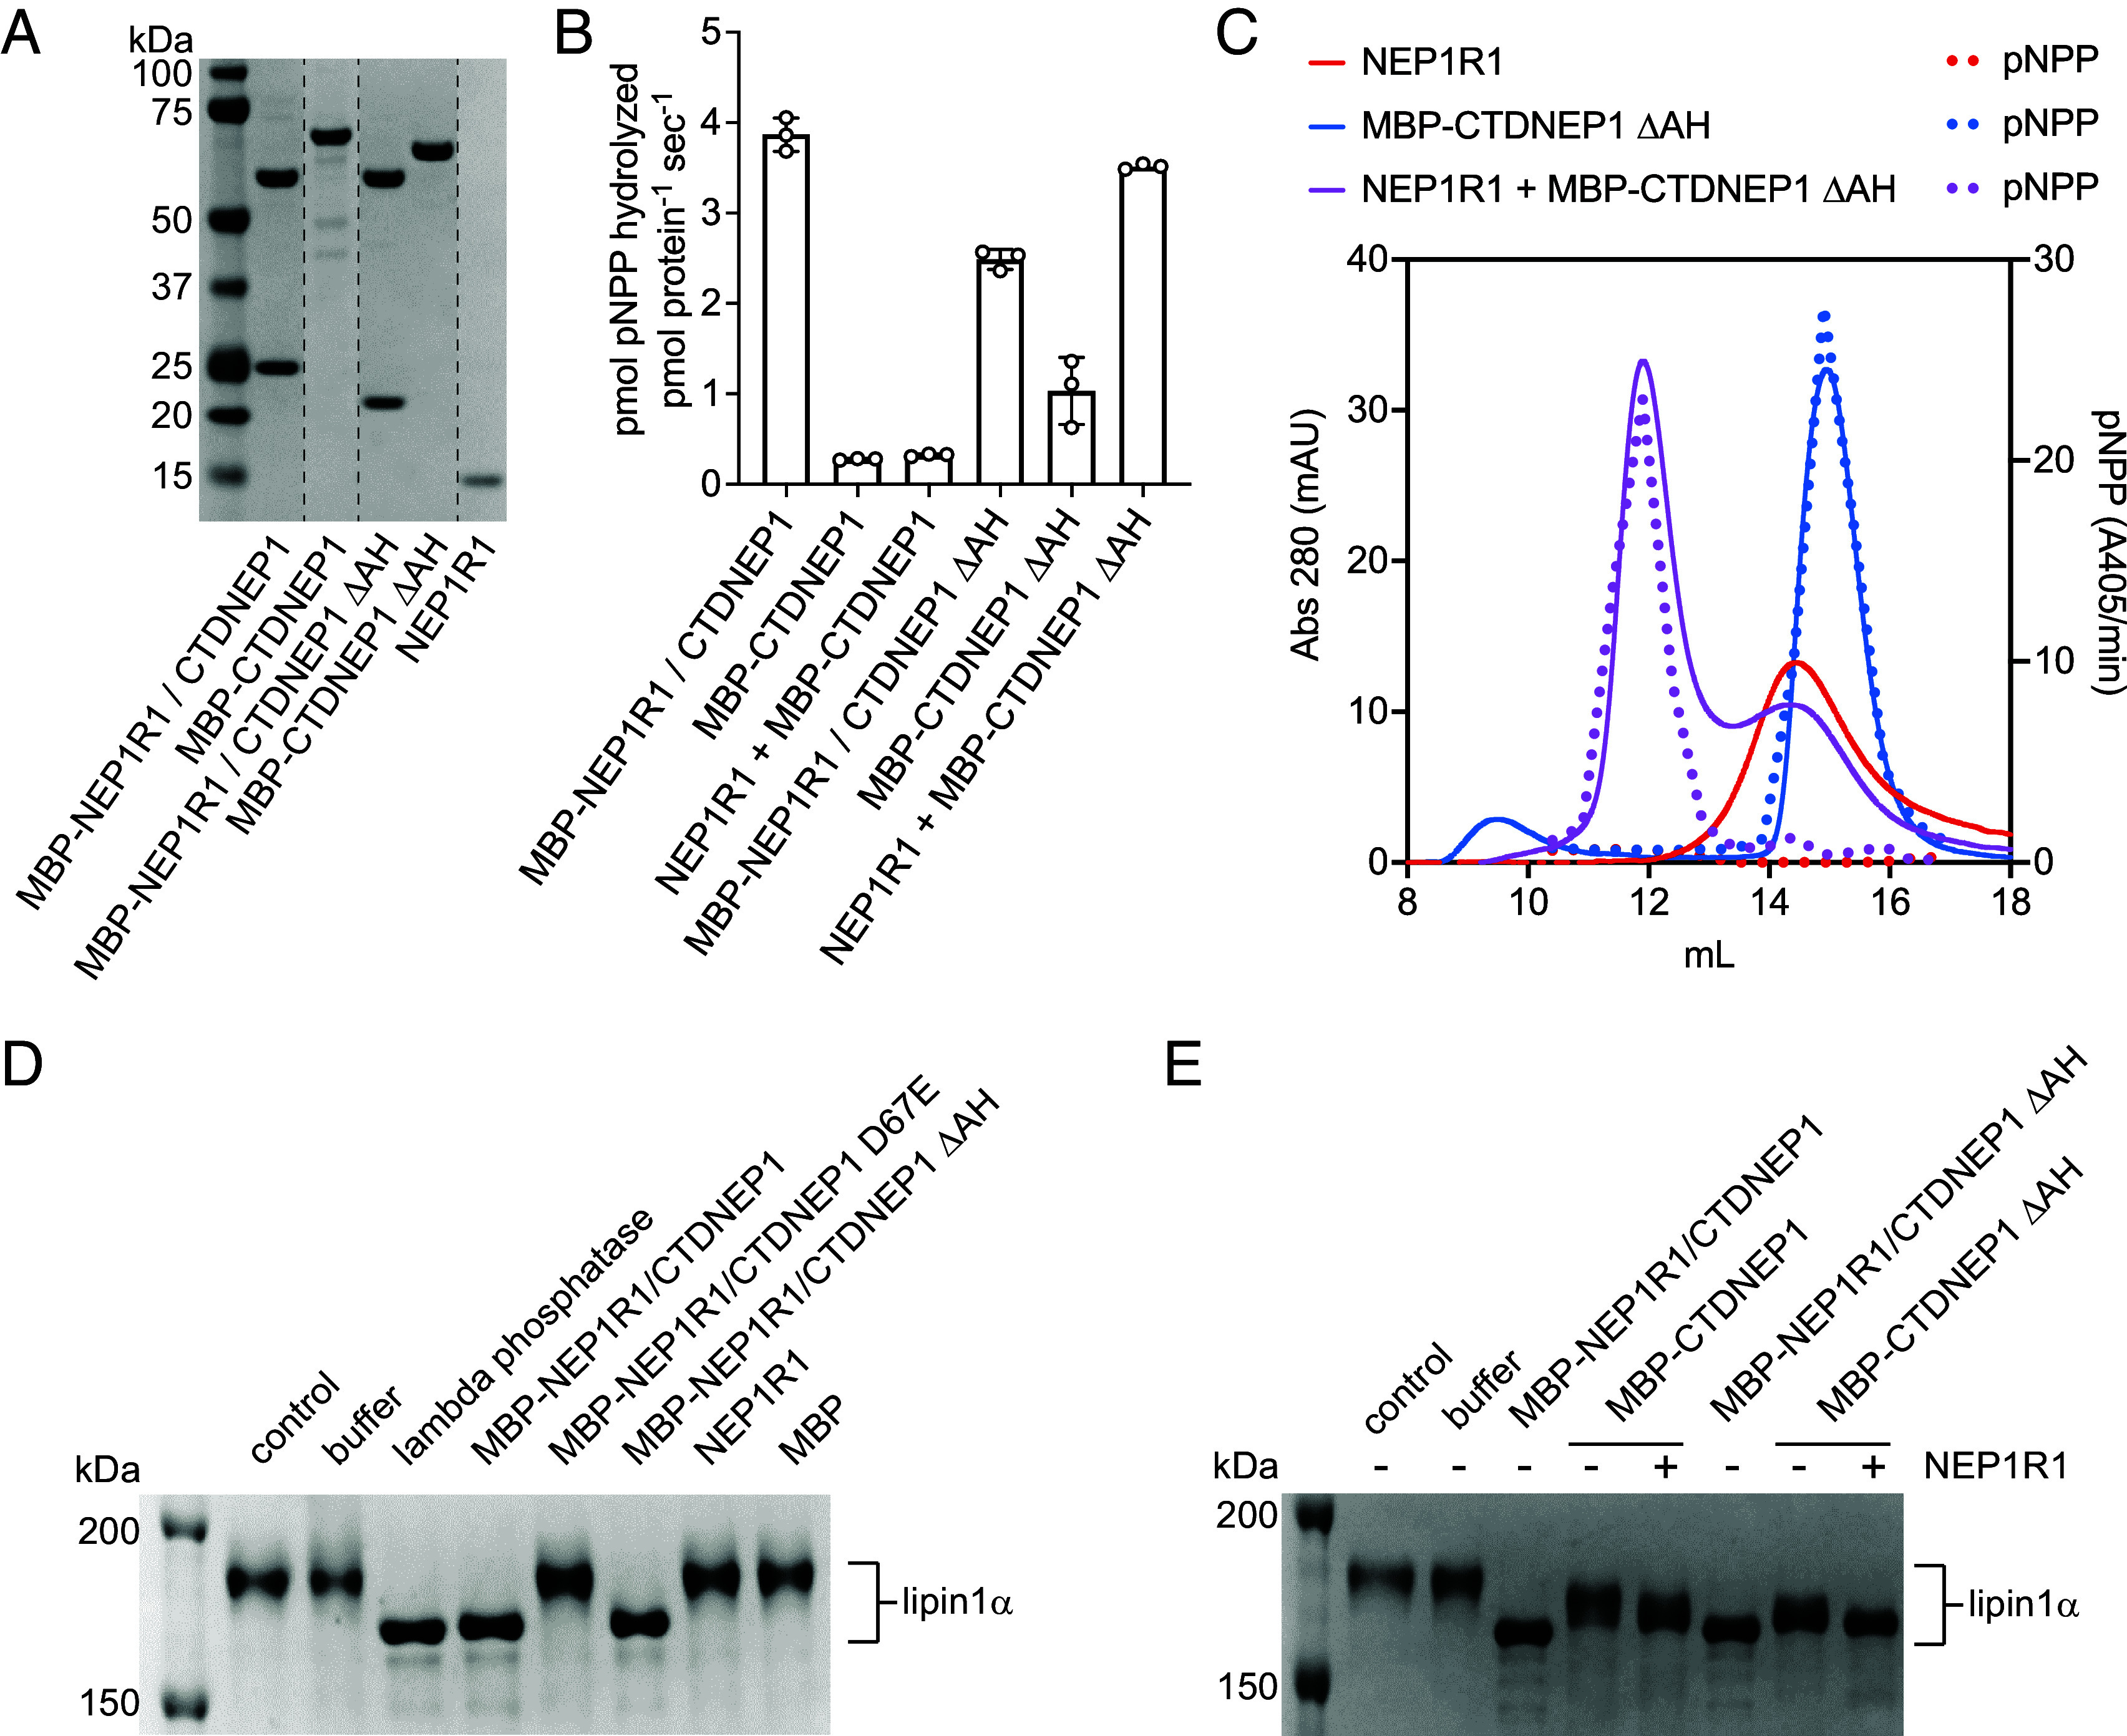
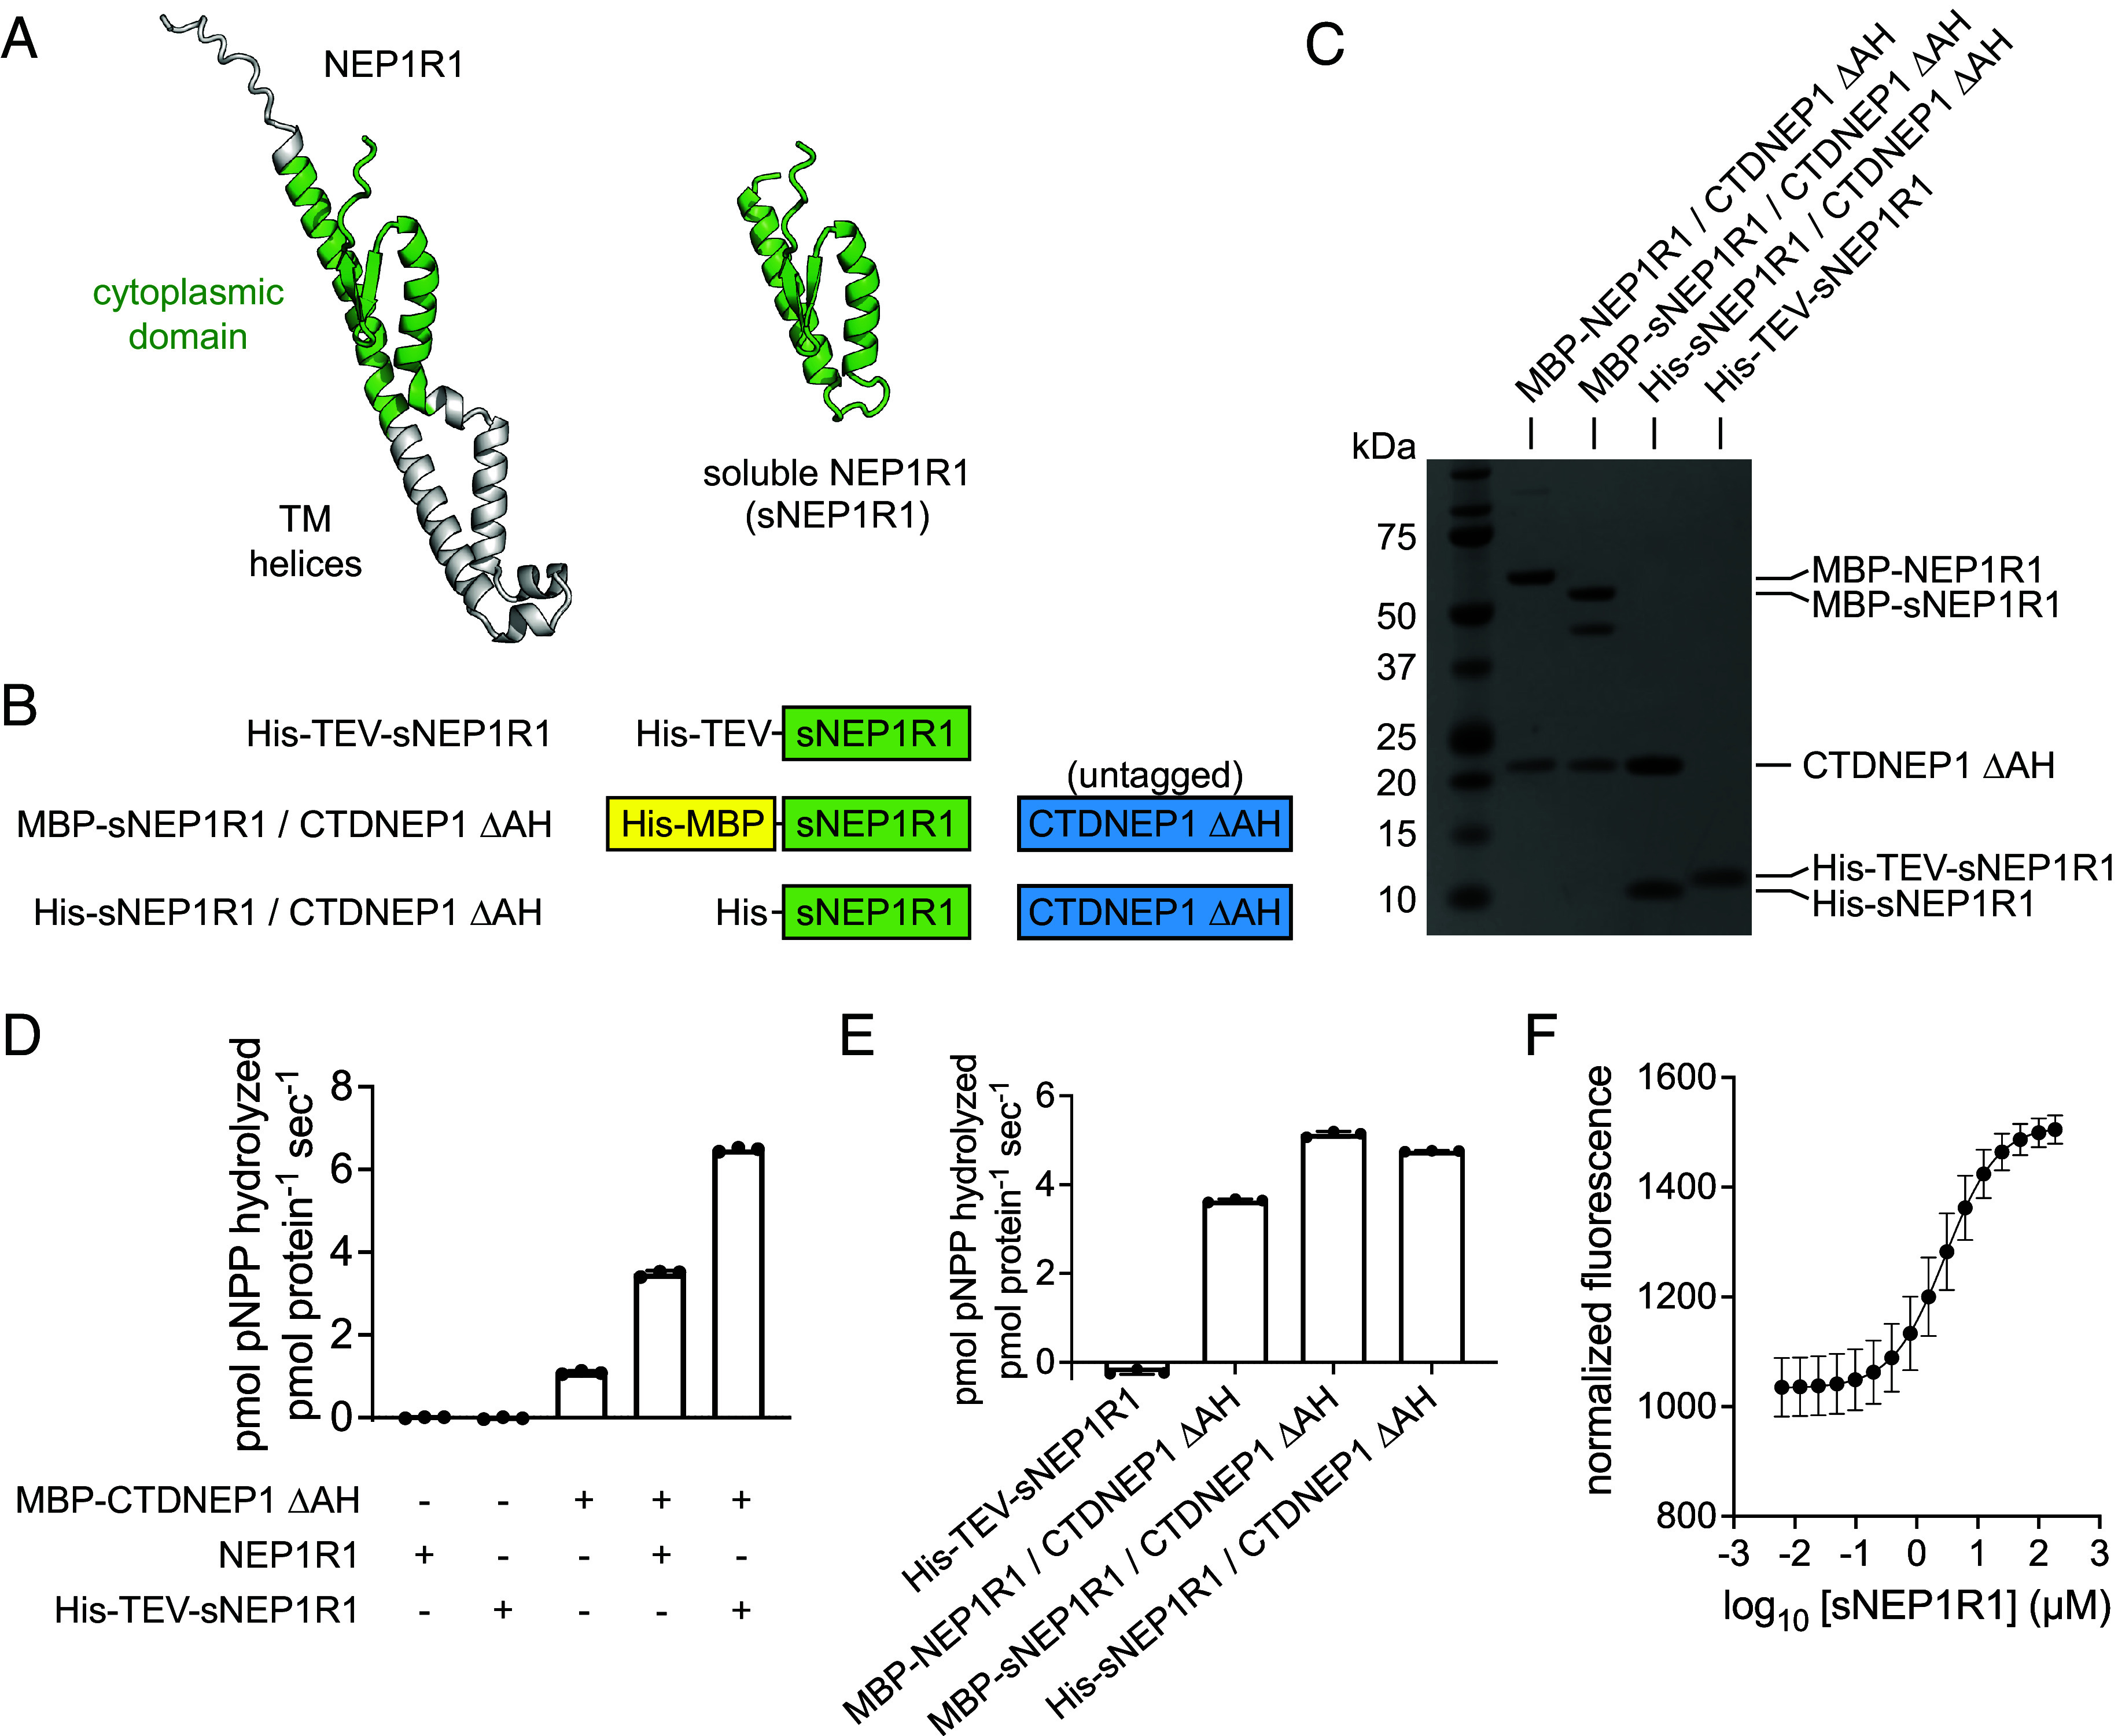
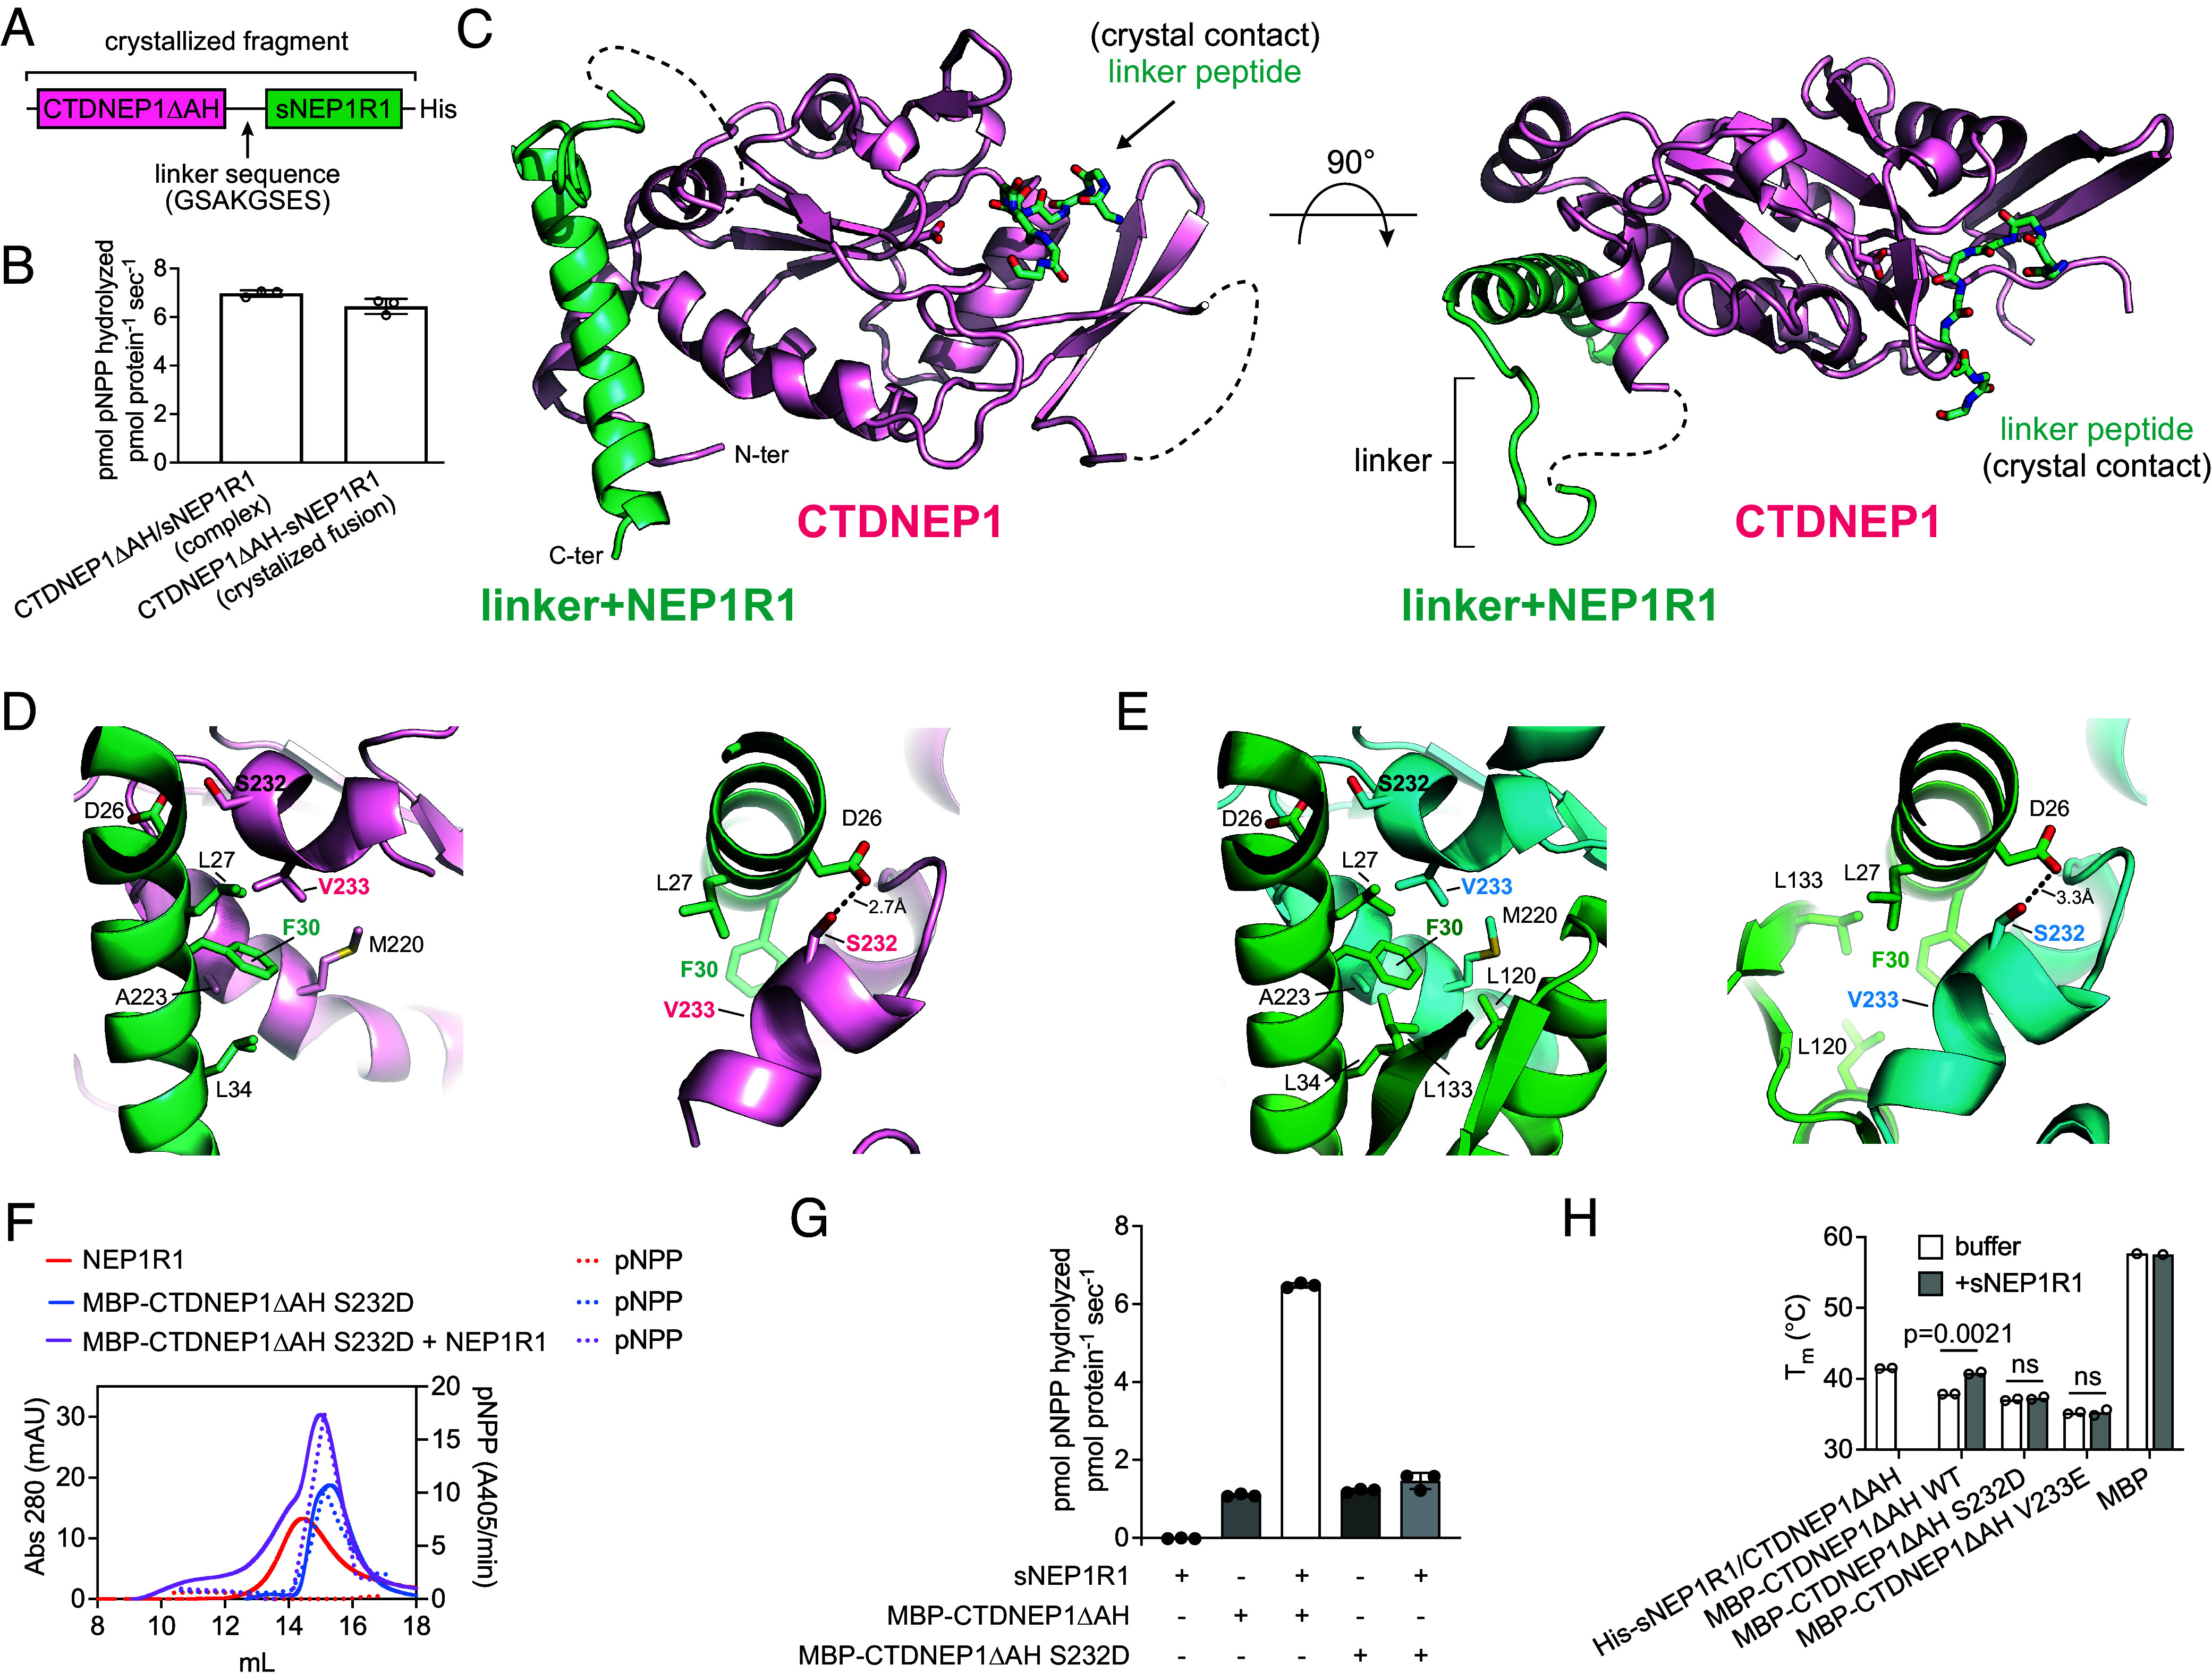
C-terminal Domain Nuclear Envelope Phosphatase 1 (CTDNEP1) is a noncanonical protein serine/threonine phosphatase that has a conserved role in regulating ER membrane biogenesis. Inactivating mutations in CTDNEP1 correlate with the development of medulloblastoma, an aggressive childhood cancer. The transmembrane protein Nuclear Envelope Phosphatase 1 Regulatory Subunit 1 (NEP1R1) binds CTDNEP1, but the molecular details by which NEP1R1 regulates CTDNEP1 function are unclear. Here, we find that knockdown of NEP1R1 generates identical phenotypes to reported loss of CTDNEP1 in mammalian cells, establishing CTDNEP1-NEP1R1 as an evolutionarily conserved membrane protein phosphatase complex that restricts ER expansion. Mechanistically, NEP1R1 acts as an activating regulatory subunit that directly binds and increases the phosphatase activity of CTDNEP1. By defining a minimal NEP1R1 domain sufficient to activate CTDNEP1, we determine high-resolution crystal structures of the CTDNEP1-NEP1R1 complex bound to a peptide sequence acting as a pseudosubstrate. Structurally, NEP1R1 engages CTDNEP1 at a site distant from the active site to stabilize and allosterically activate CTDNEP1. Substrate recognition is facilitated by a conserved Arg residue in CTDNEP1 that binds and orients the substrate peptide in the active site. Together, this reveals mechanisms for how NEP1R1 regulates CTDNEP1 and explains how cancer-associated mutations inactivate CTDNEP1.


Conflict of interest statement

Competing interests statement:The authors declare no competing interest.

Figures

Fig. 1.
Fig. 1.
Interdependency of CTDNEP1 and NEP1R1 protein stability and function in U2OS cells. (A) Immunoblot of whole cell lysates from U2OS CTDNEP1KO cells stably expressing CTDNEP1–HA and Flag-NEP1R1, siRNA treated as indicated, (N = 2 independent experiments). CTDNEP1–HA appears as a doublet, with both bands specific for CTDNEP1–HA (11, 15). (B) Representative spinning disk confocal images of U2OS cells under the indicated siRNA conditions, immunostained with anti-calnexin. (scale bars, 10 μm.) (C) Plot, % of cells with expanded ER under indicated siRNA conditions from Fig. 1B. Bars indicate mean ± SDs (N = 3, independent experimental repeats as shown by colored dots, n indicates the number of cells quantified). P-values were determined by an unpaired t test.
Fig. 2.
Fig. 2.
NEP1R1 forms an active phosphatase complex with CTDNEP1. (A) Domain architecture of purified CTDNEP1 and NEP1R1 proteins. MBP, maltose binding protein; His, His-tag. CTDNEP1 required fusion with MBP for purification unless coexpressed with NEP1R1. (B) SDS-PAGE analysis of purified CTDNEP1 and NEP1R1 proteins using Coomassie blue stain. (C) Quantification of pNPP hydrolysis by CTDNEP1 alone or in complex with NEP1R1. The D67E active site point mutant eliminated activity. Error bars represent SD (n = 3). (D) Effect of metal ions (10 mM) on MBP-NEP1R1/CTDNEP1 complex activity using pNPP as a substrate. Error bars represent SD (n = 3). (E) The activity of the MBP-NEP1R1/CTDNEP1 complex toward pNPP depends on magnesium concentration. Error bars represent SD (n = 3).
Fig. 3.
Fig. 3.
An N-terminal AH mediates CTDNEP1 membrane recruitment. (A) AlphaFold2 predicts human CTDNEP1 to form a globular catalytic domain from the HAD phosphatase family with an N-terminal AH. The predicted CTDNEP1 structure is shown in cartoon form with rainbow coloring (Left) from the N-terminal (blue) to C-terminal (red), or by hydrophobicity (Right) with hydrophobic residues in red and hydrophilic residues in white. The Inset depicts the sidechains of the N-terminal AH. (B) Helical wheel diagram of the CTDNEP1 N-terminal AH with bulky and small hydrophobic residues in yellow and gray, polar residues in purple or magenta, and positively charged residues in blue. The N- and C-termini positions are indicated. (C) Domain architecture of purified MBP-CTDNEP1 fusion proteins with and without the N-terminal AH. (D) SDS-PAGE analysis of liposome cosedimentation assays reveals CTDNEP1 strongly associates with membranes irrespective of lipid composition. Deletion of the N-terminal AH in CTDNEP1 (MBP-CTDNEP1ΔAH) results in complete loss of membrane association. S, supernatant; P, pellet; PC, phosphatidylcholine; PE, phosphatidylethanolamine; PA, phosphatidic acid; MBP, maltose binding protein. (E) Quantification of liposome association for MBP-CTDNEP1 WT and ΔAH. Error bars represent SD (n = 3).
Fig. 4.
Fig. 4.
NEP1R1 binds and enhances the activity of CTDNEP1. (A) SDS-PAGE analysis of purified CTDNEP1 and NEP1R1 proteins stained with Coomassie blue. (B) Quantification of pNPP hydrolysis by MBP-CTDNEP1 alone, CTDNEP1 copurified with NEP1R1 (MBP-NEP1R1/CTDNEP1), or with purified NEP1R1 added separately to MBP-CTDNEP1 (NEP1R1 + MBP-CTDNEP1 at 2:1 molar ratio). ΔAH indicates deletion of the CTDNEP1 N-terminal AH. Error bars represent SD (n = 3). (C) Size-exclusion profiles (solid lines) and quantification pNPP activity (dotted lines) of MBP-CTDNEP1ΔAH (blue traces) and NEP1R1 (red traces) alone, or a mixture of MBP-CTDNEP1ΔAH+NEP1R1 (purple traces) with NEP1R1 protein in 4x molar excess. The addition of NEP1R1 shifts both the elution profile and the fractions capable of hydrolyzing pNPP to a higher apparent molecular weight indicating complex formation between NEP1R1 and CTDNEP1. (D) Dephosphorylation by the NEP1R1-CTDNEP1 complex changes the migration of lipin 1α on phos-tag SDS-PAGE. (E) Phos-tag SDS-PAGE analysis of the effects of NEP1R1 on CTDNEP1–mediated dephosphorylation of lipin 1α.
Fig. 5.
Fig. 5.
A soluble minimal cytoplasmic domain of NEP1R1 is sufficient to bind and activate CTDNEP1. (A) Cartoon representation of the predicted NEP1R1 structure with the cytoplasmic soluble domain in green. Removal of the TM helices and disordered N-terminus (gray) generates a soluble version of NEP1R1 (sNEP1R1). (B) Domain architectures of His-sNEP1R1, the MBP-sNEP1R1/CTDNEP1ΔAH complex, and the His-sNEP1R1/CTDNEP1ΔAH complex. (C) SDS-PAGE analysis of purified sNEP1R1 and the sNEP1R1/CTDNEP1ΔAH complexes using Coomassie blue stain. (D) Quantification of pNPP hydrolysis by MBP-CTDNEP1ΔAH alone, or with purified NEP1R1 (MBP-CTDNEP1ΔAH + NEP1R1 at 1:2 molar ratio) or sNEP1R1 (MBP-CTDNEP1ΔAH + His-TEV-sNEP1R1 at 1:2 molar ratio) added separately. Error bars represent SD (n = 3). (E) Quantification of pNPP hydrolysis by CTDNEP1ΔAH copurified with either NEP1R1 (MBP-NEP1R1/CTDNEP1ΔAH) or sNEP1R1 (MBP-sNEP1R1/CTDNEP1ΔAH or His-sNEP1R1/CTDNEP1ΔAH). Error bars represent SD (n = 3). (F) Microscale thermophoresis indicates a dissociation constant (Kd) of 2.9 μM between a msfGFP-fusion of MBP-CTDNEP1ΔAH and His-TEV-sNEP1R1. Error bars represent SD (n = 4).
Fig. 6.
Fig. 6.
Crystal structure of the human CTDNEP1–NEP1R1 phosphatase complex. (A) Domain architecture of the crystallized CTDNEP1ΔAH–sNEP1R1 fusion with linker sequence. (B) Quantification of pNPP hydrolysis by CTDNEP1ΔAH /sNEP1R1 copurified complex and the CTDNEP1ΔAH–sNEP1R1 fusion. Error bars represent SD (n = 3). (C) Overall structure of the CTDNEP1–NEP1R1 phosphatase complex. A linker peptide occupies the active site of the CTDNEP1 catalytic subunit. NEP1R1 forms an extended helix that packs against the opposite side of the CTDNEP1 active site. (D and E) Interactions between NEP1R1 and CTDNEP1 (D) observed in the crystal structure and (E) predicted by AlphaFold multimer. (F) Size-exclusion profiles (solid lines) and quantification pNPP activity (dotted lines) of MBP-CTDNEP1ΔAHS232D (blue traces), NEP1R1 (red traces), and a mixture of CTDNEP1ΔAHS232D+NEP1R1 (purple traces). (G) Quantification of pNPP hydrolysis by MBP-CTDNEP1ΔAH WT and S232D with and without sNEP1R1. Error bars represent SD (n = 3). (H) Melting temperatures (Tm’s) of the His-sNEP1R1/CTDNEP1ΔAH complex in comparison to WT, S232D, and V233E MBP-CTDNEP1ΔAH with and without sNEP1R1. sNEP1R1 increases the stability of MBP-CTDNEP1ΔAH but not the point mutants S232D and V233E that disrupt the complex. P-values were determined by an unpaired t test. (n = 2, or n = 1 for MBP alone).
Fig. 7.
Fig. 7.
Peptide recognition by CTDNEP1. (A) Model of the linker peptide bound in the CTDNEP1 active site with the 2Fo-2Fc electron density map contoured at 1σ. (B) CTDNEP1 residues involved in binding the linker peptide. Intermolecular hydrogen bonds between the conserved Arginine residue and the carbonyl groups of the linker peptide are shown as black dotted lines. (C) Scp1 residues involved in binding a phospho-peptide. Intermolecular hydrogen bonds between the conserved Arginine residue and the carbonyl groups of the phosphor-peptide are shown as black dotted lines. (D) Superimposition of the CTDNEP1 and Scp1 structures with bound peptides. (E) Quantification of pNPP hydrolysis by MBP-CTDNEP1ΔAH WT, E70S, and R158A. Error bars represent SD (n = 3). (F) Phos-tag SDS-PAGE analysis of dephosphorylation of mouse lipin 1α after treatment with purified MBP-CTDNEP1ΔAH WT, E70S, and R158A proteins.

Update of

Similar articles

Cited by

References

    1. Fagone P., Jackowski S., Membrane phospholipid synthesis and endoplasmic reticulum function. J. Lipid Res. 50, S311–S316 (2009). - PMC - PubMed
    1. Han G.-S., Wu W.-I., Carman G. M., The Saccharomyces cerevisiae Lipin homolog is a Mg2+-dependent phosphatidate phosphatase enzyme J. Biol. Chem. 281, 9210–9218 (2006). - PMC - PubMed
    1. Harris T. E., et al. , Insulin controls subcellular localization and multisite phosphorylation of the phosphatidic acid phosphatase, lipin 1. J. Biol. Chem. 282, 277–286 (2007). - PubMed
    1. Huffman T. A., Mothe-Satney I., Lawrence J. C., Insulin-stimulated phosphorylation of lipin mediated by the mammalian target of rapamycin. Proc. Natl. Acad. Sci. U.S.A. 99, 1047–1052 (2002). - PMC - PubMed
    1. Péterfy M., Harris T. E., Fujita N., Reue K., Insulin-stimulated interaction with 14-3-3 promotes cytoplasmic localization of lipin-1 in adipocytes. J. Biol. Chem. 285, 3857–3864 (2010). - PMC - PubMed

MeSH terms

LinkOut - more resources