. 2024 May 22;16(748):eadk1358.
doi: 10.1126/scitranslmed.adk1358. Epub 2024 May 22.

Gain-of-function mutations of TRPV4 acting in endothelial cells drive blood-CNS barrier breakdown and motor neuron degeneration in mice

Affiliations

Gain-of-function mutations of TRPV4 acting in endothelial cells drive blood-CNS barrier breakdown and motor neuron degeneration in mice

Jeremy M Sullivan et al. Sci Transl Med. .

Abstract

Blood-CNS barrier disruption is a hallmark of numerous neurological disorders, yet whether barrier breakdown is sufficient to trigger neurodegenerative disease remains unresolved. Therapeutic strategies to mitigate barrier hyperpermeability are also limited. Dominant missense mutations of the cation channel transient receptor potential vanilloid 4 (TRPV4) cause forms of hereditary motor neuron disease. To gain insights into the cellular basis of these disorders, we generated knock-in mouse models of TRPV4 channelopathy by introducing two disease-causing mutations (R269C and R232C) into the endogenous mouse Trpv4 gene. TRPV4 mutant mice exhibited weakness, early lethality, and regional motor neuron loss. Genetic deletion of the mutant Trpv4 allele from endothelial cells (but not neurons, glia, or muscle) rescued these phenotypes. Symptomatic mutant mice exhibited focal disruptions of blood-spinal cord barrier (BSCB) integrity, associated with a gain of function of mutant TRPV4 channel activity in neural vascular endothelial cells (NVECs) and alterations of NVEC tight junction structure. Systemic administration of a TRPV4-specific antagonist abrogated channel-mediated BSCB impairments and provided a marked phenotypic rescue of symptomatic mutant mice. Together, our findings show that mutant TRPV4 channels can drive motor neuron degeneration in a non-cell autonomous manner by precipitating focal breakdown of the BSCB. Further, these data highlight the reversibility of TRPV4-mediated BSCB impairments and identify a potential therapeutic strategy for patients with TRPV4 mutations.


Figures

Fig. 1.
Fig. 1.. Trpv4R269C/R269C mice exhibit marked neurological phenotypes.
(A) Representative photographs of a symptomatic phase Trpv4R269C/R269C mouse (Stage B) exhibiting asymmetric forelimb paralysis (red arrow and red arrowheads) and an inability to maintain upright head posture (white arrowheads). (B, C) Forelimb hang test motor performance (B) and survival curve (C) of Trpv4R269C/R269C, Trpv4R269C/+, and Trpv4WT mice (B, n=22–43 mice/genotype; C, n=50–101 mice/genotype). Hang impulse (N.s) reflects the force exerted by the mouse to oppose gravity. (D) Confocal images of the C1 spinal cord ventral horn of Trpv4WT and symptomatic phase Trpv4R269C/R269C (Stage C) mice. The dashed white lines indicate the grey matter boundary. Scale bar = 100 μm. Unmerged images are shown in fig. S3. (E, F) Mean number of MNs per C1 spinal cord hemisection, based on assessments of the mean number per mouse (E; n=3 mice/genotype) and per hemisection (F; n=30 hemisections/genotype). All Trpv4R269C/R269C mice were in symptomatic phase Stage C. (G) Percent of C1 spinal cord hemisections exhibiting signs of MN proximal axon pathology (axonal swelling and fragmentation; see also fig. S3; n=3 mice/genotype). Trpv4R269C/R269C mice were in symptomatic phase Stage C. (H, I) Confocal images (H) and quantification (I) of NMJ denervation (arrows in H) in the semispinalis capitis muscle, a neck muscle innervated by MNs at the C1–3 spinal cord levels (n=3 mice/genotype, >1000 NMJs analyzed per animal). Scale bars = 25 μm. (J-L) Assessments of MN numbers (J, K) and proximal axon pathology (L) in C1 spinal cord sections of symptomatic phase Trpv4R269C/R269C mice at Stage B. Shown are the mean number of MNs per C1 spinal cord hemisection, based on assessments of the mean number per mouse (J, n=3–4 mice/genotype) and per hemisection (K, n=30–50 hemisections/genotype), and the percent of C1 spinal cord hemisections exhibiting signs of MN proximal axon pathology (L, n=3–4 mice/genotype). (M) Quantification of monosynaptic sensory-motor reflex (MSR) amplitude at the C2, C3, and C7-C8 spinal cord levels of Trpv4R269C/R269C mice at Stage B (n=3–6 mice/genotype). BTX, α-bungarotoxin, C1–3, cervical spinal cord levels 1–3, NF, neurofilament-H. Plots show mean ± SEM; (E, F, I, J, K) unpaired two-sided t-test, (G, L) unpaired two-sided t-test with Welch’s correction, (M) two-way ANOVA, Tukey’s multiple comparison test; ns, not significant, *P ≤ 0.05, **P < 0.01, ***P < 0.001.
Fig. 2.
Fig. 2.. Genetic deletion of mutant TRPV4 from endothelial cells rescues Trpv4R269C/R269C mice.
(A) Survival curves of Trpv4R269C/R269C and Trpv4R269C/R269C; Cdh5Cre littermate mice. (B) Survival curves of Trpv4R269C/R269C and Trpv4R269C/R269C; Tie2Cre littermate mice. (C, D) Motor performance of Trpv4R269C/R269C mice expressing Cdh5Cre in the horizontal balance test (C; n=10–25 mice/genotype) and accelerating rotarod assay (D; mice aged 2–6 months, n=12–20 mice/genotype). (E) Mean number of MNs per C1 spinal cord hemisection in Trpv4R269C/R269C mice expressing Cdh5Cre or Tie2Cre (n=3 mice/genotype; n=30 hemisections/genotype). Statistical comparisons are to WT mice (dashed horizontal line, from Fig. 1E). (F, G) RT-qPCR analysis demonstrating knockdown of Trpv4 transcript in the isolated forebrain vasculature of Trpv4R269C/R269C mice with endothelial cell-specific Cre expression (F, +Cdh5Cre; G, +Tie2Cre; n=3 mice/genotype). (H, I) Representative confocal images showing the expression of the tdTomato reporter in NVECs (arrows) in C1 spinal cord, including within the ventral horn (I). Unmerged images are shown in fig. S9. Scale bars = 200 μm (H, I left), 50 μm (I right). (J) Quantification of the cell types in C1 spinal cord containing tdTomato reporter signal. DH, dorsal horn; VH, ventral horn. Plots show mean ± SEM; (D, E) one-way ANOVA, (F, G) unpaired two-sided t-test, (J) one-way ANOVA, Dunnett’s multiple comparison test; ns, not significant, ***P < 0.001. ****P < 0.0001.
Fig. 3.
Fig. 3.. Mutant TRPV4 channels in NVECs exhibit a gain-of-function in channel activity.
(A) Representative immunofluorescence staining for CD31 (left) and Claudin-5 (right) in NVECs cultured from the brainstem and cervical spinal cord. White arrows indicate junctional complexes between adjacent cells. Scale bar = 50 μm. (B) Epifluorescence image of cultured NVECs showing GFP expression from the Tie2-GFP allele. Scale bar = 20 μm. (C) Shown are changes in the Fura-2 ratio (emission at 340/380 nm), an indicator of alterations in cytosolic free calcium (Ca2+), evoked by application of the TRPV4-specific agonist GSK101 to NVECs isolated from Trpv4WT, Trpv4R269C/R269C, and Trpv4−/− mice (n=112–172 cells/genotype, n=4 NVEC isolations for Trpv4WT and Trpv4R269C/R269C, n=2 isolations for Trpv4−/−). (D) Magnitude of the calcium responses for the same NVEC genotypes as in C. Changes in cytosolic free calcium (ΔCa2+) following GSK101 application were calculated by subtracting the basal Fura-2 ratio (mean over 175 seconds immediately pre-GSK101 application) for each cell from the maximum value recorded over 1160 seconds post-GSK101 application. (E) Calcium response latency for cultured NVECs from Trpv4WT and Trpv4R269C/R269C mice. (F) Representative current-voltage relationship of whole-cell TRPV4 currents in response to a voltage ramp (see inset) recorded from cultured Trpv4WT and Trpv4R269C/R269C NVECs in the presence of GSK101 (5 μM) and after perfusion of the TRPV4-specific antagonist GSK219 (6.67 μM). (G) Quantification of current density in whole-cell patch clamp recordings from cultured Trpv4WT and Trpv4R269C/R269C NVECs following application of GSK101 (5 μM) (n= 9–10 cells/genotype, n=3 NVEC isolations for Trpv4WT and Trpv4R269C/R269C). (H) (left) Illustration of setup for TEER measurements (Ω cm2) across confluent monolayers of cultured NVECs from Trpv4R269C/R269C and Trpv4WT mice. (center, right) Normalized TEER at 20 and 30 minutes following application of GSK101 (at 0 mins), (I) Normalized TEER at 24 hrs post-agonist application. Measurements collected following GSK101 application were first normalized to baseline TEER, to assess fold changes, and then normalized to the mean TEER of vehicle-treated wells of the same genotype/time point, to account for non-specific effects of drug addition (for example, mechanical disturbance) (n=3 NVEC isolations for Trpv4WT and Trpv4R269C/R269C). Plots show mean ± SEM; (D) Kruskal-Wallis test, Dunn’s multiple comparison test, (E) unpaired two-sided t-test with Welch’s correction, (G) unpaired two-sided t-test, (H, I) two-way ANOVA, Tukey’s multiple comparison test; ns, not significant, *P ≤ 0.05, ****P < 0.0001. The schematic of the TEER experiment (H, left) was created using BioRender.com.
Fig. 4.
Fig. 4.. Mutant TRPV4 expression disrupts BSCB integrity.
(A-D) Representative images of EZ-Biotin staining in cross sections of C1 spinal cord for Trpv4WT (A), Trpv4R269C/R269C (Stage B) (B), Trpv4R269C/R269C;Cdh5Cre (C), and Trpv4R269C/R269C;Tie2Cre (D) mice. The inset for B shows EZ-Biotin staining (red) adjacent to motor neuron somata (green). Scale bars = 400 μm (A-D), 50 μm (inset for B). (E) Quantification of normalized EZ-Biotin staining intensity in C1 spinal cord cross sections for the genotypes in A-D. Staining intensities (a.U.) were normalized to the mean for one of the Trpv4WT mice. (F) Quantification of EZ-Biotin staining intensity in the dorsal and ventral halves of C1 spinal cord of Trpv4R269C/R269C (Stage B) mice. (G, H) Quantification of fibrinogen (G) and mouse IgG (H) staining intensity in C1 spinal cord (n=3–7 mice/genotype, n=8–11 sections/mouse) for the genotypes in A-D. (I) Quantification of the vascular density of the C1 spinal cord ventral horn of presymptomatic Trpv4R269C/R269C mice at P15 (n=3 mice/genotype; n=7–10 hemisections/mouse) compared to Trpv4WT littermates. DH, dorsal horn, VH, ventral horn. Plots show mean ± SEM; (E, G, H) one-way ANOVA, Dunnett’s multiple comparison test, (F) paired two-sided t-test, (I) unpaired two-sided t-test; ns, not significant, *P ≤ 0.05 **P < 0.01.
Fig. 5.
Fig. 5.. Symptomatic TRPV4 mutant mice exhibit disruptions of NVEC tight junction complexes.
(A, B) Representative structured illumination microscopy images (A) and quantification (B) of the ratio of ZO-1 and CD31 staining area in cross sections of C1 spinal cord of Trpv4WT and Trpv4R269C/R269C (Stage B) mice (n=3–5 mice/genotype; n=9 sections/mouse). Analysis of symptomatic mutant mice was performed on vessels in which EZ-Biotin leak was either absent (- EZ-Biotin leak) or present (+ EZ-Biotin leak). Arrows indicate regions of ZO-1 loss. Scale bars = 50 μm. (C) Transmission electron microscopy images of upper cervical spinal cord NVECs revealed discontinuities (red arrowheads) of tight junction complexes (white arrowheads). Scale bars = 500 nm. (D) Quantification of the proportion of tight junction complexes exhibiting discontinuities (n=3 mice/genotype; n= 38–107 tight junction complexes/mouse). Plots show mean ± SEM; (B) one-way ANOVA, Tukey’s multiple comparison test, (D) unpaired two-sided t-test; ns, not significant, *P ≤ 0.05, ****P < 0.0001.
Fig. 6.
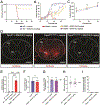
Fig. 6.. Systemic administration of a TRPV4-specific antagonist rescues symptomatic Trpv4R269C/R269C mice.
(A-C) Survival (A) and motor performance in the horizontal balance test (B; n=10–15 mice/genotype) and accelerating rotarod assay (C; n=7–14 mice/genotype) of GSK219- (Trpv4WT + 2 mg/kg GSK219, Trpv4R269C/R269C + 0.5 mg/kg GSK219, Trpv4R269C/R269C + 2 mg/kg GSK219) and vehicle-treated mice (Trpv4WT + vehicle, Trpv4R269C/R269C + vehicle). (D, E) Representative images (D) and quantification (E) of EZ-Biotin staining in C1 spinal cord of GSK219- and vehicle-treated mice (n=3 mice/cohort, n=5 sections/mouse; R269C + vehicle cohort, P20–22, other cohorts, P50–60). Scale bars = 400 μm. (F) Quantification of the ratio of ZO-1 and CD31 staining area in C1 spinal cord of GSK219-treated Trpv4R269C/R269C and age-matched Trpv4WT mice (n=3 mice/genotype). (G-I) Assessments of MN numbers (G, H) and proximal axon pathology (I) in C1 spinal cord sections of GSK219- and vehicle-treated mice. Shown are the mean number of MNs per C1 spinal cord hemisection, based on assessments of the mean number per mouse (G, n=3 mice/cohort) and per hemisection (H, n= 8–16 hemisections/mouse), and the percent of C1 spinal cord hemisections exhibiting signs of MN proximal axon pathology (I, n=3 mice/cohort; 8–16 hemisections/mouse). Statistical comparisons are to WT mice (dashed horizontal line). DH, dorsal horn; VH, ventral horn. (D). Plots show mean ± SEM; (C) two-way ANOVA, (E, G-H) one-way ANOVA, Dunnett’s multiple comparison test, (F) unpaired two-sided t-test; ns, not significant, ****P < 0.0001.

References

    1. Sweeney MD, Kisler K, Montagne A, Toga AW, Zlokovic BV, The role of brain vasculature in neurodegenerative disorders. Nat. Neurosci. 21, 1318–1331 (2018). - PMC - PubMed
    1. Liebner S. et al., Functional morphology of the blood-brain barrier in health and disease. Acta Neuropathol. 135, 311–336 (2018). - PMC - PubMed
    1. Profaci CP, Munji RN, Pulido RS, Daneman R, The blood-brain barrier in health and disease: Important unanswered questions. J. Exp. Med. 217, e20190062 (2020). - PMC - PubMed
    1. Echeverry S, Shi XQ, Rivest S, Zhang J, Peripheral nerve injury alters blood-spinal cord barrier functional and molecular integrity through a selective inflammatory pathway. J. Neurosci. 31, 10819–10828 (2011). - PMC - PubMed
    1. Landouré G. et al., Mutations in TRPV4 cause Charcot-Marie-Tooth disease type 2C. Nat. Genet. 42, 170–174 (2010). - PMC - PubMed

Publication types

LinkOut - more resources