. 2024 May 3;41(5):msae096.
doi: 10.1093/molbev/msae096.

Dating Ammonia-Oxidizing Bacteria with Abundant Eukaryotic Fossils

Affiliations

Dating Ammonia-Oxidizing Bacteria with Abundant Eukaryotic Fossils

Tianhua Liao et al. Mol Biol Evol. .

Abstract

Evolution of a complete nitrogen (N) cycle relies on the onset of ammonia oxidation, which aerobically converts ammonia to nitrogen oxides. However, accurate estimation of the antiquity of ammonia-oxidizing bacteria (AOB) remains challenging because AOB-specific fossils are absent and bacterial fossils amenable to calibrate molecular clocks are rare. Leveraging the ancient endosymbiosis of mitochondria and plastid, as well as using state-of-the-art Bayesian sequential dating approach, we obtained a timeline of AOB evolution calibrated largely by eukaryotic fossils. We show that the first AOB evolved in marine Gammaproteobacteria (Gamma-AOB) and emerged between 2.1 and 1.9 billion years ago (Ga), thus postdating the Great Oxidation Event (GOE; 2.4 to 2.32 Ga). To reconcile the sedimentary N isotopic signatures of ammonia oxidation occurring near the GOE, we propose that ammonia oxidation likely occurred at the common ancestor of Gamma-AOB and Gammaproteobacterial methanotrophs, or the actinobacterial/verrucomicrobial methanotrophs which are known to have ammonia oxidation activities. It is also likely that nitrite was transported from the terrestrial habitats where ammonia oxidation by archaea took place. Further, we show that the Gamma-AOB predated the anaerobic ammonia-oxidizing (anammox) bacteria, implying that the emergence of anammox was constrained by the availability of dedicated ammonia oxidizers which produce nitrite to fuel anammox. Our work supports a new hypothesis that N redox cycle involving nitrogen oxides evolved rather late in the ocean.

Keywords: Great Oxidation Event; ammonia-oxidizing bacteria; molecular clock.


Conflict of interest statement

Conflict of Interest The authors declare that they have no conflict of interest.

Figures

Fig. 1.
Fig. 1.
The xmo gene phylogeny, the xmo-containing genome phylogeny, and the fossil constraints used to calibrate AOB and CAOB evolution. a) The phylogenomic tree of 848 xmoA-containing microbes. The phylogenomic tree was constructed using Phylophlan (see supplementary text section S2.3, Supplementary Material online), followed by the outgroup-independent minimum variance (MV) rooting. From inner to outer, the first two rings show the presence of the genes cycAB. In the third ring, the color strip represents the major taxonomic lineages derived from the NCBI taxonomy. The remaining six outer rings show the inferred types of XMO according to the concatenated xmoCAB gene tree (Fig. 1b). The clades with red branches represent the AOB and CAOB lineages determined based on the presence of cycAB and amoCAB. b) The concatenated xmoCAB gene tree was generated using a total of 964 xmoCAB genes, including 922 identified xmoCAB operons and 42 reference sequences (Datasets S1.2 & S1.3) at the amino acid level by IQ-Tree (v1.6.12). The gene tree was rooted with the bmoCAB lineage following Khadka et al. (2018). The branches inferred as AOB/CAOB were highlighted in red. From the inner to the outer ring, the first color strip indicates the taxonomic affiliation of the concatenated xmoCAB. The circles arranged as two rings represent the presence of the auxiliary genes, cycAB, which encode the necessary electron carriers for ammonia oxidation and should be present in the ammonia oxidizers. The outmost ring composed of triangles corresponds to the reference sequences encoding XMO for distinct substrates. c) The xmoA tree was constructed based on the amino acid sequences of xmoA homologs obtained from amplicon sequencing and genome sequencing (see supplementary text section S2.1, Supplementary Material online). The phylogeny was rooted at the xmoA sequences from the archaeal lineages, including Cenarchaeum, Candidatus Nitrosopumilus, and Candidatus Nitrosothermus. From the inner to the outer ring, two shaded regions represent the lineages inferred as the amoCAB from AOB/CAOB. The first ring represents the type of the sequence, either amplicon or genome sequence. The next ring composed of triangle corresponds to the reference sequences (see supplementary text section S1.1, Supplementary Material online) encoding XMO for distinct substrates. The reference sequences are used to indicate the lineage of XMO with specific substrates. The outermost ring shows the taxonomic affiliation of the tip nodes from genome sequence. Calibration nodes for molecular dating analyses using strategies “Mito24” (d), “Gomez19” (e), “Plastid39” (f), and “Battistuzzi25” (g). The eukaryotic topologies (d, e, and f) were pruned from the topologies provided by the previous studies (see supplementary text section S3.3, Supplementary Material online), and the bacterial topology (g) was pruned from the tree constructed based on the selected 106 genomes (see supplementary text section S2.4, Supplementary Material online). The internal nodes with yellow circles represent the calibration nodes (Datasets S2.1 and S2.2).
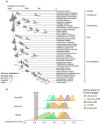
Fig. 2.
Fig. 2.
The posterior ages derived from the two-step sequential dating analysis. a) The posterior ages of the eukaryotic nodes derived from the first-step dating analysis. The posterior ages shown in the density plots at each node were estimated based on 320 orthologs and 12 calibrations (see supplementary text section S3.5, Supplementary Material online). The nodes with circles and red calibration node names (XN1 to XN4, PN1 to PN3, and AN1 to AN5) are those with fossil-based calibrations and are those used as calibrations in the second-step dating analysis that includes both eukaryotic and bacterial lineages. The left right panel suggested the used calibrations for each gene set. b) The posterior ages of five focal lineages derived from the second-step dating analysis. Five focal lineages include Gamma-AOB, Beta-AOB, CAOB, Anammox, and eukaryote. The estimation of posterior ages utilizing the 12 best-fit distributions (nodes with circles) that were derived from the first-step dating analysis and employed as priors (see supplementary text section S3.5, Supplementary Material online). Additionally, the bacterial calibration set B1 was utilized in this process (Dataset S2.1). Three gene sets (Gomez19, Mito24, and Plastid39) and corresponding topologies with eukaryotic genomes as mentioned above (Fig. 1) were employed. The dashed line within each density plot represents the mean value of each distribution. The full timetrees are shown in supplementary fig. S3, Supplementary Material online.
Fig. 3.
Fig. 3.
The impact of using phylogenetically incongruent genes on posterior time estimates. For each of the four independent gene sets, the divergence time was estimated using the corresponding calibration set (Dataset S2.1) with MCMCTree (see supplementary text section S3.4, Supplementary Material online). The Bayesian sequential dating approach was not applied for this purpose. The topologies used in each dating analysis (see supplementary text section S3.2, Supplementary Material online) were constructed with bacterial genomes only (“Battistuzzi25”), bacterial genomes and nuclear genomes of eukaryotes (“Gomez19”), bacterial genomes and mitochondrial genomes of eukaryotes (“Mito24”), and bacterial genomes and plastid genomes of eukaryotes (“Plastid39”). a) The change of posterior age estimates of the Gammaproteobacterial AOB (Gamma-AOB), Betaproteobacterial AOB (Beta-AOB), comammox bacteria (CAOB), and anammox bacteria (AnAOB) along with the change of the number of genes by gradually removing two genes that are most topologically incongruent with the species tree (i.e. the largest ΔLL). The time estimates refer to the age of the total group of each lineage. The two vertical gray bars represent the GOE occurring at 2,500 to 2,320 Ma and the Neoproterozoic Oxygenation Event (NOE) at 800 to 550 Ma, respectively. b) The change of the time difference between Gamma-AOB and AnAOB along with the change of the number of genes by gradually removing the two genes with the largest ΔLL. The left y-axis shows values calculated by subtracting the mean time estimates of the total group of Gamma-AOB from those of the total group of AnAOB. The right y-axis values indicate the mean ΔLL value of the remaining genes following gene removal. c) The scatter plot shows the estimated age difference between Gamma-AOB and AnAOB of analysis using genes selected with the sliding window approach with a window size of k genes (k = 6, 8, 10, 12) and a step size of one gene. The x-axis shows the mean ΔLL of the ten genes selected each time. The y-axis shows values calculated by subtracting the mean time estimates of the total group of Gamma-AOB from the mean time estimates of the total group of AnAOB.
Fig. 4.
Fig. 4.
The MDS analyses of 1,119 genomes including xmoA-containing genomes and their phylogenetic relatives that do not contain xmoA. The MDS analyses were performed based on metabolic similarity according to the presence and absence of KEGG-annotated genes (a) and nucleotide similarity according to the k-mer-based metric (b). Each node represents a genome. The filled color represents the presence and absence of XMO and the type of XMO. The node border color indicates the taxonomic lineages. c) Distributions of genes statistically associated with amoCAB among the 1,119 genomes (see supplementary text section S4, Supplementary Material online). The rows and columns represent genomes and KEGG-annotated genes, respectively. To visualize the associations between AMO and other genes, the presence of KEGG-annotated genes in AOB/CAOB, MOB, and other bacteria is highlighted separately. The rightmost column shows the taxonomic affiliation of the genome. d) Summary distribution of amoCAB-associated genes. The prevalence of the gene among the genomes in a taxonomic lineage or a focal lineage is categorized into four groups distinguished by four colors. Three focal lineages, namely Betaproteobacterial AOB (Beta-AOB), Gammaproteobacterial AOB (Gamma-AOB), and CAOB, are framed in black boxes. amo, ammonia monooxygenase; pmo, methane monooxygenase; pxm, copper membrane monooxygenase of unknown function; nirK, nitrite reductase; amt, ammonium transporter; Rh, ammonium transporter; ure, urease; uca, urea carboxylase; utp, urea transporter; copC, copper resistance protein C; ycnJ, copper transport protein; torY, trimethylamine-N-oxide reductase; ODC, ornithine decarboxylase; ynfA, inner membrane protein; spoIVFB, stage IV sporulation protein; gldC, homodimeric glycine dehydrogenase; gcvPAB, heterotetrameric glycine dehydrogenase; modABC, molybdate transport system; moaABCEX, molybdenum cofactor biosynthesis; moeA, molybdopterin molybdotransferase.

Similar articles

Cited by

References

    1. Ader M, Thomazo C, Sansjofre P, Busigny V, Papineau D, Laffont R, Cartigny P, Halverson GP. Interpretation of the nitrogen isotopic composition of Precambrian sedimentary rocks: assumptions and perspectives. Chem Geol. 2016:429:93–110. 10.1016/j.chemgeo.2016.02.010. - DOI
    1. Anbar AD, Knoll AH. Proterozoic ocean chemistry and evolution: a bioinorganic bridge? Science. 2002:297(5584):1137–1142. 10.1126/science.1069651. - DOI - PubMed
    1. Aramaki T, Blanc-Mathieu R, Endo H, Ohkubo K, Kanehisa M, Goto S, Ogata H. KofamKOALA: KEGG Ortholog assignment based on profile HMM and adaptive score threshold. Bioinformatics. 2020:36(7):2251–2252. 10.1093/bioinformatics/btz859. - DOI - PMC - PubMed
    1. Aukema KG, Tassoulas LJ, Robinson SL, Konopatski JF, Bygd MD, Wackett LP. Cyanuric acid biodegradation via biuret: physiology, taxonomy, and geospatial distribution. Appl Environ Microbiol. 2020:86(2):e01964-19. 10.1128/AEM.01964-19. - DOI - PMC - PubMed
    1. Battistuzzi FU, Hedges SB. A major clade of prokaryotes with ancient adaptations to life on land. Mol Biol Evol. 2009:26(2):335–343. 10.1093/molbev/msn247. - DOI - PubMed