

Metagenomic insights into the relationship between intestinal flora and residual feed intake of meat ducks
- PMID: 38776859
- PMCID: PMC11141266
- DOI: 10.1016/j.psj.2024.103836
Metagenomic insights into the relationship between intestinal flora and residual feed intake of meat ducks
Abstract
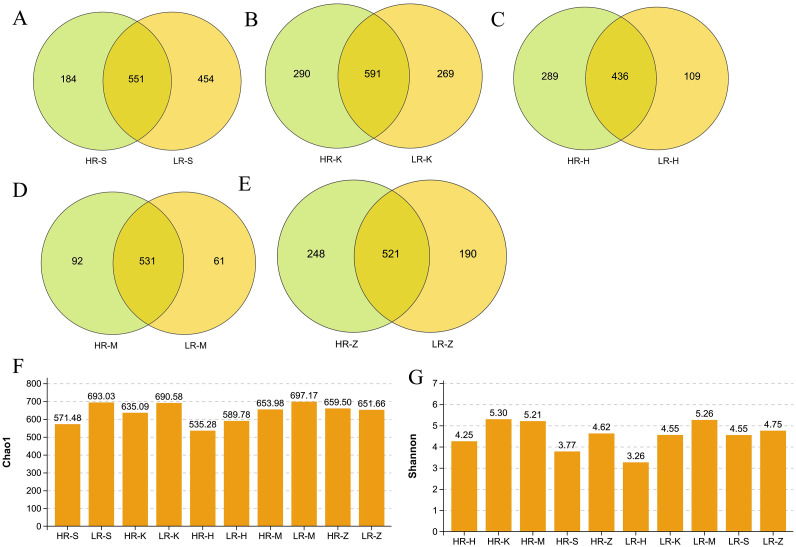
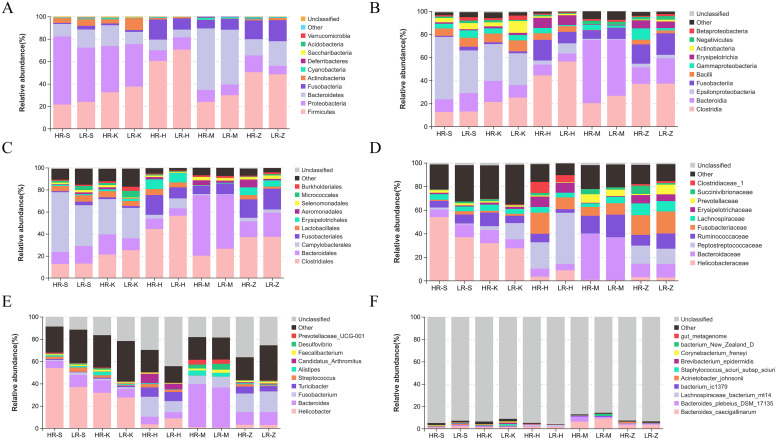
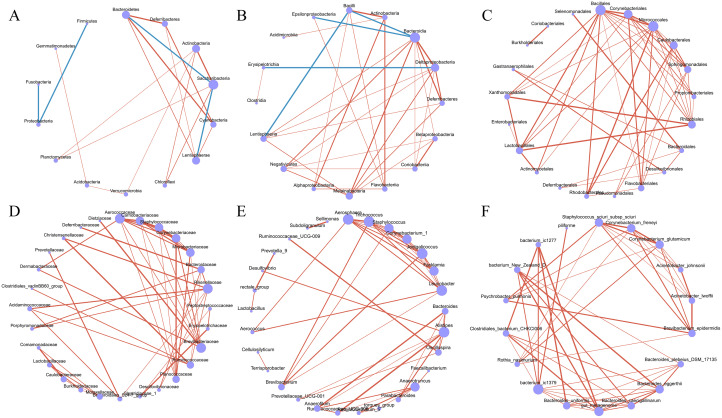
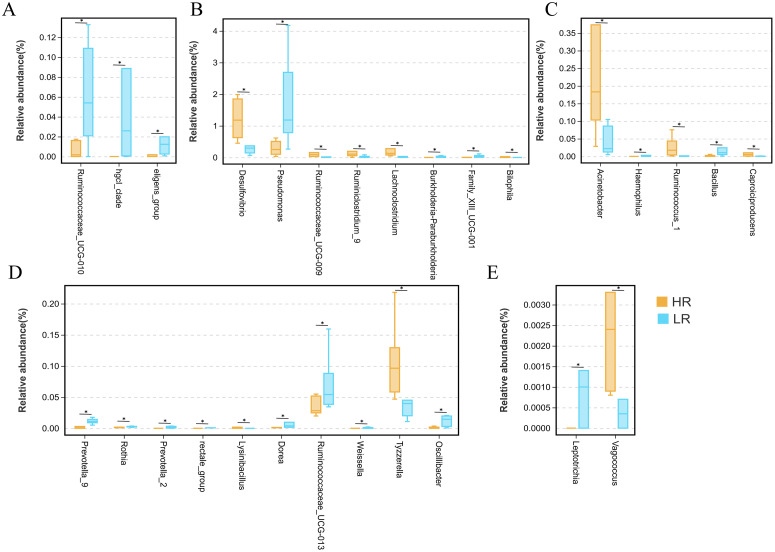
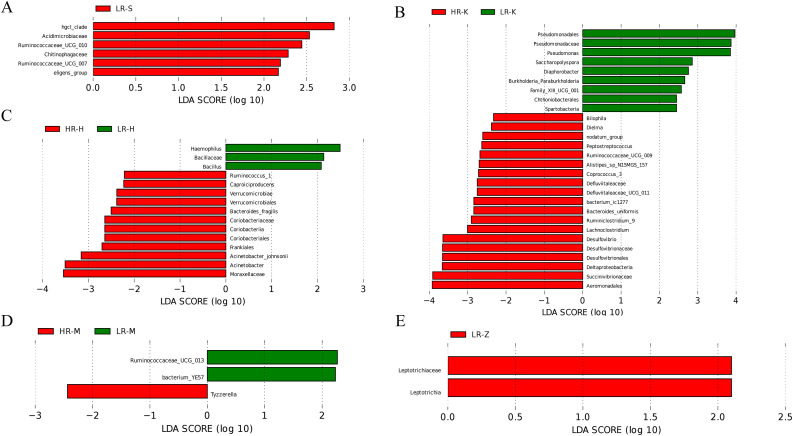
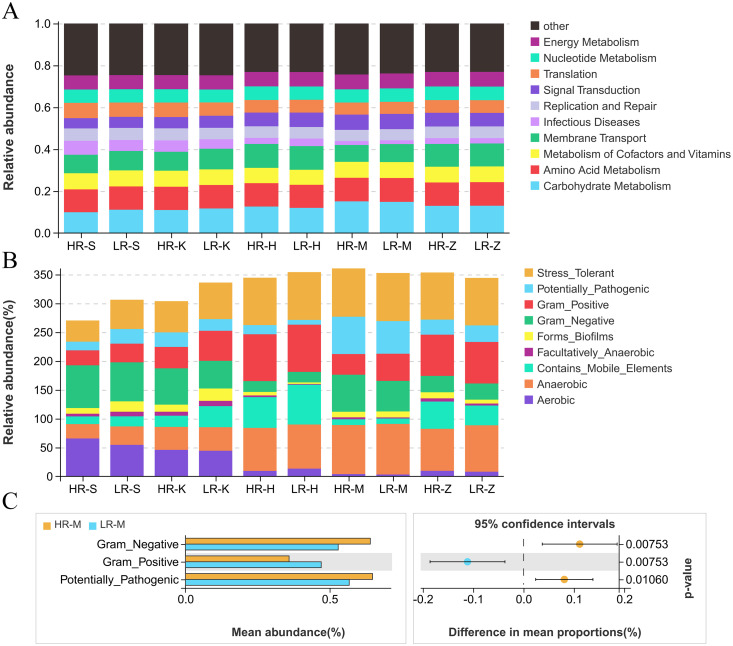
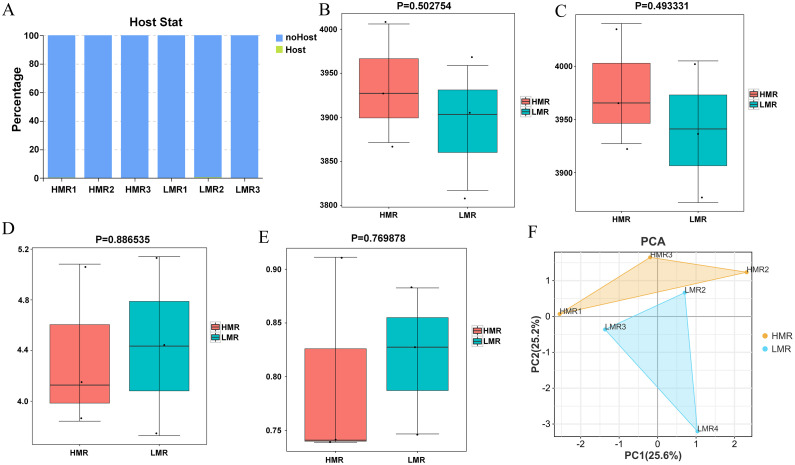
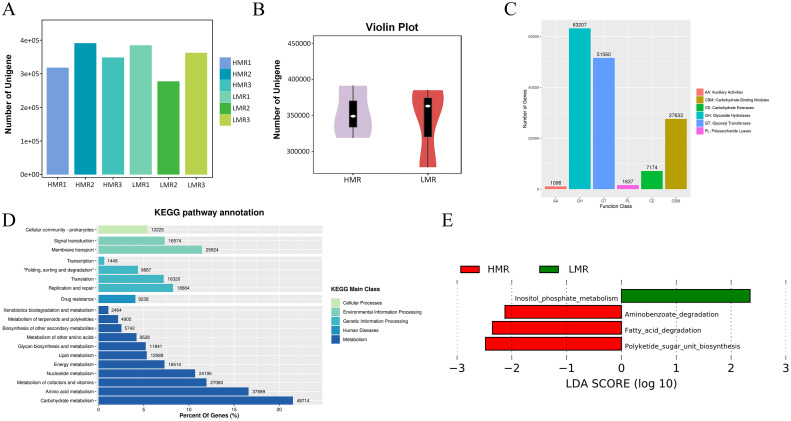
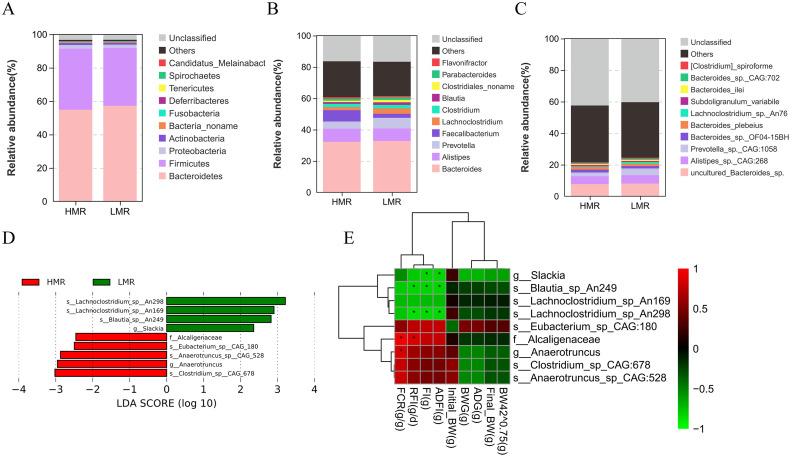
In this study, we sought to determine the effects of intestinal flora on the feed efficiency of meat ducks by evaluating the correlation between intestinal flora and residual feed intake. The F2 generation of Cherry Valley ducks × Runzhou Crested White ducks was used as the study subjects, and feed consumption being recorded from d 21 to 42. RFI was calculated based on growth performance, and 20 low RFI and 20 high RFI ducks were randomly selected to characterize the effect of RFI on growth performance. To analyze the intestinal flora affecting RFI, 16s rDNA sequencing was performed on the contents of 5 intestinal segments from the HR and LR groups, and macrogenomic sequencing was performed on the cecal contents. Feed intake, average daily feed intake, feed conversion ratio, and residual feed intake were lower in low RFI. Analysis of the intestinal flora revealed the cecum to be more highly enriched in the carbohydrate metabolism pathway and less enriched with potentially pathogenic taxa than the other assessed intestinal regions. Further analysis of the cecal microbiota identified nine significantly differentially enriched intestinal flora. In this study, we accordingly identified a basis for the mechanisms underlying the effects of the intestinal flora on meat duck feed efficiency.
Keywords: 16s rDNA; intestinal flora; meat duck; metagenome; residual feed intake.
Copyright © 2024. Published by Elsevier Inc.
Figures
Similar articles
-
Metagenomic insights into the relationship between gut microbiota and residual feed intake of small-sized meat ducks.Front Microbiol. 2023 Jan 18;13:1075610. doi: 10.3389/fmicb.2022.1075610. eCollection 2022. Front Microbiol. 2023. PMID: 36741899 Free PMC article.
-
Integrated transcriptome and microbiome analyses of residual feed intake in ducks during high production period.Poult Sci. 2024 Jun;103(6):103726. doi: 10.1016/j.psj.2024.103726. Epub 2024 Apr 3. Poult Sci. 2024. PMID: 38636203 Free PMC article.
-
Gut-brain bidirectional determination in regulating the residual feed intake of small-sized meat ducks.Poult Sci. 2024 Jul;103(7):103778. doi: 10.1016/j.psj.2024.103778. Epub 2024 Apr 22. Poult Sci. 2024. PMID: 38703760 Free PMC article.
-
Effects of residual feed intake divergence on growth performance, carcass traits, meat quality, and blood biochemical parameters in small-sized meat ducks.Poult Sci. 2022 Sep;101(9):101990. doi: 10.1016/j.psj.2022.101990. Epub 2022 Jun 2. Poult Sci. 2022. PMID: 35841639 Free PMC article.
-
Review: divergent selection for residual feed intake in the growing pig.Animal. 2017 Sep;11(9):1427-1439. doi: 10.1017/S175173111600286X. Epub 2017 Jan 25. Animal. 2017. PMID: 28118862 Free PMC article. Review.
Cited by
-
Comparative analysis of duck meat quality in different breeds and age.Food Chem X. 2025 Jun 10;29:102651. doi: 10.1016/j.fochx.2025.102651. eCollection 2025 Jul. Food Chem X. 2025. PMID: 40606745 Free PMC article.
-
Fecal microbiota transplantation improves Sansui duck growth performance by balancing the cecal microbiome.Sci Rep. 2025 Jul 1;15(1):22403. doi: 10.1038/s41598-025-04942-0. Sci Rep. 2025. PMID: 40593020 Free PMC article.
-
Exploring the molecular basis of efficient feed utilization in low residual feed intake slow-growing ducks based on breast muscle transcriptome.Poult Sci. 2025 Jan;104(1):104613. doi: 10.1016/j.psj.2024.104613. Epub 2024 Nov 28. Poult Sci. 2025. PMID: 39631277 Free PMC article.
References
MeSH terms
Substances
LinkOut - more resources
Full Text Sources
Miscellaneous
