. 2024 May 21;5(5):101556.
doi: 10.1016/j.xcrm.2024.101556.

Transcriptomic and spatial dissection of human ex vivo right atrial tissue reveals proinflammatory microvascular changes in ischemic heart disease

Affiliations

Transcriptomic and spatial dissection of human ex vivo right atrial tissue reveals proinflammatory microvascular changes in ischemic heart disease

Suvi Linna-Kuosmanen et al. Cell Rep Med. .

Abstract

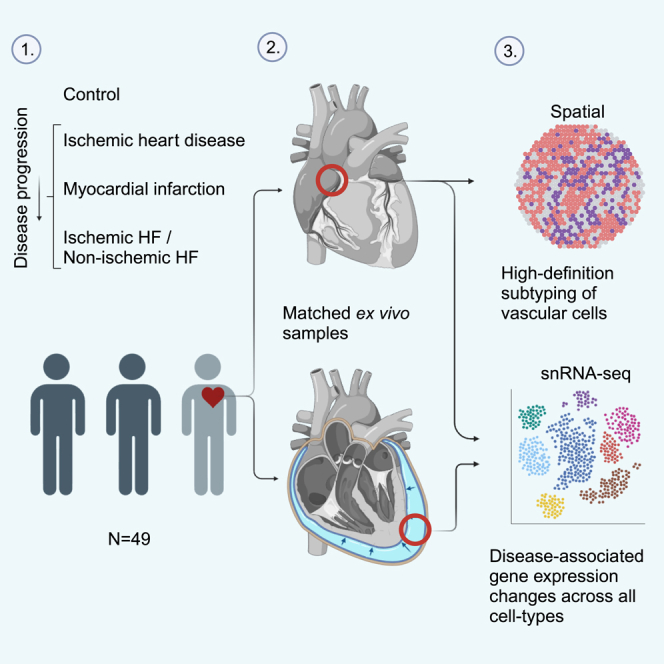
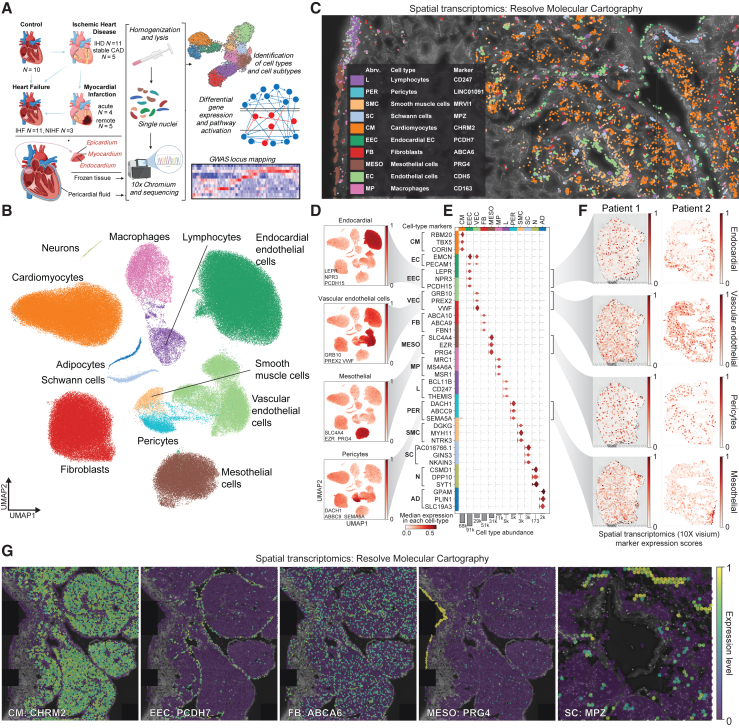
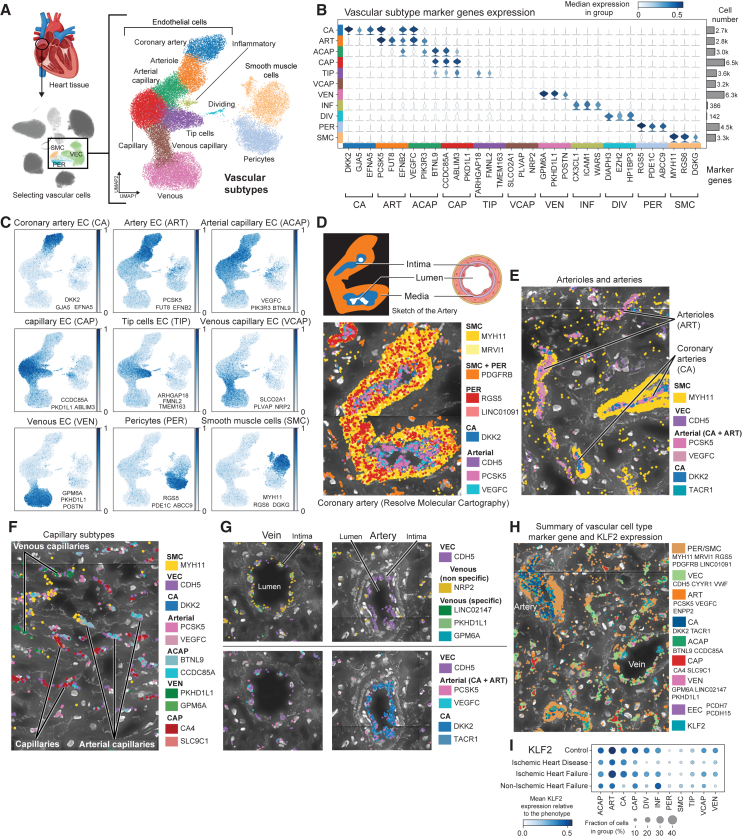
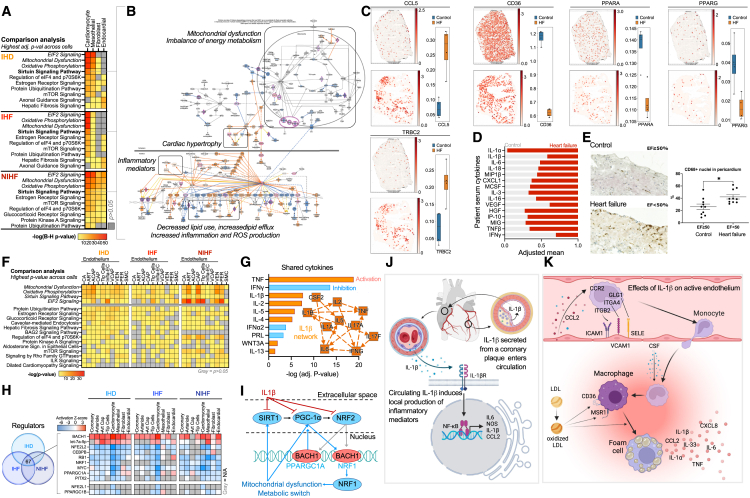
Cardiovascular disease plays a central role in the electrical and structural remodeling of the right atrium, predisposing to arrhythmias, heart failure, and sudden death. Here, we dissect with single-nuclei RNA sequencing (snRNA-seq) and spatial transcriptomics the gene expression changes in the human ex vivo right atrial tissue and pericardial fluid in ischemic heart disease, myocardial infarction, and ischemic and non-ischemic heart failure using asymptomatic patients with valvular disease who undergo preventive surgery as the control group. We reveal substantial differences in disease-associated gene expression in all cell types, collectively suggesting inflammatory microvascular dysfunction and changes in the right atrial tissue composition as the valvular and vascular diseases progress into heart failure. The data collectively suggest that investigation of human cardiovascular disease should expand to all functionally important parts of the heart, which may help us to identify mechanisms promoting more severe types of the disease.

Keywords: cardiovascular disease; disease mechanism; genetic variation; heart; heart failure; inflammation; ischemic heart disease; single cell; spatial transcriptomics; transcriptomics.


Conflict of interest statement

Declaration of interests Authors declare no competing interests.

Figures

None
Graphical abstract
Figure 1
Figure 1
Cells of the ex vivo right atrium (A) Overview of the samples and experimental approach. Created using BioRender.com. (B) snRNA-seq data distinguishes 12 main cell types. (C) Spatial transcriptomics image (Resolve Biosciences) of the cardiac tissue in IHD sample. (D) snRNA-seq data highlight the expression of the marker genes for EEC (LEPR, NPR3, and PCDH15), VEC (GRB10, PREX2, and VWF), MESO (SLC4A4, EZR, and PRG4), and PER (DACH1, ABCC9, and SEMA5A). (E) Violin plot of the marker genes from (D) and other main cell types from (B). (F) Spatial expression (Visium, 10X Genomics) of the marker genes for EEC (LEPR, NPR3, and PCDH15), VEC (GRB10, PREX2, and VWF), MESO (SLC4A4, EZR, and PRG4), and PER (DACH1, ABCC9, and SEMA5A) in control (patient 1) and IHF (patient 2) samples. (G) Spatial expression (Resolve Biosciences) of the CM (CHRM2), EEC (PCDH7), FB (ABCA6), MESO (PRG4), and Schwann cell (SC) (MPZ) marker genes in the right atrial tissue of IHD sample. MESO, epicardial mesothelial cell; L, lymphocyte; PER, pericyte; SMC, smooth muscle cell; N, neuron; AD, adipocyte.
Figure 2
Figure 2
High-definition map of the right atrial vasculature (A) Uniform manifold approximation and projection (UMAP) embedding of the snRNA-seq data for vascular cell subtypes, separating distinct EC, SMC, and PER populations. Heart image from BioRender.com. (B) Marker genes for vascular subtypes: coronary artery (CA), arteriole (ART), arterial capillary (ACAP), capillary (CAP), tip cells (TIP), venous capillary (VCAP), venous (VEN), inflammatory ECs (INF), dividing ECs (DIV). (C) UMAP embeddings showing vascular marker gene expression for CA (DKK2, GJA5, and EFNA5), ART (PCSK5, FUT8, and EFNB2), ACAP (VEGFC, PIK3R3, and BTNL9), CAP (CCDC85A, ABLIM3, and PKD1L1), TIP (ARHGAP18, FMNL2, and TMEM163), VCAP (SLCO2A1, PLVAP, and NRP2), VEN (GPM6A, PKHD1L1, and POSTN), PER (RGS5, PDE1C, and ABCC9), and SMC (MYH11, RGS6, and DGKG). (D–G) Spatial images (Resolve Biosciences) of coronary arteries and arterioles (D and E), venous and arterial capillaries (F), and a vein and an artery (G) in right atrial tissue of control (D), IHF (E and F), and IHD (G) samples. Cross-section of an artery from BioRender. (H) Summary image (Resolve Biosciences) of KLF2 expression in an IHF sample. (I) KLF2 expression in snRNA-seq data across disease groups in vascular cell subtypes.
Figure 3
Figure 3
Heart disease promotes inflammatory microvascular dysfunction in the right atrium (A) Top 10 canonical pathways with the highest significance score (B–H adjusted p value <0.05 for all) by IPA’s comparison analysis across the main cell types, as described in STAR Methods, in IHD (N = 11), IHF (N = 11), and NIHF (N = 3) against control (N = 6). Full table and details available at http://compbio2.mit.edu/scheart/. (B) Sirtuin signaling pathway from IPA for CMs in NIHF against control as a representative for all three groups. Blue indicates inhibition of the molecule, orange/red activation. Purple highlight marks significantly differentially expressed molecules in the dataset. Full version of the pathway figure can be found in Figure S2A. (C) Spatial expression (Visium) of TRBC, CCL5, CD36, PPARA, and PPARG in a control and heart failure (HF) sample. For each gene, quantitation of the signal is shown across control (n = 4) and HF (n = 4) sections (right) and in one representative section (left), as described in STAR Methods. Whiskers show the maximum and minimum values, except for outliers (more than 1.5 times the interquartile). (D) Scaled (0–1) mean of serum cytokines in patients with HF (N = 6) and controls (N = 7). No statistical significance. (E) Quantitation of CD68+ tissue MPs in pericardium of patients with HF (N = 10) and control group (N = 10) (∗p < 0.0104). A representative immunohistostaining image provided for both groups, showing MPs in brown. (F) Top 10 canonical pathways with the highest significance score (Fisher’s exact test, p < 0.05 for all) across vascular cells within each group: IHD, IHF, and NIHF. Top 10 pathways for each condition were selected and p value is presented across all conditions. (G) Top shared cytokines in IPA’s Upstream Regulator analysis between IHD, IHF, NIHF, and disturbed flow in HUVECs dataset (N = 3 for d-flow and for control). IL-1β network from 2-h time point by IPA’s machine-learning-based graphical summary is a representative for all four time points (2, 8, 14, and 32 h of IL-1β treatment compared to control [N = 3] in HAECs). (H) Top overlapping upstream regulators (Fisher’s exact test p < 0.05 for all) with similar activity patterns from IPA (microRNAs and transcriptional regulators only) for IHD, IHF, and NIHF in main cell types and four EC subtypes. Red is for predicted activity and blue for inhibition. (I) Depiction of the connections between the potential mediators of the mitochondrial and metabolic changes. (J) Overview of IL-1β signaling. (K) Effects of IL-1β on activated endothelium. (J) and (K) were created with BioRender.com.
Figure 4
Figure 4
Disease-driven immune cell accumulation causes chronic inflammation in the atrium (A) snRNA-seq for immune cell subtypes in right atrial tissue separating 14 populations. Heart image from BioRender.com. (B) Marker genes for immune subtypes (DCs, MPs, LAMs, IFN-MPs, monocytes [mono]). (C) Spatial expression images (Resolve Biosciences) of the right atrial tissue in IHD samples, depicting immune cells as marked by the expression of their marker genes near epicardial mesothelium and vasculature. (D) Immune cell proportions in control, IHD, IHF, and NIHF samples. Bar charts depict the immune cell subtype proportions (%) of all cells in each sample for LT-CD4, infla-MP, and NKT-CD8 in control, IHD, IHF, and NIHF groups. Whiskers show the maximum and minimum values, except for outliers (more than 1.5 times the interquartile). (E) Spatial expression (Visium) of NPPB, ACTA1, and immunoglobulins in a control and heart failure (HF) sample. Quantitation of the signal across control (n = 4) and HF (n = 4) sections is shown (as described in STAR Methods). Whiskers show the maximum and minimum values, except for outliers (more than 1.5 times the interquartile). Representative Visium images shown for CD163, LYVE1, and IL7R expression. (F) LAM1 and LAM2 proportions (%) of all cells in each control, IHD, IHF, and NIHF sample depicted by groups. Whiskers show the maximum and minimum values, except for outliers (more than 1.5 times the interquartile). (G) Immunofluorescence images of LAMs labeled using anti-TREM2 (red) and bodipy (green) in the epicardial side of the human right atrial appendage. Patients with IHF (middle panel) had increased number of LAMs compared to patients with IHD (left panel). Right panel shows zoomed region of interest from the merged image. Representative samples are shown. (H) Top canonical pathways with highest activation Z scores for LAMs in IHD (N = 11), IHF (N = 11), and NIHF (N = 3) against control (N = 6) based on IPA analysis. Predicted pathway activation is shown in red and inhibition in blue based on the expression changes of the pathway molecules in the dataset and current literature-based knowledge curated into the QIAGEN Knowledge Base. Gray is for enriched pathways with (B)–(H) adjusted p value over 0.05 and white with x for no enrichment. All pathways with activation Z score are statistically significant (B–H adjusted p value <0.05). A representative glucocorticoid receptor pathway chart is shown.
Figure 5
Figure 5
Pericardial fluid cells reflect the changes in disease states (A and B) (A) snRNA-seq data and (B) marker genes for immune cell subtypes in pericardial fluid. Heart image by BioRender.com. (C) Immune cell proportions in cardiac tissue and corresponding pericardial fluid samples. (D and E) Top 10 pathways with highest significance score in IPA comparison analysis (B–H adjusted p value <0.05) in cardiac tissue (D) and corresponding pericardial fluid samples (E) in stable CAD (N = 5), acute MI (N = 4), and remote MI (N = 5) compared to control (N = 4). Only the top 10 for each group are shown. Full data can be explored at http://compbio2.mit.edu/scheart/. (F) Top pathways based on activation Z score from IPA for each condition in fluid and tissue IFN-MPs. Positive values indicate pathway activation based on underlying gene expression patterns and blue pathway inhibition. (G) Jaccard similarity coefficiency for differentially expressed genes (DEGs) in IFN-MPs. (H) Correlation of log fold change (logFC) values of overlapping DEGs (i.e., found in all compared groups) in IFN-MPs. (I) Correlation of logFC values of all DEGs in IFN-MPs. (J) Correlation of activation Z scores for enriched pathways in IFN-MPs. (K and L) Regulator networks for stable CAD and remote MI in IFN-MPs from IPA’s graphical summary.
Figure 6
Figure 6
Disease-associated genetic variation affects disease-relevant modules across cell types (A) Gene expression modules in IFN-MPs of the pericardial fluid. (B) IFN-MP proportions (%) of all cells depicted by group. Whiskers show the maximum and minimum values, except for outliers (more than 1.5 times the interquartile). (C) Representative Visium images shown for CXCL10 expression. (D) Spatial images (Resolve) for EC (EMCN, ERG, PECAM1, CDH5, VWF), VEC (DKK2, ENPP2, PCSK5, CYYR1), EEC (PCDH7), SMC (NTRK3, MRVII), L (BCL11B, CD247, SKAP1, THEMIS), MP (CD163, MRC1, F13A1, MS4A6A), inflammatory (CCL8 and EGR2), and CXCL10 gene expression in IHD (upper panel and lower left) and control (lower right) samples. (E) Gene expression modules for vascular cells (all subtypes combined) highlighting interferon module, its genes (GWAS-linked genes in red), and pathway enrichments. (F) Enrichments of the interferon module across vascular cells.
Figure 7
Figure 7
Dissection of JCAD/SVIL locus (A and B) Gene expression module for SVIL in SMCs (A) and pericardial fluid cells (B). GWAS-linked genes in red. (C) Epimap linking of the JCAD/SVIL locus. (D) Illustration of LD SNPs of the natural European haploblock combined with the single-cell assay for transposase-accessible chromatin with sequencing (scATAC-seq) data from human coronary arteries generated using LDlink. (E) Allele-specific enhancer activity measured with STARR-seq in teloHAECs under basal and inflammatory conditions (6 h IL-1β) and HASMCs subjected to cholesterol loading for 24 h. SNPs demonstrating significant changes (false discovery rate [FDR] <0.1) in enhancer activity. (F) Transcription factor binding motifs altered by rs148641196. Position weight matrix scores shown for reference and alternate. (G) Changes in transcription factor ETS1 and IRF3 gene expression in capillary ECs in IHD and IHF in snRNA-seq by Nebula. (∗∗p < 0.01, ∗∗∗p < 0.001)

References

    1. Wang L., Yu P., Zhou B., Song J., Li Z., Zhang M., Guo G., Wang Y., Chen X., Han L., Hu S. Single-cell reconstruction of the adult human heart during heart failure and recovery reveals the cellular landscape underlying cardiac function. Nat. Cell Biol. 2020;22:108–119. - PubMed
    1. Litviňuková M., Talavera-López C., Maatz H., Reichart D., Worth C.L., Lindberg E.L., Kanda M., Polanski K., Heinig M., Lee M., et al. Cells of the adult human heart. Nature. 2020;588:466–472. - PMC - PubMed
    1. Tucker N.R., Chaffin M., Fleming S.J., Hall A.W., Parsons V.A., Bedi K.C., Jr., Akkad A.-D., Herndon C.N., Arduini A., Papangeli I., et al. Transcriptional and cellular diversity of the human heart. Circulation. 2020;142:466–482. - PMC - PubMed
    1. Hocker J.D., Poirion O.B., Zhu F., Buchanan J., Zhang K., Chiou J., Wang T.-M., Zhang Q., Hou X., Li Y.E., et al. Cardiac cell type-specific gene regulatory programs and disease risk association. Sci. Adv. 2021;7 - PMC - PubMed
    1. Nicin L., Schroeter S.M., Glaser S.F., Schulze-Brüning R., Pham M.-D., Hille S.S., Yekelchyk M., Kattih B., Abplanalp W.T., Tombor L., et al. A human cell atlas of the pressure-induced hypertrophic heart. Nat. Cardiovasc. Res. 2022;1:174–185.